. 2025 Apr 24;26(9):4033.
doi: 10.3390/ijms26094033.

FAM20B-Catalyzed Glycosylation Regulates the Chondrogenic and Osteogenic Differentiation of the Embryonic Condyle by Controlling IHH Diffusion and Release

Affiliations

FAM20B-Catalyzed Glycosylation Regulates the Chondrogenic and Osteogenic Differentiation of the Embryonic Condyle by Controlling IHH Diffusion and Release

Xiaoyan Chen et al. Int J Mol Sci. .

Abstract

Although the roles of proteoglycans (PGs) have been well documented in the development and homeostasis of the temporomandibular joint (TMJ), how the glycosaminoglycan (GAG) chains of PGs contribute to TMJ chondrogenesis and osteogenesis still requires explication. In this study, we found that FAM20B, a hexokinase essential for attaching GAG chains to the core proteins of PGs, was robustly activated in the condylar mesenchyme during TMJ development. The inactivation of Fam20b in craniofacial neural crest cells (CNCCs) dramatically reduced the synthesis and accumulation of GAG chains rather than core proteins in the condylar cartilage, which resulted in a hypoplastic condylar cartilage by severely promoting chondrocyte hypertrophy and perichondral ossification. In the condyles of Wnt1-Cre;Fam20bf/f mouse embryos, enlarged Ihh- and COL10-expressing domains indicated premature hypertrophy resulting from an attenuated IHH-PTHRP negative feedback in condylar chondrocytes, while increased osteogenic markers, canonical Wnt activity, and type-H angiogenesis verified the enhanced osteogenesis in the perichondrium. Further ex vivo investigations revealed that the loss of Fam20b decreased the domain area but increased the activity of HH signaling in the embryonic condylar mesenchyme. Moreover, the abrogation of GAG chains in heparan sulfate and chondroitin sulfate proteoglycans led to a rapid up- and then downregulation of HH signaling in condylar chondrocytes, implicating a "slow-release" manner of growth factors controlled by GAG chains. Overall, this study revealed a comprehensive role of the FAM20B-catalyzed GAG chain synthesis in the chondrogenic and osteogenic differentiation of the embryonic TMJ condyle.

Keywords: FAM20B; endochondral osteogenesis; glycosaminoglycan chain; proteoglycan; temporomandibular joint.


Conflict of interest statement

The authors declare no potential conflicts of interest with respect to the authorship and/or publication of this article.

Figures

Figure 1
Figure 1
Fam20b expression pattern and reduced GAG chains in Wnt1-Cre;Fam20bf/f TMJ. (A) In situ hybridization of Fam20b in E14.5, E15.5, and E16.5 TMJ of WT mice. The lower panel shows the magnified views of the red boxes in the corresponding upper panel. Arrows indicate the hair follicles and epidermis. (B) Boxplots depicting Fam20b transcription in E16.5 WT and Wnt1-Cre;Fam20bf/f mice (1227 ± 338 vs. 510 ± 229, p = 0.04, n = 3). * p < 0.05. (C,D) Alcian blue and Safranin-O fast green staining of E16.5 and E18.5 WT and Wnt1-Cre;Fam20bf/f TMJ. (c, condyle; mc, Meckel’s cartilage; mas, masseter muscle; lpm, lateral pterygoid muscle; gf, glenoid fossa; agp, angular process; scale bars, 100 μm.)
Figure 2
Figure 2
The histological assay of the embryonic Wnt1-Cre;Fam20bf/f TMJ. (A) Whole-mount bone and cartilage staining of P0 WT and Wnt1-Cre;Fam20bf/f condyles. The red arrowheads indicate the condylar cartilage in the Wnt1-Cre;Fam20bf/f mandible. (BD) Masson staining of the E15.5 (B), E16.5 (C), and E18.5 (D) WT and Wnt1-Cre;Fam20bf/f TMJ. The black and yellow boxes in the left panels are amplified, respectively, into the corresponding black and yellow boxed images in the right panels. The black arrow points to the hypertrophic chondrocytes, while the black arrowhead points to pre-hypertrophic or proliferating chondrocytes in (B). The dashed yellow lines delineate the length of the hypertrophic zone, while the dashed blue lines delineate the pre-hypertrophic zone in (C,D). (E) BrdU labeling shows the proliferating cells in E15.5 and E16.5 WT and Wnt1-Cre;Fam20bf/f condylar processes. The dashed green lines delineate the articular cartilage, while the dashed blue lines delineate the perichondrium. (F) Statistical assay of the density of BrdU-positive cells in (E). The densities of proliferating cells are represented as mean ± SD: articular (E15.5: 5193 ± 425 cells/mm2 vs. 4199 ± 503 cells/mm2, p = 0.023, n = 3; E16.5, 4107 ± 234 cells/mm2 vs. 3325 ± 388 cells/mm2, p = 0.014, n = 3) and perichondrium (E15.5, 4104 ± 136 cells/mm2 vs. 4104 ± 629 cells/mm2, p = 0.789, n = 3; E16.5, 2200 ± 171 cells/mm2 vs. 3025 ± 371 cells/mm2, p = 0.007, n = 3); ** p < 0.01. * p < 0.05. (c, condyle; mc, Meckel’s cartilage; mas, masseter muscle; lpm, lateral pterygoid muscle; gf, glenoid fossa; agp, angular process; uc, upper joint cavity; lc, lower joint cavity; fl, fibrous cell layer; pl, proliferative cell layer; ph, pre-hypertrophic chondrocytes; hc, hypertrophic chondrocytes; scale bars, 100 μm.)
Figure 3
Figure 3
The premature differentiation of condylar chondrocytes in Wnt1-Cre;Fam20bf/f TMJ. (A) Volcano plot showing the DEGs in the E16.5 Wnt1-Cre;Fam20bf/f vs. WT condyles. (B) Heat map showing the chondrogenic differentiation- and maturation-related genes in the DEGs. The color and size of dots in the right box represent gene expression abundance and p-value, respectively. (C) Immunofluorescence staining of SOX9 in the E14.5 and E16.5 WT and Wnt1-Cre;Fam20bf/f TMJ. The red arrowheads point to the bone collar, and the asterisk points to premature hypertrophic chondrocytes. (D,E) Immunofluorescence staining of COL2 (D) and COL10 (E) in E15.5 and E16.5 WT and Wnt1-Cre;Fam20bf/f mice. The white double-head arrows delineate COL10-positive portions, and the red double-head arrows delineate the total condyle length. (F) Statistical analysis shows the proportions of COL10-positive area to the total length of condylar cartilage in (E). Data are represented as mean ± SD: E15.5, 59.58 ± 4.3% vs. 49.26 ± 3.51%, p = 0.06, n = 3, and E16.5, 69.74 ± 2.33% vs. 81.77 ± 1.21%, p < 0.01, n = 3. (G) Immunofluorescence staining of MMP13 in WT and Wnt1-Cre;Fam20bf/f TMJ. (** p < 0.01; scale bars, 100 μm.)
Figure 4
Figure 4
The perichondrial osteogenesis in Wnt1-Cre;Fam20bf/f TMJ. (A) GO enrichment indicates that the DEGs were mainly involved in bone-, ECM-, and adhesion-related biological processes. (B) In situ hybridization of Runx2, Osterix, and Col1a1 in E15.5 and E16.5 WT and Wnt1-Cre;Fam20bf/f TMJ. The black arrowheads indicate positive cells in the WT and Wnt1-Cre;Fam20bf/f condyles. (C) Immunofluorescence staining of CD31 in E18.5 WT and Wnt1-Cre;Fam20bf/f TMJ. The areas in the white dashed boxes are amplified into the boxes with solid white lines, in which the white arrows indicate CD31-positive cells. (D) X-gal/LacZ staining in the E16.5 WT (left panel) and Wnt1-Cre;Fam20bf/f;BATgal TMJ (right panel). The areas in the black and red boxes are amplified into the black and red boxed images, respectively. The black arrows indicate LacZ-positive cells. Scale bars, 100 μm.
Figure 5
Figure 5
The regulation of GAG chains on IHH signaling in TMJ condylar cartilages. (A,B) In situ hybridization of Ihh, Pthrp, Gli1, and Gli2 expression pattern in E16.5 (A) and E18.5 (B) WT and Wnt1-Cre;Fam20bf/f condylar cartilage. The black arrowheads indicate the upregulated positive signals in Wnt1-Cre;Fam20bf/f condyles. (C) Masson staining of the P0 WT, Wnt1-Cre;Fam20bf/f, Wnt1-Cre;Fam20bf/f;pMes-Ihh, and Wnt1-Cre;pMes-Ihh condyles. (c, condyle; mc, Meckel’s cartilage; mas, masseter muscle; lpm, lateral pterygoid muscle; gf, glenoid fossa; fl, fibrous cell layer; pl, proliferative cell layer; ph, pre-hypertrophic chondrocytes; hc, hypertrophic chondrocytes; scale bars, 100 μm.)
Figure 6
Figure 6
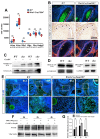
The PG contents, SHH diffusion, and dynamic activity of HH signaling in the absence of GAG chains. (A) Boxplots depicting Aggrecan (Acan), Versican (Vcan), Syndecan-1 (Sdc1), Biglycan (Bgn), Decorin (Dcn), and Perlecan (Hspg2) transcription in E16.5 WT and Wnt1-Cre;Fam20bf/f mice. The blue rectangles represent WT, and the red rectangle represents Wnt1-Cre;Fam20bf/f TMJ. (B) Immunostaining of AGGRECAN, SYNDECAN-1, and VERSICAN in E16.5 WT and Wnt1-Cre;Fam20bf/f condyles. The white double-head arrows delineate AGGRECAN-positive portions, while the red double-head arrows delineate the total condyle length. The black arrowheads indicate SYNDECAN-1-positive cells. The yellow arrowheads indicate VERSICAN in the perichondrium of WT condyles, while the white arrowheads indicate VERSICAN in the central region in Wnt1-Cre;Fam20bf/f condyles. (C) Western blots for VERSICAN in WT and Wnt1-Cre;Fam20bf/f condyles. GAG chains were eliminated by chondroitinase ABC to allow full migration into SDS-PAGE gel. (D) Western blots for BIGLYCAN and DECORIN in WT and Wnt1-Cre;Fam20bf/f condyles. (E) Immunostaining of PTCH1 in E13.5 WT and Wnt1-Cre;Fam20bf/f TMJ explants cultured with BSA or SHH beads (n = 4). The yellow dashed line shows that the PTCH1 domain in WT was significantly larger than that in Wnt1-Cre;Fam20bf/f mice after 16 h culture with SHH-soaked beads. The lower panel shows the magnified views of the white boxes in the corresponding upper panel. (F,G) Western blot analysis (F) and quantitative data (G) of PTCH1 contents in control and chondroitinase ABC- and heparinase III-treated condylar chondrocytes after 0 h, 2 h, and 4 h incubation with SHH, respectively. (ChABC, chondroitinase ABC; HepIII, heparinase III; * p < 0.05; scale bars, 100 μm.)

Similar articles

References

    1. Paganini C., Costantini R., Superti-Furga A., Rossi A. Bone and connective tissue disorders caused by defects in glycosaminoglycan biosynthesis: A panoramic view. FEBS J. 2019;286:3008–3032. doi: 10.1111/febs.14984. - DOI - PubMed
    1. Theocharis A.D., Skandalis S.S., Gialeli C., Karamanos N.K. Extracellular matrix structure. Adv. Drug Deliv. Rev. 2016;97:4–27. doi: 10.1016/j.addr.2015.11.001. - DOI - PubMed
    1. Schwartz N.B., Domowicz M.S. Roles of Chondroitin Sulfate Proteoglycans as Regulators of Skeletal Development. Front. Cell Dev. Biol. 2022;10:745372. doi: 10.3389/fcell.2022.745372. - DOI - PMC - PubMed
    1. Jochmann K., Bachvarova V., Vortkamp A. Heparan sulfate as a regulator of endochondral ossification and osteochondroma development. Matrix Biol. 2014;34:55–63. doi: 10.1016/j.matbio.2013.11.003. - DOI - PubMed
    1. Karamanos N.K., Piperigkou Z., Theocharis A.D., Watanabe H., Franchi M., Baud S., Brezillon S., Gotte M., Passi A., Vigetti D., et al. Proteoglycan Chemical Diversity Drives Multifunctional Cell Regulation and Therapeutics. Chem. Rev. 2018;118:9152–9232. doi: 10.1021/acs.chemrev.8b00354. - DOI - PubMed

LinkOut - more resources