. 2025 Apr 24;26(9):4036.
doi: 10.3390/ijms26094036.

Identification and Exploration of Pyroptosis-Related Genes in Macrophage Cells Reveal Necrotizing Enterocolitis Heterogeneity Through Single-Cell and Bulk-Sequencing

Affiliations

Identification and Exploration of Pyroptosis-Related Genes in Macrophage Cells Reveal Necrotizing Enterocolitis Heterogeneity Through Single-Cell and Bulk-Sequencing

Peipei Zhang et al. Int J Mol Sci. .

Abstract

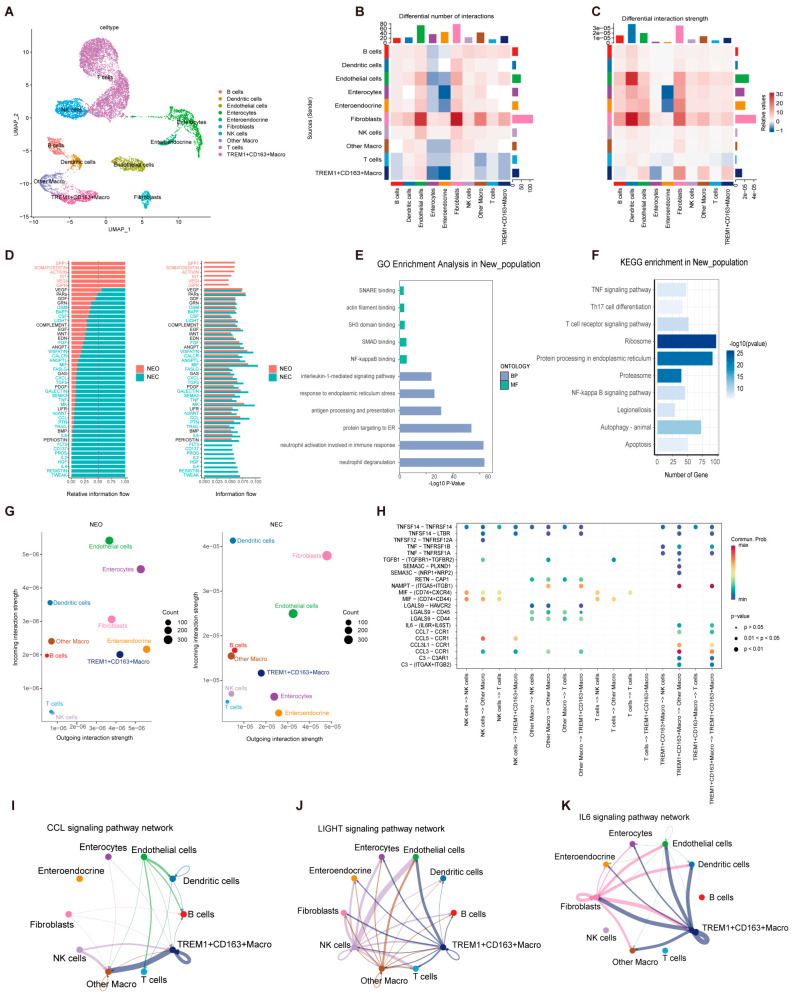
Necrotizing enterocolitis (NEC) is an acute intestine dysfunction intestinal disorder characterized by inflammation and cell death, including pyroptosis. Previous studies have implicated pyroptosis, particularly via NLRP3 inflammatory activation, and contribute to the development of NEC. However, the genetic and molecular mechanisms underlying pyroptosis in NEC pathogenesis and sequelae remain unclear. Our study aimed to identify the pyroptosis-related cell populations and genes and explore potential therapeutic targets. Single-cell RNA sequencing (scRNA-seq) data were analyzed to identify the cell populations related to NEC and pyroptosis. Weighted gene correlation network analysis (WGCNA) of bulk RNA-seq was performed to identify gene modules associate with pyroptosis. Cell-cell communication was employed to investigate intercellular signaling networks. Gene Set Enrichment Analysis (GSEA) was conducted to compare the pathways enriched in the high and low TREM1-expressing subgroups. Immunofluorescence staining was performed to detect the TREM1+CD163+ macrophages in the intestines. PCR and Western blot were performed to detect the expression of mRNA and proteins in the intestine tissues and cells. scRNA-seq analysis revealed increased macrophage abundance in NEC, with one macrophage cluster (cluster 4) exhibiting a markedly elevated pyroptosis score. WGCNA identified a gene module (MEbrown) that positively correlated with pyroptosis. Five genes (TREM1, TLN1, NOTCH2, MPZL1, and ADA) within this module were identified as potential diagnostic markers of pyroptosis. Furthermore, we identified a novel macrophage subpopulation, TREM1+CD163+, in NEC. Cell-cell communication analysis suggested that TREM1+CD163+ macrophages interact with other cells primarily through the NAMPT/ITGA5/ITGB1 and CCL3/CCR1 pathways. GSEA revealed a significant association between high TREM1 expression and pathways related to pyroptosis, cell proliferation, and inflammation. In vivo and in vitro experiments confirmed an increase in TREM1+CD163+ macrophages in NEC-affected intestines. TREM1 inhibition in THP-1 cells significantly reduced the expression of pro-inflammatory cytokines and pyroptosis-related genes and proteins. We identified the TREM1+CD163+ macrophage population that plays a crucial role in pyroptosis during NEC progression. Our findings elucidate the biological functions and molecular mechanisms of TREM1, demonstrating its upregulation in vivo and pro-pyroptosis effects in vitro. These insights advance our understanding of the role of pyroptosis in NEC pathogenesis and suggest TREM1 is a potential therapeutic target for NEC.

Keywords: TREM1; bioinformatics; macrophage; necrotizing enterocolitis; pyroptosis.


Conflict of interest statement

The authors declare that they have no competing interests.

Figures

Figure 1
Figure 1
Clustering and distribution analysis of cell subpopulations. (A) UMAP dimensionality reduction revealed 10 distinct cell subpopulations. (B) UMAP plot showing the distribution of 12 samples. (C) UMAP plot showing the distribution of NEC and neonatal samples. (D) UMAP cluster map of the top marker gene for each cell subtype. (E) Nine cell subpopulations including B cells, dendritic cells, endothelial cells, enterocytes, enteroendocrine cells, fibroblasts, macrophages, NK cells, and T cells were annotated via the singleR package (version 2.8.0). (F) Histograms were performed to analyze cell type proportions. (G) The expression heatmap was used to show the top 6 marker genes in different cell subtypes.
Figure 2
Figure 2
Analysis of pyroptosis-related gene expression and WGCNA results in NEC. (A) Violin plots were displayed to illustrate pyroptosis scores in different cell types. (B) Violin plots were displayed to illustrate pyroptosis scores in different cell clusters. (C) UMAP plot showing cell compositions between NEC and neonatal groups. (D) UMAP plot showing pyroptosis scores’ distribution of cell populations. (E) Heatmap of correlation of modes and phenotypes. (F) Heatmap of correlation of modules and pyroptosis scores. (G) Intersection of MEbrown module, cluster four, and surface genes in NEC and control. (H,I) Distribution of TREM1 and CD163 in the NEC group displayed by UMAP plot.
Figure 3
Figure 3
Characterization of TREM1+CD163+ macrophages and interactions analysis. (A) Identification of TREM1+CD163+ macrophages in the NEC group displayed by UMAP plot. (B,C) Heatmaps displayed the quantity and intensity of interactions between different cell types. (D) Signaling pathway information flow intensity between NEC and neonatal. (E) GO enrichment analysis in TREM1+CD163+ macrophages. (F) KEGG enrichment analysis in TREM1+CD163+ macrophages. (G) The scatter plot showed the number of interactions between the 10 cell clusters in NEC and neonatal (the X-axis represents the number of outgoing interactions and the Y-axis represents the number of incoming interactions). (H) The point diagram showed the receptor–ligand interactions among the cell clusters. (IK) The network showed the interaction intensity between 10 cell clusters through the CCL, LIGHT, and IL-6 signaling pathway network.
Figure 4
Figure 4
Identification of hub gene and GSEA and metabolism analysis in NEC and normal groups. (A) PCA of bulk RNA-seq data. (B) Box plots of feature gene expression between NEC and Control. (C) KEGG enrichment analysis in NEC. (D) GO enrichment analysis in NEC. (E,F) GSEA of metabolic processes between high-TREM1 and low-TREM1 groups. (GJ) Box plot visualizing the pyruvate metabolism, propanoate metabolism, cysteine and methionine metabolism, and riboflavin metabolism between 10 cell clusters. (K) PPI network of significantly differentially expressed pyroptosis-related genes.
Figure 5
Figure 5
The results of experimental verification of the human intestine and cells. (A) Representative images of IF staining for CD163(red) and TREM1 (green). Scale bar = 100 μm. (B) mRNA expression of TREM1 in the control and NEC groups intestine (n = 3). (C,D) Western blotting analysis of TREM-1, NLRP3, caspase-1, caspase-1 P20, caspase-1 P10, GSDMD-n, and IL-1β (E) mRNA expression of TREM1, NLRP3, caspase-1, GSDMD, IL-1β, and IL-18. Data are shown as the means ± SD, * p < 0.05, ** p < 0.01, *** p < 0.001. (F) LDH release value of control, pyroptosis, and siTREM1pyroptosis groups.

Similar articles

References

    1. Charoentong P., Finotello F., Angelova M., Mayer C., Efremova M., Rieder D., Hackl H., Trajanoski Z. Pan-cancer Immunogenomic Analyses Reveal Genotype-Immunophenotype Relationships and Predictors of Response to Checkpoint Blockade. Cell Rep. 2017;18:248–262. doi: 10.1016/j.celrep.2016.12.019. - DOI - PubMed
    1. Huang X., Ye C., Zhao X., Tong Y., Lin W., Huang Q., Zheng Y., Wang J., Zhang A., Mo Y. TRIM45 aggravates microglia pyroptosis via Atg5/NLRP3 axis in septic encephalopathy. J. Neuroinflammation. 2023;20:284. doi: 10.1186/s12974-023-02959-8. - DOI - PMC - PubMed
    1. Hackam D.J., Sodhi C.P. Bench to bedside-new insights into the pathogenesis of necrotizing enterocolitis. Nat. Rev. Gastroenterol. Hepatol. 2022;19:468–479. doi: 10.1038/s41575-022-00594-x. - DOI - PubMed
    1. Bertheloot D., Latz E., Franklin B.S. Necroptosis, pyroptosis and apoptosis: An intricate game of cell death. Cell. Mol. Immunol. 2021;18:1106–1121. doi: 10.1038/s41423-020-00630-3. - DOI - PMC - PubMed
    1. Ketelut-Carneiro N., Fitzgerald K.A. Apoptosis, Pyroptosis, and Necroptosis-Oh My! The Many Ways a Cell Can Die. J. Mol. Biol. 2022;434:167378. doi: 10.1016/j.jmb.2021.167378. - DOI - PubMed

MeSH terms

Substances

LinkOut - more resources