. 2025 Apr 29;26(9):4249.
doi: 10.3390/ijms26094249.

Big Data-Driven Evolution of a Diagnostic Multiplex IgE-Test: Enhancing Accuracy and Efficacy in Allergy Diagnostics

Affiliations

Big Data-Driven Evolution of a Diagnostic Multiplex IgE-Test: Enhancing Accuracy and Efficacy in Allergy Diagnostics

Christian Lupinek et al. Int J Mol Sci. .

Abstract

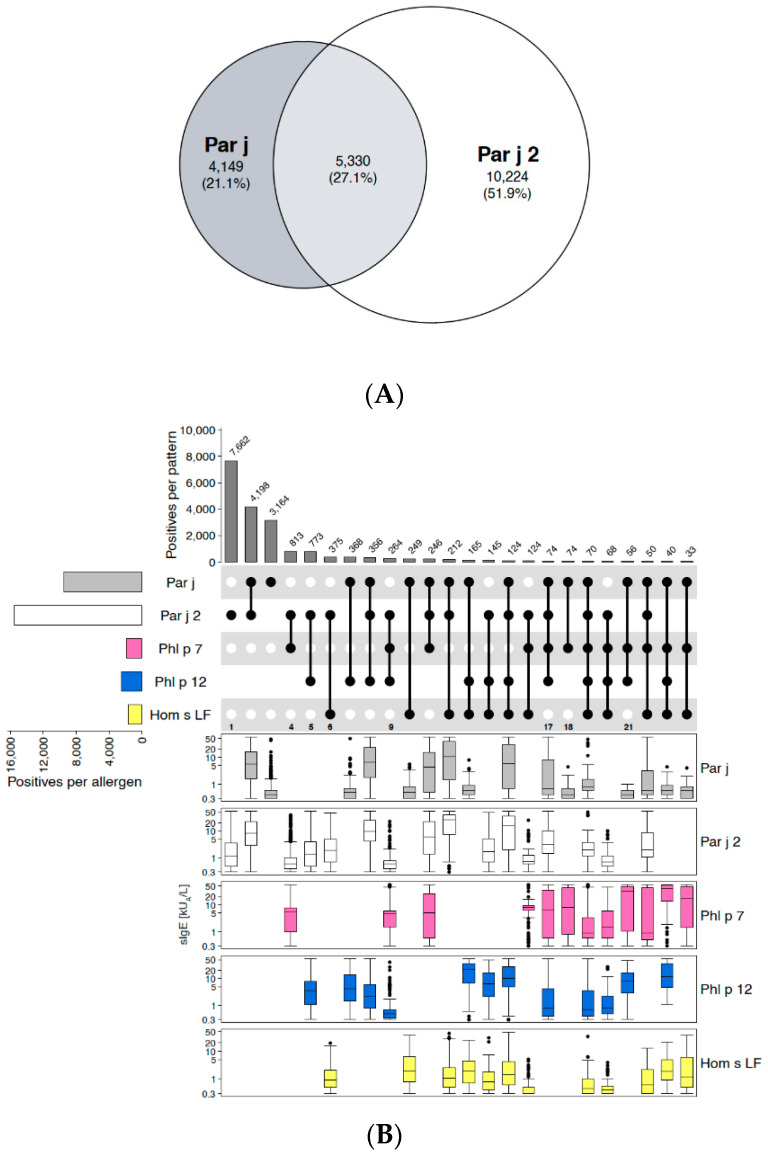
The ALEX2-test (MacroArray Diagnostics, Vienna, Austria) is a diagnostic multiplex IgE-test for the simultaneous detection of IgE to 178 allergens and 117 extracts, in addition to total IgE. Test results from more than 90 countries are stored on a GDPR-compliant cloud server for backup, customer support, and continuous postmarket surveillance. To improve the coverage of exposomes on a global scale and to further increase the sensitivity of the test, the allergen panel was updated from ALEX2 to ALEX3. By mid-2023, when ALEX3 was designed, almost 400,000 real-world ALEX2 test results were available. Analysing prevalences and average sIgE-levels of individual allergen preparations, coverage of extracts by components, and co-reactivity of members of the same allergen family provided a rationale for updating the array. In parallel, based on the scientific literature and clinical studies, new allergens were selected. On ALEX3, 218 allergens and 82 extracts will be represented, including 52 new allergens. Allergen preparations with low prevalence and clinical relevance, as well as redundant allergens and extracts, were discontinued. New allergens encompass, e.g., cyclophilins, alpha-gal, and additional markers from respiratory and food allergen sources. Using a large dataset of ALEX2 test results exemplifies the targeted, data-driven improvement of a diagnostic IgE-macroarray.

Keywords: ALEX; IgE-sensitisation; allergy; big-data; diagnosis; macroarray; microarray; molecular allergology; multiplex; test.


Conflict of interest statement

Peter Forstenlechner, Anna Ringauf, Raffaela Campana, Artan Salihu, Martina Aumayr, Irene Mittermann and Christian Lupinek are employees of MacroArray Diagnostics. The authors declare that this study received funding from MacroArray Diagnostics GmbH. The funder is the owner of the used data and of the described IgE-macroarray, i.e., ALEX. Purpose and methodology of the present study were as described in the present paper.

Figures

Figure 1
Figure 1
Spreading pellitory (Parietaria judaica). (A) Euler-plot of all samples positive to the extract (“Par j”) or to one of the main marker allergens from Parietaria judaica, Par j 2. Absolute numbers and percentages of cases are indicated for each respective segment. (B) Upset-plot (top), showing different reactivity patterns to Par j extract, Par j 2, and surrogate markers of the pan-allergen families of polcalcins (Phl p 7) and profilins (Phl p 12), as well as to a CCD-marker (Hom s LF). Numbers of cases for each individual allergen are indicated by bars on the left (“Positives per allergen”) and for each combination of IgE-reactivity by bars on top of the plot (“Positives per pattern”). The combination matrix illustrates patterns of reactivity: a single spot represents samples monoreactive to the respective allergen on the left, two spots that are connected by a vertical line show samples with IgE-reactivity to the two corresponding allergens on the left side, etc. To facilitate readability, every second line is shown in light grey; white dots display the absence of reactivity. At the bottom of the combination matrix, select columns mentioned in the text are indicated by numbers. Box-plots underneath each individual reactivity pattern show IgE-levels (kUA/L) to each of the abovementioned allergen-preparations (y-axes in log10 scale).
Figure 2
Figure 2
Ribwort plantain (Plantago lanceolata). (A) Euler-plot of all samples positive to the extract (“Pla l”) or to the main marker allergen from ribwort, Pla l 1. Absolute numbers and percentages of cases are indicated for each respective segment. (B) Upset-plot (top), showing different reactivity patterns to Pla l extract, Pla l 1, and surrogate markers of the pan-allergen families of polcalcins (Phl p 7) and profilins (Phl p 12), as well as to a CCD-marker (Hom s LF). Numbers of cases for each individual allergen are indicated by bars on the left (“Positives per allergen”) and for each combination of IgE-reactivity by bars on top of the plot (“Positives per pattern”). The combination matrix illustrates patterns of reactivity: a single spot represents samples monoreactive to the respective allergen on the left, two spots that are connected by a vertical line show samples with IgE-reactivity to the two corresponding allergens on the left side, etc. To facilitate readability, every second line is shown in light grey; white dots display absence of reactivity. Box-plots underneath each individual reactivity pattern show IgE-levels (kUA/L) to each of the abovementioned allergen-preparations (y-axes in log10 scale).
Figure 3
Figure 3
Storage protein families. Upset-plots (top), showing frequencies of reactivity patterns, and box-plots underneath each individual pattern showing IgE-levels (kUA/L, y-axes in log10 scale) to (A) 2S albumins, (B) 7S globulins and (C) 11S globulins on the ALEX2-test. Numbers of cases for each individual allergen are indicated by bars on the left (“Positives per allergen”) and for each combination of IgE-reactivity by bars on top of the Upset-plot (“Positives per pattern”). The combination matrix illustrates patterns of reactivity: a single dark (i.e., black or dark grey) dot represents samples monoreactive to the respective allergen on the left, two dark dots that are connected by a vertical line show samples with IgE-reactivity to the two corresponding allergens on the left side, etc. To facilitate readability, every second line is shown in light grey; white dots display absence of reactivity. Groups of reactivities to the same number of allergens are sorted from left (highest number of co-reactivities) to right (monoreactivities), each group either displayed by black or grey bars and dots, to facilitate identification of groups.
Figure 3
Figure 3
Storage protein families. Upset-plots (top), showing frequencies of reactivity patterns, and box-plots underneath each individual pattern showing IgE-levels (kUA/L, y-axes in log10 scale) to (A) 2S albumins, (B) 7S globulins and (C) 11S globulins on the ALEX2-test. Numbers of cases for each individual allergen are indicated by bars on the left (“Positives per allergen”) and for each combination of IgE-reactivity by bars on top of the Upset-plot (“Positives per pattern”). The combination matrix illustrates patterns of reactivity: a single dark (i.e., black or dark grey) dot represents samples monoreactive to the respective allergen on the left, two dark dots that are connected by a vertical line show samples with IgE-reactivity to the two corresponding allergens on the left side, etc. To facilitate readability, every second line is shown in light grey; white dots display absence of reactivity. Groups of reactivities to the same number of allergens are sorted from left (highest number of co-reactivities) to right (monoreactivities), each group either displayed by black or grey bars and dots, to facilitate identification of groups.
Figure 4
Figure 4
PR-10 allergens. Upset-plot (top), showing frequencies of reactivity patterns, and box-plots underneath each individual pattern showing IgE-levels (kUA/L, y-axes in log10 scale) to PR-10 allergens on the ALEX2-test. Numbers of cases for each individual allergen are indicated by bars on the left (“Positives per allergen”), and for each combination of IgE-reactivity by bars on top of the Upset-plot (“Positives per pattern”). The combination matrix illustrates patterns of reactivity: a single dark (i.e., black or dark grey) dot represents samples monoreactive to the respective allergen on the left, two dark dots that are connected by a vertical line show samples with IgE-reactivity to the two corresponding allergens on the left side, etc. To facilitate readability, every second line is shown in light grey; white dots display absence of reactivity. Groups of reactivities to the same number of allergens are sorted from left (highest number of co-reactivities) to right (monoreactivities), each group either displayed by black or grey bars and dots, to facilitate identification of groups.
Figure 5
Figure 5
Ole e 1-like proteins. (A) Euler-plot of all samples positive to at least one of the Ole e 1-like allergens on ALEX2. Absolute numbers of cases are indicated for each respective segment. (B) Upset-plot (top), showing frequencies for different reactivity patterns to Ole e 1-like allergens. Numbers of cases for each individual allergen are indicated by bars on the left (“Positives per allergen”), and for each combination of IgE-reactivity by bars on top of the plot (“Positives per pattern”). Box-plots underneath each individual reactivity pattern show IgE-levels (kUA/L) to each of the abovementioned allergen preparations (y-axes in log10 scale). The combination matrix illustrates patterns of reactivity: a single dark (i.e., black or dark grey) dot represents samples monoreactive to the respective allergen on the left, two dark dots that are connected by a vertical line show samples with IgE-reactivity to the two corresponding allergens on the left side, etc. To facilitate readability, every second line is shown in light grey; white dots display absence of reactivity. Groups of reactivities to the same number of allergens are sorted from left (highest number of co-reactivities) to right (monoreactivities), each group either displayed by black or grey bars and dots, to facilitate identification of groups.
Figure 6
Figure 6
Profilins. Upset-plot (top), showing frequencies of reactivity patterns, and box-plots underneath each individual pattern showing IgE-levels (kUA/L, y-axes in log10 scale) to profilins on the ALEX2-test. Numbers of cases for each individual allergen are indicated by bars on the left (“Positives per allergen”), and for each combination of IgE-reactivity by bars on top of the Upset-plot (“Positives per pattern”). The combination matrix illustrates patterns of reactivity: a single dark (i.e., black or dark grey) dot represents samples monoreactive to the respective allergen on the left, two dark dots that are connected by a vertical line show samples with IgE-reactivity to the two corresponding allergens on the left side, etc. To facilitate readability, every second line is shown in light grey; white dots display absence of reactivity. Groups of reactivities to the same number of allergens are sorted from left (highest number of co-reactivities) to right (monoreactivities), each group either displayed by black or grey bars and dots, to facilitate identification of groups.
Figure 7
Figure 7
Grasses. (AD) Euler-plots showing co-reactivity between (A) Phl p 1, Cyn d 1 and Bahia grass extract (Pas n), (B) Bahia grass extract and pan-allergens or CCDs, (C) Phl p 1 and Lol p 1, (D1) Bermuda grass extract (Cyn d) and Cyn d 1, and between (D2) Bermuda grass extract and pan-allergens (profilin, polcalcin) or CCDs. (E) Combined Upset-plot and box-plot, showing frequencies of positive ALEX2 test results for Phl p 1, Cyn d 1 and Pas n-extract (“Positives per allergen”) and of all patterns of co-reactivity thereof (“Positives per pattern”, upper part), and corresponding sIgE-levels (kUA/L, y-axes in log10 scale) for each individual pattern and component (bottom part). The combination matrix illustrates patterns of reactivity: a single dark (i.e., black or dark grey) dot represents samples monoreactive to the respective allergen on the left, two dark dots that are connected by a vertical line show samples with IgE-reactivity to the two corresponding allergens on the left side, etc. To facilitate readability, every second line is shown in light grey; white dots display absence of reactivity. Groups of reactivities to the same number of allergens are sorted from left (highest number of co-reactivities) to right (monoreactivities), each group either displayed by black or grey bars and dots, to facilitate identification of groups.

Similar articles

Cited by

References

    1. Ansotegui I.J., Melioli G., Canonica G.W., Caraballo L., Villa E., Ebisawa M., Passalacqua G., Savi E., Ebo D., Gomez R.M., et al. IgE allergy diagnostics and other relevant tests in allergy, a World Allergy Organization position paper. World Allergy Organ. J. 2020;13:100080. doi: 10.1016/j.waojou.2019.100080. - DOI - PMC - PubMed
    1. Curin M., Reininger R., Swoboda I., Focke M., Valenta R., Spitzauer S. Skin prick test extracts for dog allergy diagnosis show considerable variations regarding the content of major and minor dog allergens. Int. Arch. Allergy Immunol. 2011;154:258–263. - PubMed
    1. Casset A., Mari A., Purohit A., Resch Y., Weghofer M., Ferrara R., Thomas W.R., Alessandri C., Chen K.W., de Blay F., et al. Varying allergen composition and content affects the in vivo allergenic activity of commercial Dermatophagoides pteronyssinus extracts. Int. Arch. Allergy Immunol. 2012;159:253–262. doi: 10.1159/000337654. - DOI - PMC - PubMed
    1. Focke M., Marth K., Valenta R. Molecular composition and biological activity of commercial birch pollen allergen extracts. Eur. J. Clin. Investig. 2009;39:429–436. doi: 10.1111/j.1365-2362.2009.02109.x. - DOI - PubMed
    1. Glesner J., Filep S., Vailes L.D., Wunschmann S., Chapman M.D., Birrueta G., Frazier A., Jeong K.Y., Schal C., Bacharier L., et al. Allergen content in German cockroach extracts and sensitization profiles to a new expanded set of cockroach allergens determine in vitro extract potency for IgE reactivity. J. Allergy Clin. Immunol. 2019;143:1474–1481 e1478. - PMC - PubMed

LinkOut - more resources