. 2025 May 2;26(9):4343.
doi: 10.3390/ijms26094343.

In Situ synNotch-Programmed Astrocytes Sense and Attenuate Neuronal Apoptosis

Affiliations

In Situ synNotch-Programmed Astrocytes Sense and Attenuate Neuronal Apoptosis

Shi-Yu Liang et al. Int J Mol Sci. .

Abstract

Neuronal apoptosis is an early and critical pathological hallmark of many chronic neurodegenerative diseases, often occurring silently long before the appearance of overt clinical symptoms. In this study, we engineered astrocytes utilizing a dual-biomarker recognition synNotch system (dual-synNotch). This system is designed to specifically identify neuronal apoptosis through the 'AND Gate' activation mechanism, which is triggered by the simultaneous sensing of the apoptotic signal phosphatidylserine (PS) and the neuronal signal ganglioside Gt1b. Upon detection of these neuronal apoptotic signals, the synNotch receptors are activated, inducing the expression of two key molecules: secreted Gaussia luciferase (GLuc), a highly detectable reporter that can cross the blood-brain barrier (BBB), and brain-derived neurotrophic factor (BDNF), a neuroprotective molecule that promotes neuronal survival by inhibiting apoptosis and enhancing memory and cognitive function. This engineered system effectively converts and amplifies early, imperceptible neuronal apoptotic signals into detectable outputs, enabling convenient in vitro monitoring and diagnosis. Therefore, it represents a promising strategy for the early detection and intervention of neurodegenerative diseases associated with neuronal apoptosis.

Keywords: brain-derived neurotrophic factor (BDNF); gaussia luciferase (GLuc); neuronal apoptosis; phosphatidylserine (PS); reprogrammed astrocyte; synNotch receptor.


Conflict of interest statement

The authors declare no conflicts of interest.

Figures

Figure 1
Figure 1
Schematic representation of the dual-synNotch system for sensing neuronal apoptosis. Astrocytes are genetically programmed to express two synNotch receptors on their surface, which specifically recognize the apoptosis marker PS and the neuronal marker ganglioside Gt1b. Upon activation, the synNotch receptor that binds to PS releases TetR-VP64 (tTA) into the nucleus, thereby initiating transcription of Gal4-DBD and EGFP. When activated by binding with Gt1b, the second synNotch receptor releases VP64-AD into the nucleus. VP64-AD then interacts with Gal4-DBD through complementary leucine zipper sequences to form a complete transcription factor, which subsequently initiates the transcription and expression of GLuc-IgG1 Fc and BDNF-Flag.
Figure 2
Figure 2
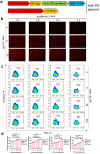
The effect of PS density and synNotch receptor density on activation. (a) Schematic illustration of the synNotch system for detecting PS. One plasmid encodes the gene sequences for the Annexin A5-synNotch receptor, which specifically recognizes the apoptotic signal PS. Additionally, it includes an inducible downstream protein reporter, mCherry, that is activated by the TetO promoter upon synNotch activation and subsequent release of TetR-VP64. (b) Representative images demonstrating synNotch activation in a COS7 cell model. COS7 cells were transiently transfected with varying amounts of plasmids as described in (a) and activated in the presence of 0, 5, and 50 µg PS per well. The activation of this system was visualized using mCherry fluorescence. Scale bar, 100 μm. (c) The ratio of COS7 cells expressing mCherry to the total number of COS7 cells exhibiting synNotch receptor expression was analyzed via flow cytometry. Colors represent cell density. (d) Ratios of mCherry-expressing COS7 cells in total synNotch-expressing COS7 cells cultured under different coating densities of PS and transfected with varying amounts of plasmids (n = 3 represents three independent experiments). The statistical points of each group were fitted by a dotted straight line. All data are shown as mean ± s.e.m. and were analyzed via one-way ANOVA with Tukey’s test (ns > 0.05; * p < 0.05; ** p < 0.01; *** p < 0.001; **** p < 0.0001).
Figure 3
Figure 3
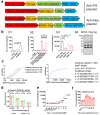
Detection of produced BDNF-Flag and Gluc-IgG1 Fc protein. (a) Schematic representation of the dual-synNotch system for detecting neuronal apoptosis. (b) Selection of BDNF types for expression. (b1) Comparison of the expression levels of BDNF precursor (proBDNF) and mature BDNF. (b2) Comparison of the expression levels of proBDNF with original signal peptide (sp), CD33 sp, and Ig κ leader sp. (b3) Comparison of the expression levels of proBDNF with different protein tags including Flag, Myc, HA, and His. (b4) The BDNF-Flag expressed by astrocytes in supernatant was detected by Western blotting using anti-Flag tag antibodies (n = 3 represents three independent experiments). (c) The standard ELISA curve of BDNF-Flag determined with various concentrations of BDNF-Flag under different dilution of detection antibody (left); curve fitting under 1:500 dilution of detection antibody through the MMF four-parameter fitting mode (right) (n = 3 represents three independent experiments). (d) The beneficial effect of BDNF-Flag on neurons. BDNF-Flag or wild-type BDNF protein were added to the 10 mM glutamic-acid-induced neuron apoptosis model, and the survival rate of neurons was detected by an MTT assay (n = 3 represents three independent experiments). (e) Standard curves for detection of GLuc-IgG1 Fc protein by measuring bioluminescence under different concentrations of GLuc-IgG1 Fc protein with the addition of coelenterazine (n = 3 represents three independent experiments). (f) Detection of GLuc-IgG1 Fc crossing the blood–brain barrier. The purified 1 μg GLuc-IgG1 Fc protein was injected into the unilateral lateral ventricle of the mouse brain, and the mouse serum was assayed at the indicated time points by measuring bioluminescence with the addition of coelenterazine (n = 7 represents seven independent experiments). All data are shown as mean ± s.e.m. and were analyzed via one-way ANOVA with Tukey’s test (ns > 0.05; * p < 0.05; ** p < 0.01;*** p < 0.001; **** p < 0.0001).
Figure 4
Figure 4
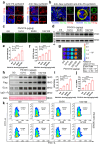
The expression of dual-synNotch receptors and biomarker production in HEK-293T cells. (a) Representative images illustrating the anti-PS synNotch receptor (left) and the anti-Neu synNotch receptor (right) expressed on the surface of HEK-293T cells. Scale bar, 25 μm, 5 μm in enlarged pictures. (b) Representative images showing the simultaneous expression of the anti-PS synNotch receptor (red) and the anti-Neu synNotch receptor (green) on the surface of HEK-293T cells. Scale bar, 25 μm, 5 μm in enlarged pictures. (c) Representative images showing the expression of reporter EGFP in HEK-293T cells expressing two receptors when the cells were simultaneously stimulated by different amounts of PS and ganglioside Gt1b for 24 h. Scale bar, 200 μm. (d) Western blotting analysis of EGFP in the cell lysate of HEK-293T stimulated with different amounts of PS and ganglioside Gt1b. (e,f) The mean fluorescence intensity (MFI) of EGFP (n = 3 represents three independent experiments) in (c) and the statistics of gray values of EGFP protein bands in (d) (n = 3 represents three independent experiments) were analyzed. (g) Bioluminescence image of the supernatants of the cell culture stimulated by different amounts of PS and ganglioside Gt1b following the addition of coelenterazine. (h) Western blotting analysis of BDNF-Flag and GLuc-IgG1 Fc in the supernatants of cell cultures stimulated with different amounts of PS and ganglioside Gt1b. (i) The statistics of gray values of BDNF-Flag protein bands were analyzed (n = 3 represents three independent experiments). (j) The statistics of gray values of GLuc-IgG1 Fc protein bands were analyzed (n = 3 represents three independent experiments). (k) Activated HEK-293T cells expressing EGFP in the presence of different amounts of PS and Gt1b analyzed by flow cytometry. Colors represent cell density. All data above are shown as mean ± s.e.m. and were analyzed via one-way ANOVA with Tukey’s test (ns > 0.05; ** p < 0.01; *** p < 0.001; **** p < 0.0001).
Figure 5
Figure 5
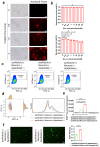
Activation specificity of synNotch system and construction of neuronal apoptosis model. (a) Representative images of primary neurons treated with 5 mM glutamic acid for different amounts of time and PS on neurons detected using an Annexin5-mCherry probe. Scale bar, 100 μm. (b) The apoptosis rates of neurons and astrocytes induced by different concentrations of glutamic acid were detected by TUNEL and Hochest costaining 6 h after glutamic acid addition and analyzed via one-way ANOVA with Tukey’s test (n = 5 represents five independent experiments). (c) Flow cytometry analysis of the total HEK-293T cells expressing synNotch receptors marked by mCherry. Colors represent cell density. (d) Flow cytometry analysis of the reporter EGFP in the dual-synNotch system expressed by HEK-293T cells, which were either activated by apoptotic neurons or not, for 24 h. (e) The concentration of BDNF-Flag in the supernatant of (d) was measured by ELISA and analyzed via one-way ANOVA with Tukey’s test (n = 3 represents three independent experiments). (f) Representative images of HEK-293T cells with reporter EGFP. The MFI of the reporter EGFP were counted and analyzed via a nonparametric unpaired t test with a two-tailed p value (n = 3 represents three independent experiments). Scale bar, 100 μm. All data above are shown as mean ± s.e.m. (ns > 0.05; * p < 0.05; ** p < 0.01; *** p < 0.001; **** p < 0.0001).
Figure 6
Figure 6
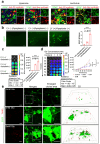
The activation of dual-synNotch receptors and biomarker production by primary astrocytes (a) Representative images of the two receptors expressed on primary astrocytes transfected by liposome and lentivirus. Scale bar, 50 μm. (b) Representative images of reporter EGFP in primary astrocytes. The primary astrocytes were transfected with double LVs (MOI = 1) and cocultured with neurons which were induced apoptosis by 5 mM L-glutamic acid for 48 h. Scale bar, 200 μm. The relative MFI of EGFP was analyzed via one-way ANOVA with Tukey’s test (n = 3 represents three independent experiments). (c) Bioluminescent imaging; The bioluminescent intensity of GLuc-IgG1 Fc in cell culture supernatants was measured in (b) (n = 4 represents four independent experiments) and analyzed via one-way ANOVA with Tukey’s test. (d) Bioluminescent imaging; The bioluminescent intensity of GLuc-IgG1 Fc in cell culture supernatants were measured at various time points after the induction of neuronal apoptosis in the presence of glutamic acid (n = 3 represents three independent experiments); the data were analyzed via two-way ANOVA with Tukey’s test. (e) Representative images of reporter EGFP in astrocytes and the TUNEL staining of neurons induced by 0, 1 and 5 mM glutamic acid for 48 h. Scale bar, 50 μm. All the above data are shown as mean ± s.e.m. (ns > 0.05; * p < 0.05; *** p < 0.001; **** p < 0.0001).
Figure 7
Figure 7
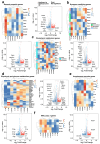
Transcriptome of neural support function, normal physiological metabolism, and immune response of reprogrammed primary astrocytes. (a) Cluster heatmap and volcano plot of general-property-related genes of astrocytes (n = 4 represents four independent experiments). (b) Cluster heatmap and volcano plot of synapse-modification-related genes of astrocytes (n = 4 represents four independent experiments). (c) Cluster heatmap and volcano plot of cholesterol-metabolism-related genes of astrocytes (n = 4 independent samples). (d) Cluster heatmap and volcano plot of glycolysis- and glucose-metabolism-related genes of astrocytes (n = 4 represents four independent experiments). (e) Cluster heatmap and volcano plot of complement-cascade-pathway-related genes of astrocytes (n = 4 represents four independent experiments). (f) Cluster heatmap and volcano plot of MHC-I-type-related genes of astrocytes (n = 4 represents four independent experiments). The grey vertical dotted line represents |log2 FoldChange|=1, and the grey horizontal line represents that p-value=0.05.

References

    1. Walker L., McAleese K.E., Erskine D., Attems J. Neurodegenerative Diseases and Ageing. Subcell. Biochem. 2019;91:75–106. doi: 10.1007/978-981-13-3681-2_4. - DOI - PubMed
    1. Scheltens P., De Strooper B., Kivipelto M., Holstege H., Chetelat G., Teunissen C.E., Cummings J., van der Flier W.M. Alzheimer’s disease. Lancet. 2021;397:1577–1590. doi: 10.1016/S0140-6736(20)32205-4. - DOI - PMC - PubMed
    1. Kalia L.V., Lang A.E. Parkinson’s disease. Lancet. 2015;386:896–912. doi: 10.1016/S0140-6736(14)61393-3. - DOI - PubMed
    1. Andreone B.J., Larhammar M., Lewcock J.W. Cell Death and Neurodegeneration. Cold Spring Harb. Perspect. Biol. 2020;12:a036434. doi: 10.1101/cshperspect.a036434. - DOI - PMC - PubMed
    1. Fricker M., Tolkovsky A.M., Borutaite V., Coleman M., Brown G.C. Neuronal Cell Death. Physiol. Rev. 2018;98:813–880. doi: 10.1152/physrev.00011.2017. - DOI - PMC - PubMed

LinkOut - more resources