. 2025 Apr 30;14(9):1364.
doi: 10.3390/plants14091364.

Assessing Functional Conservation Amongst FT- and TFL1-like Genes in Globe Artichoke

Affiliations

Assessing Functional Conservation Amongst FT- and TFL1-like Genes in Globe Artichoke

Rick Berentsen et al. Plants (Basel). .

Abstract

Globe artichoke [Cynara cardunculus var. scolymus (L.)] is a perennial composite cultivated for its immature inflorescences. Over time, the market for growers has steadily shifted away from vegetatively propagated varieties and towards seed-propagated hybrids. Since the latter tend to produce relatively late in the season, advancing the moment of flowering remains a major objective for breeders, who can benefit from insight gained into the genetic architecture of this trait. In plants, the timing of flowering is strongly regulated at the genetic level to ensure reproductive success. Genetic studies in model and non-model species have identified gene families playing crucial roles in flowering time control. One of these is the phosphatidylethanolamine-binding protein (PEBP) family, a conserved group of genes that, in plants, not only regulate the vegetative-to-reproductive phase transition, but also the development of inflorescences. In this work, we identified seven PEBP family members in the globe artichoke genome, belonging to three major clades: MOTHER OF FT AND TFL1 (MFT)-like, TERMINAL FLOWER 1 (TFL1)-like, and FLOWERING LOCUS T (FT)-like. Our results further show that CcFT expression is upregulated after the floral transition and partially complements the ft-10 mutant, whilst CcTFL1 is expressed in the shoot apex and developing inflorescences and complements the tfl1-1 mutant. These results suggest that the flowering-suppressing function of CcTFL1 is conserved in globe artichoke whereas conservation of the floral promoting function of CcFT remains uncertain.

Keywords: FT; PEBP family; TFL1; bolting time; flowering; globe artichoke.


Conflict of interest statement

Authors Rick Berentsen and Peter Visser were employed by the company BASF’s vegetable seeds business. The remaining authors declare that the research was conducted in the absence of any commercial or financial relationships that could be construed as a potential conflict of interest.

Figures

Figure 1
Figure 1
ML phylogram of PEBP genes in plants. Colors accentuate major PEBP clades, with MFT-likes subdivided into MFT1-likes and MFT2-likes for clarity. Gray entry is the outgroup used to root the tree. PEBP members from globe artichoke in bold and marked with a star. Node labels denote 1000-bootstrap values.
Figure 2
Figure 2
Results from MeMe motif search in PEBPs from different plant species. MeMe motif plot. Genes from C. cardunculus in bold. Species: Aa = Artemisia annua, Ac = Actinidia chinensis, Al = Arctium lappa, Am = Antirrhinum majus, At = Arabidopsis thaliana, Bv = Beta vulgaris, Cc = Cynara cardunculus, Cc = Citrus clementina, Cl = Citrus limon, Cs = Chrysanthemum seticuspe, Ec = Erigeron canadensis, Gr = Gossypium raimondii, Ha = Helianthus annuus, Jc = Jatropha curcas, Ls = Lactuca sativa, Mp = Marchantia polymorpha, Nt = Nicotiana tabacum, Os = Oryza sativa, Pa = Picea abies, Pp = Physcomitrium patens, Ps = Pisum sativum, Pt = Populus trichocarpa, Pv = Phaseolus vulgaris, Rc = Ricinus communis, Sl = Solanum lycopersicum, Sm = Selaginella moellendorffii, Vv = Vitis vinifera.
Figure 3
Figure 3
Alignment and models of FT-like proteins. (A) Protein sequence alignment of 11 selected FT-like proteins. Blue arrows = globe artichoke CcFT Tyr84 and Gln139, respectively; yellow arrow = first amino acid of LYN triad; red frame = the B-loop and LYN triad, respectively; blue boxes under the alignment = exon4 segments. (B) Protein sequence alignment for TFL1-likes. Blue arrows denote His88 and Asp144 residues.
Figure 4
Figure 4
Relative gene expression of globe artichoke PEBP genes. Horizontal axis = tissue, “SAM pb-x” = shoot apex in pre-bolting stage x, “leaf pb-x” = youngest mature leaf from a plant in pre-bolting stage x, “infl.” = inflorescence. CcCENa and CcBFTa are shown both on their original scale as well as zoomed in to reveal the remainder tissues with lower relative expression values. Tissues are grouped in accordance with the legend. Error bars denote standard deviations over two biological replicates with three technical replications each. The scale of Y-axes is different between genes.
Figure 5
Figure 5
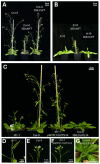
Phenotypes of CcFT and CcTFL1 expressed in Col, ft-10, and tlf1-1 mutants. (A) Overexpression of CcFT and AtFT in ft-10 background (30 days after sowing (das)). (B) Overexpression of CcFT and AtFT in Col-0 background (30 das). (C) Gross aspect of CcTFL1 expressed in tfl1-1 mutant and Col-0 under both the native TFL1 promoter and a 35S overexpression promoter (30 das). (D) Close-up of tfl1-1 inflorescence (30 das). (E) Close-up of Col-0 inflorescence (30 das). (F) Close-up of pAtTFL1:CcTFL1A tfl1-1 (30 das). (G) Close-up of center of rosette of 35S:CcTFL1A Col-0 (30 das).
Figure 6
Figure 6
Observations of phenotypic effects of overexpression of CcFT in Col-0 and ft-10 mutant. Top row: effects of overexpression of CcFT and AtFT in the wild type Col-0 background. Bottom row: effects of overexpression of CcFT and AtFT in the ft-10 mutant background. Phenotypes: “dtb” = days to bolting, “nr_leaf” = maximal number of rosette leaves before bolting, “nr_caul” = number of cauline leaves on the inflorescence, “nr_leaf_total” = total number of leaves. Boxplots inside the violin plots: lines = highest/lowest 1.5× interquartile range, red boxes = lower/upper quartiles, middle line = median. Compact letter displays summarize results of pairwise comparisons between genotypes.
Figure 7
Figure 7
Observations of phenotypic effects of overexpression of CcTFL1 in Col-0 and tfl1-1 mutant. Top row. Effects from overexpression of CcTFL1 in the Col-0 background. Bottom row. Effects from overexpression of CcTFL1 in the mutant tlf1-1 background. Phenotypes: “dtb” = days to bolting, “nr_leaf” = maximal number of rosette leaves before bolting, “nr_caul” = number of cauline leaves on the inflorescence, “nr_leaf_total” = total number of leaves. Boxplots inside the violin plots: lines = highest/lowest 1.5× interquartile range, blue boxes = lower/upper quartiles, middle line = median. Compact letter displays summarize results of pairwise comparisons between genotypes.
Figure 8
Figure 8
Observations of expression of CcTFL1 under the Arabidopsis native AtTFL1 promoter in tfl1-1 mutant background. Phenotypes: “dtb” = days to bolting, “nr_leaf” = maximal number of rosette leaves before bolting, “nr_caul” = number of cauline leaves on the inflorescence, “nr_leaf_total” = total number of leaves. Compact letter displays summarize results of pairwise comparisons between genotypes.

References

    1. Scaglione D., Reyes-Chin-Wo S., Acquadro A., Froenicke L., Portis E., Beitel C., Tirone M., Mauro R., Lo Monaco A., Mauromicale G., et al. The genome sequence of the outbreeding globe artichokes constructed de novo incorporating a phase-aware low-pass sequencing strategy of F1 progeny. Sci. Rep. 2016;6:19427. doi: 10.1038/srep19427. - DOI - PMC - PubMed
    1. FAOSTAT FAOSTAT. Food and Agriculture Organization of the United Nations on 2022-01-28.2022. [(accessed on 9 March 2022)]. Available online: https://www.fao.org/faostat/
    1. Pignone D., Sonnante G. Wild artichokes of south Italy: Did the story begin here? Genet. Resour. Crop. Evol. 2004;51:577–580. doi: 10.1023/B:GRES.0000024786.01004.71. - DOI
    1. Sonnante G., Pignone D., Hammer K. The domestication of artichoke and cardoon: From Roman times to the genomic age. Ann. Bot. 2007;100:1095–1100. doi: 10.1093/aob/mcm127. - DOI - PMC - PubMed
    1. Elia A., Miccolis V. Relationships among 104 artichoke (Cynara scolymus L.) accessions using cluster analysis. Adv. Hortic. Sci. 1996;10:158–162.