. 2025 Aug;24(8):e70094.
doi: 10.1111/acel.70094. Epub 2025 May 13.

Human and Mouse Alzheimer's Seeds Differentially Affect Amyloid Deposition and Microglia-Dependent Plaque Response in Aged Mice

Affiliations

Human and Mouse Alzheimer's Seeds Differentially Affect Amyloid Deposition and Microglia-Dependent Plaque Response in Aged Mice

Juana Andreo-Lopez et al. Aging Cell. 2025 Aug.

Abstract

Alzheimer's disease (AD) is a complex neurodegenerative proteinopathy in which Aβ and tau misfold and aggregate into entities that structurally unsettle native proteins, mimicking a prion-like or "seeding" process. These Aβ and tau "seeds" can arrange in different conformations or strains that might display distinct pathogenic properties. Furthermore, recent evidence suggests that microglia play a key role in the amyloidogenic event and can modulate the propagation and aggregation processes. Here, we employed histological and molecular approaches to determine whether seeds from human AD brains compared to those from transgenic mice (3xTg-AD) are more prone to induce Aβ and tau aggregates in vivo, as well as potential differences in the microglial response to the plaque pathology. Brain homogenates were injected into the hippocampus of 3xTg-AD mice and hAβ-KI mice and examined at 18-20 months of age. The seeds from the human AD brain induced more aggressive amyloid pathology compared to seeds from aged 3xTg-AD mice. However, the AD seeds from aged transgenic mice triggered more tau pathology. Interestingly, such mice seeds impaired microglial clustering around plaques, leading to more severe neuritic pathology. Furthermore, the human AD seeds injected into the hippocampus of hAβ-KI mice were not able to induce plaque formation. These results suggest that multiple variables such as the AD seed, recipient model, and time are critical factors that can modulate the amyloid pathology onset and progression. Thus, more profound understanding of these factors will provide key insight into how amyloid and tau pathology progresses in AD.

Keywords: Alzheimer's disease; amyloid‐beta; inflammation; propagation; seeds; tau; transgenic mice.


Conflict of interest statement

The authors declare no conflicts of interest.

Figures

FIGURE 1
FIGURE 1
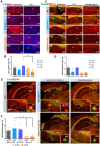
Human and transgenic mice AD seeds differentially accelerate amyloid pathology in 3xTg‐AD. (A) Brain homogenates from an AD patient and an old 3xTg‐AD mice (25 months) were inoculated into the hippocampus of 7–8‐month‐old female 3xTg‐AD mice, followed by a 10‐month incubation period. (B) Stereotaxic injections were performed into the right hemisphere of the hippocampus (AP −1.8 mm, ML −1.8 mm, DV −1.8 mm), represented by a blue needle outline. Exactly 2.5 μL of inoculum were deposited in each mouse brain, whether it was PBS, old‐Tg mice or AD patient's homogenate. (C) Hippocampal microscopic images immunolabeled for 6E10 in 3xTg‐AD mice treated with PBS (C1, C1a) and with brain homogenates from AD patient in the contralateral (C2, C2a) and ipsilateral (C3, C3a) sides, and with brain samples from old 3xTg‐AD mice in the contralateral (C4, C4a) and ipsilateral (C5, C5a) sides. (D) Quantification of Aβ load with 6E10 in the ipsilateral and contralateral side of the 3xTg‐AD treated with human brain homogenates compared with old‐Tg mice seeds and PBS. (E) Hippocampal microscopic images stained with OC in 3xTg‐AD mice treated with PBS (E1, E1a) brain homogenates from AD patient in the contralateral (E2, E2a) and ipsilateral (E3, E3a) sides, and with brain samples from old 3xTg‐AD mice in the contralateral (E4, E4a) and ipsilateral (E5, E5a) sides. (F) Quantification of the OC burden of brain slices in the ipsilateral and contralateral side of the 3xTg‐AD treated with PBS, human brain homogenates and old‐Tg mice seeds. (G) Activity ratio graph of the ipsilateral side of 3xTg‐AD mice treated with human AD brain homogenate compared to old‐Tg mice samples. (H) Activity ratio graph of the ipsilateral side of 3xTg‐AD mice treated with human AD brain homogenate compared to old‐AD mice samples. C, contralateral; DG, dentate gyrus; H, human; I, ipsilateral; M, mouse; so, Stratum oriens; sp., Stratum piramidale; sr, Stratum radiatum. The values represent means ± SEM. N = 5–6 per group. Scale bar: 200 μm (C1–C5 and E1–E5) and 100 μm (C1a–C5a and E1a–E5a).
FIGURE 2
FIGURE 2
Human and transgenic mice AD seeds differentially accelerate tau pathology in 3xTg‐AD mice. (A) Hippocampal microscopic images immunolabeled for tau using the AT8 antibody in 3xTg‐AD mice treated in the ipsilateral side with PBS (A1, A1a), brain homogenates from an AD patient (A2, A2a), and with brain samples from an old 3xTg‐AD mice (A3, A3a). (B) AT8 positive area quantification in the ipsilateral side of the 3xTg‐AD treated with PBS, old‐Tg mice, and human brain homogenates. (C) Hippocampal microscopic images immunolabeled for hyperphosphorylated tau using the PHF1 antibody in 3xTg‐AD mice treated in the ipsilateral side with PBS (C1, C1a), brain homogenates from an AD patient (C2, C2a), and with brain samples from an old 3xTg‐AD mice (C3, C3a). (D) Quantification of the PHF1 positive area in the ipsilateral side of the 3xTg‐AD treated with PBS, old‐Tg mice, and human brain homogenates. (E) Hippocampal microscopic images immunolabeled for conformational hyperphosphorylated tau using the MC1 antibody in 3xTg‐AD mice treated in the ipsilateral side with PBS (E1, E1a), brain homogenates from an AD patient (E2, E2a), and with brain samples from an old 3xTg‐AD mice (E3, E3a). (F) Quantification of the MC1 positive area in the ipsilateral side of the 3xTg‐AD treated with PBS, old‐Tg mice, and human brain homogenates. (G–I) Activity ratio graphs corresponding to the ipsilateral side of 3xTg‐AD mice treated with human AD brain homogenate compared to old‐AD mice samples, according to the induced pathology immunolabeled with AT8 (G), PHF1 (H), and MC1 (I). The values represent means ± SEM. N = 5–6 per group. C, contralateral; H, human; I, ipsilateral; M, mouse; so, Stratum oriens; sp., Stratum piramidale; sr, Stratum radiatum. Scale bar: 100 μm (A1–A3, C1–C3, E1–E3) and 20 μm (A1a–A3a, C1a–C3a, E1a–E3a).
FIGURE 3
FIGURE 3
Human and transgenic mice seeds differentially affect the formation of plaque‐associated microglia in 3xTg‐AD mice. (A) Fluorescence microscopy images stained with X‐34 and Iba1 in the subiculum (A1, A3, A5, A7, and A9) and CA1 (A2, A4, A6, A8, and A10) hippocampal area. (B) Quantification of Iba1 positive area in 3xTg‐AD mice treated with PBS, human seeds, and old‐Tg seeds in both ipsilateral and contralateral side. (C) Fluorescence microscopy images stained with Thioflavin‐S and using the P2RY12 antibody in the subiculum (C1, C4, C7, C10, and C13), CA1 (C2, C5, C8, C11, and C14) and dentate gyrus (C3, C6, C9, C12, and C15). (D) Quantification of hippocampal P2RY12 positive area in 3xTg‐AD mice treated with PBS, human seeds, and old‐Tg seeds in both ipsilateral and contralateral sides. (E) Hippocampal fluorescence microscopy images stained with Thioflavin‐S and immunolabeled for CD45 in 3xTg‐AD mice treated with PBS (E1) and with brain homogenates from AD patient in the contralateral (E2) and ipsilateral (E3) side, and from old‐Tg mice in the contralateral (E4) and ipsilateral (E5) side. (F) Quantification of the CD45 load in PBS, human seeds treated mice and mice treated with the old‐Tg seeds in both ipsilateral and contralateral side. C, contralateral; H, human; I, ipsilateral; M, mouse; sp., Stratum piramidale; Sub, Subiculum. The values represent means ± SEM. N = 5–6 per group. Scale bar: 500 μm (E1–E5), 100 μm (E1a–E5a), 50 μm (A1–A10, C1–C15), 20 μm (E1b–E5b).
FIGURE 4
FIGURE 4
Iba‐1/TREM2 periplaque microglia were barely present in brain sections treated with old‐Tg sample. (A) Schematic representation of the regionalization of the plaque‐associated area for quantification. Three concentric circles were drawn outwards the outline of the plaque, with a radius of 10, 20, and 30 μm each. Then, microglia on plaque was assessed, as well as microglia at a distance of 10, 20, and 30 μm. (B) Fluorescence microscopy images stained with X‐34 and immunolabeled for Iba1 and TREM2 in 3xTg‐AD mice treated with PBS (B1) and with brain homogenates from AD patient (B2) and old‐Tg mice (B3) in the ipsilateral side. (C) Quantification of Iba1 load (c1), TREM2 load (c2), and TREM2/Iba1 ratio (c3). (D) Schematic timeline of the MTT assay. BV‐2 cells were seeded into a 96‐well plate and, after 3 h, brain extracts were added to the cells at a final concentration of 0.1 μg/μL. After incubation for 72 h, MTT was added to each well and further incubated for 4 h. Then, acid isopropanol was added and absorbance at 550 nm was measured. (E) BV‐2 cells treated with human, old‐Tg samples (0.1 μg/μL), and the control sample with no seeds. (F) BV‐2 cells treated with old‐Tg immunodepleted samples for Aβ, tau, and both Aβ and tau. H, human; I, ipsilateral; ID, immunodepleted; M, mouse. The values represent means ± SEM. N = 4–6 per group (C), N = 3–6 per group (E, F). Scale bar: 10 μm (B1–B3), 20 μm (B1a–B1c, B2a–B2c, B3a–B3c).
FIGURE 5
FIGURE 5
Increased dystrophic neurites pathology in 3xTg‐AD mice treated with seeds from old‐Tg mice. (A) Confocal images immunolabeled with APP and Iba1 microglia around X‐34‐positive amyloid aggregates in 3xTg‐AD treated with PBS (A1, A4, A7, A10), with brain homogenates from AD patient in the ipsilateral side (A2, A5, A8, A11) and treated with old‐Tg mice brain homogenates (A3, A6, A9, A12) in the ipsilateral side. (B) Quantification of APP positive dystrophic neurites divided by the plaque area in the hippocampus in 3xTg‐AD mice treated with PBS, human AD sample, and old‐Tg mice brain. (C) Confocal images of AT8 immunolabeled phospho‐tau along with Iba1 microglia and X‐34 positive amyloid plaques in the brains of the 3xTg‐AD mice treated with PBS (C1, C4, C7, C10), AD patient (C2, C5, C8, C11) and old‐Tg mice seeds (C3, C6, C9, C12) in the ipsilateral side. (D) Quantification of AT8 positive stain divided by the plaque area in the hippocampus of 3xTg‐AD mice treated with PBS, human AD sample, and old‐Tg mice seeds. H, human; I, ipsilateral, M, mouse. The values represent means ± SEM. N = 5–6 per group. Scale bar: 100 μm (A1–A12, C1–C12).
FIGURE 6
FIGURE 6
Human AD seeds do not accelerate amyloid pathology but stimulate the formation of PAS granules in hAβ‐KI mice. (A) Brain homogenates from AD patient were inoculated into the hippocampus of 7–8‐month‐old female hAβ‐KI mice, followed by a 10‐month incubation period. (B) Hippocampal microscopic images stained with 6E10 in hAβ‐KI mice treated with PBS (B1, B1a, B1b), with brain homogenates from AD patient in the contralateral (B2, B2a, B2b) and ipsilateral (B3, B3a, B3b) sides, showed no immunostaining with 6E10 antibody after 10 months of the injection. (C) Hippocampal microscopic images stained with PAS in hAβ‐KI mice treated with PBS (C1, C1a) and hAβ‐KI mice treated with brain homogenates from AD patient in the contralateral (C2, C2a) and ipsilateral (C3, C3a) side. (D–F) Quantification of the number of PAS clusters (D), total number of granules (E) and total area occupied of the granules (F) in the ipsilateral hAβ‐KI mice treated with human brain extract compared to hAβ‐KI mice treated with PBS. C, Contralateral; DG, Dentate gyrus; I, Ipsilateral; slu, Stratum lucidum; so, Stratum oriens; sp., Stratum piramidale; sr, Stratum radiatum. The values represent means ± SEM. N = 5 per group. Scale bar: 200 μm (B1–B3, C1–C3) and 100 μm (B1a–B3a, B1b–B3b, C1a–C3a, C1b–C3b).

References

    1. Asai, H. , Ikezu S., Tsunoda S., et al. 2015. “Depletion of Microglia and Inhibition of Exosome Synthesis Halt Tau Propagation.” Nature Neuroscience 18, no. 11: 1584–1593. 10.1038/nn.4132. - DOI - PMC - PubMed
    1. Auge, E. , Cabezon I., Pelegri C., and Vilaplana J.. 2017. “New Perspectives on Corpora Amylacea in the Human Brain.” Scientific Reports 7: 41807. 10.1038/srep41807. - DOI - PMC - PubMed
    1. Baglietto‐Vargas, D. , Forner S., Cai L., et al. 2021. “Generation of a Humanized Aβ Expressing Mouse Demonstrating Aspects of Alzheimer's Disease‐Like Pathology.” Nature Communications 12, no. 1: 2421. 10.1038/s41467-021-22624-z. - DOI - PMC - PubMed
    1. Baik, S. H. , Kang S., Son S. M., and Mook‐Jung I.. 2016. “Microglia Contributes to Plaque Growth by Cell Death due to Uptake of Amyloid Beta in the Brain of Alzheimer's Disease Mouse Model.” Glia 64, no. 12: 2274–2290. 10.1002/glia.23074. - DOI - PubMed
    1. Baker, H. F. , Ridley R. M., Duchen L. W., Crow T. J., and Bruton C. J.. 1993. “Evidence for the Experimental Transmission of Cerebral Beta‐Amyloidosis to Primates.” International Journal of Experimental Pathology 74, no. 5: 441–454. - PMC - PubMed

LinkOut - more resources