. 2025 Apr 29:16:1560778.
doi: 10.3389/fimmu.2025.1560778. eCollection 2025.

Characterizing spatial immune architecture in metastatic melanoma using high-dimensional multiplex imaging

Affiliations

Characterizing spatial immune architecture in metastatic melanoma using high-dimensional multiplex imaging

Joel Eliason et al. Front Immunol. .

Abstract

Introduction: Immune checkpoint inhibitors (ICIs) have significantly improved survival for patients with metastatic melanoma, yet many experienceresistance due to immunosuppressive mechanisms within the tumor immune microenvironment (TIME). Understanding how the spatial architecture of immune and inflammatory components changes across disease stages may reveal novel prognostic biomarkers and therapeutic targets.

Methods: We performed high-dimensional spatial profiling of two melanoma tissue microarrays (TMAs), representing Stage III (n = 157) and Stage IV (n = 248) metastatic tumors. Using imaging mass cytometry (IMC) and multiplex immunofluorescence (mIF), we characterized the phenotypic, functional, and spatial properties of the TIME. Cellular neighborhoods were defined by inflammatory marker expression, and spatial interactions between immune and tumor cells were quantified using nearest-neighbor functions (G-cross). Associations with survival were assessed using Cox proportional hazards models with robust variance estimation.

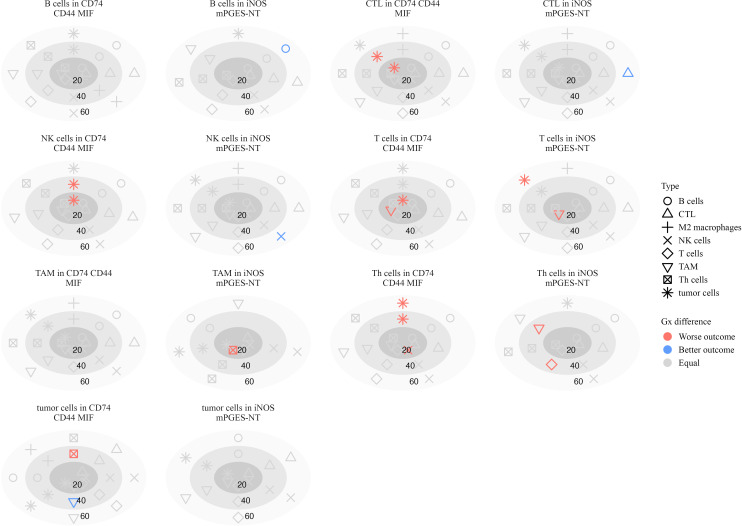
Results: Stage IV tumors exhibited a distinct immune landscape, with increased CD74- and MIF-enriched inflammatory neighborhoods and reduced iNOS-associated regions compared to Stage III. Cytotoxic T lymphocytes (CTLs) and tumor cells were more prevalent in Stage IV TIME, while B cells and NK cells were depleted. Spatial analysis revealed that CTL-Th cell, NK-T cell, and B-NK cell interactions were linked to improved survival, whereas macrophage aggregation and excessive B-Th cell clustering in inflammatory regions correlated with worse outcomes. Organ-specific analyses showed that CTL infiltration near tumor cells predicted survival in gastrointestinal metastases, while NK-T cell interactions were prognostic in lymph node and skin metastases.

Discussion: Our results reveal stage-specific shifts in immune composition and spatial organization within the melanoma TIME. In advanced disease, immunosuppressive neighborhoods emerge alongside changes in immune cell localization, with spatial patterns of immune coordination-particularly involving CTLs, NK cells, and B cells-strongly predicting survival. These findings highlight spatial biomarkers that may refine patient stratification and guide combination immunotherapy strategies targeting the inflammatory architecture of the TIME.

Keywords: immune cell crosstalk; immune exclusion; inflammatory biomarkers; inflammatory signaling pathways; melanoma progression; prognostic immune signatures; spatial immune profiling; tumor immune microenvironment (TIME).


Conflict of interest statement

AR serves as a member for Voxel Analytics LLC and consults for Genophyll LLC, Tempus Inc. and TCS Ltd. The remaining authors declare that the research was conducted in the absence of any commercial or financial relationships that could be construed as a potential conflict of interest. The author(s) declared that they were an editorial board member of Frontiers, at the time of submission. This had no impact on the peer review process and the final decision.

Figures

Figure 1
Figure 1
Analysis pipeline to characterize the spatial immune landscape of Stage III and IV melanomas. Schematic of the IMC data acquisition of two consecutive slices of two TMAs containing 2 biopsy cores from a total of 157 patients with stage III and 393 samples from 248 patients with stage IV metastatic melanoma. Samples were stained with a protein panel, segmented for tumor/stroma regions detection, followed by cellular identification and quantifications. t-distributed stochastic neighbor embedding (t-SNE) of data was derived from CyTOF of tumor samples, labeled by cell type and the signal intensities of individual markers.
Figure 2
Figure 2
Representative multiplex immunostaining of Stage III and Stage IV melanoma TMA cores showing inflammatory markers (iNOS, mPGES1, MIF, NT, CD44, and CD74; scale bars=20 µm). Top part of the figure shows their expression in sample cores combined and bottom part shows their individual expression characteristics.
Figure 3
Figure 3
Kaplan-Meier survival curves comparing overall survival (OS) probability between Stage III and Stage IV patients. The shaded regions represent 95% confidence intervals. The p-value indicates the statistical significance of the difference between the survival distributions (log-rank test). The risk table below the plot shows the number of patients at risk at each time point.
Figure 4
Figure 4
Distribution of cell type proportions across Stage III and Stage IV melanoma. Each boxplot represents the proportion of a given cell type per image, grouped by stage. Statistical significance of difference in mean proportion was assessed using a beta regression model, with significance markers (*,**, ***) indicating significant differences between stages after false discovery rate correction. Significance levels are denoted as follows: ∗ ∗ ∗ (p < 0.001), ∗ ∗ (p < 0.01), and ∗ (p < 0.05).
Figure 5
Figure 5
Distribution of neighborhood proportions across Stage III and Stage IV melanoma. Each boxplot represents the proportion of a given inflammatory neighborhood per image, grouped by stage. Statistical significance of difference in mean proportion was assessed using a beta regression model, with significance markers (*, **, ***) indicating significant differences between stages after false discovery rate correction. Significance levels are denoted as follows: ∗ ∗ ∗ (p < 0.001), ∗ ∗ (p < 0.01), and ∗ (p < 0.05).
Figure 6
Figure 6
Mean proportions of different cell types within inflammatory neighborhoods in Stage III and Stage IV melanoma. Each tile is annotated with the mean proportion of the corresponding cell type among cells in that neighborhood. In the Stage IV column, a forward slash (“/”) separates the mean proportion from statistical significance markers (*, **, ***), indicating significant differences in mean proportion between stages based on a beta regression model with false discovery rate correction. Significance levels are denoted as follows: ∗ ∗ ∗ (p < 0.001), ∗ ∗ (p < 0.01), and ∗ (p < 0.05). Text color is adjusted for readability.
Figure 7
Figure 7
Mean proportions of inflammatory neighborhoods as fractions of cells within each cell type in Stage III and Stage IV melanoma. Each tile is annotated with the mean proportion of the corresponding neighborhood among cells within that cell type. In the Stage IV column, a forward slash (“/”) separates the mean proportion from statistical significance markers (*, **, ***), indicating significant differences in mean proportion between stages based on a beta regression model with false discovery rate correction. Significance levels are denoted as follows: ∗ ∗ ∗ (p < 0.001), ∗ ∗ (p < 0.01), and ∗ (p < 0.05). Text color is adjusted for readability.
Figure 8
Figure 8
Heatmap of log-hazard ratios estimated using Cox regression, where the G-cross function at 40 µm between each pair of cell types in Stage III patients serves as a predictor of survival time. Significance levels of hazard ratios are denoted as follows: ∗ ∗ ∗ (p < 0.001), ∗ ∗ (p < 0.01), and ∗ (p < 0.05).
Figure 9
Figure 9
Heatmap of log-hazard ratios estimated using Cox regression, where the G-cross function at 40 µm between each pair of cell types in Stage IV patients serves as a predictor of survival time. Significance levels of hazard ratios are denoted as follows: ∗ ∗ ∗ (p < 0.001), ∗ ∗ (p < 0.01), and ∗ (p < 0.05).
Figure 10
Figure 10
Plots illustrating the significance of hazard ratios (p < 0.05) estimated from Cox proportional hazards models, where the G-cross function between each pair of cell types serves as a predictor of survival in stage III patients. Significant associations with worse outcomes are shown in red, while those with better outcomes are shown in blue. Within each subplot, estimates are presented relative to a focal cell type located within a specific inflammatory neighborhood, at radii of 20, 40, and 60 µm.
Figure 11
Figure 11
Plots illustrating the significance of hazard ratios (p < 0.05) estimated from Cox proportional hazards models, where the G-cross function between each pair of cell types serves as a predictor of survival in stage IV patients. Significant associations with worse outcomes are shown in red, while those with better outcomes are shown in blue. Within each subplot, estimates are presented relative to a focal cell type located within a specific inflammatory neighborhood, at radii of 20, 40, and 60 µm.

References

    1. American Cancer Society . Cancer Facts and Figures 2024. Atlanta: American Cancer Society; (2024).
    1. American Cancer Society . Cancer Facts and Figures 2021. Atlanta: American Cancer Society; (2021).
    1. American Cancer Society . Cancer Facts and Figures 2022. Atlanta: American Cancer Society; (2022).
    1. Knight AD, Luke JJ. Beyond immune checkpoint inhibitors: emerging targets in melanoma therapy. Curr Oncol Rep. (2024) 26:826–39. doi: 10.1007/s11912-024-01551-4 - DOI - PubMed
    1. Chang C-Y, Park H, Malone DC, Wang C-Y, Wilson DL, Yeh Y-M, et al. . Immune checkpoint inhibitors and immune-related adverse events in patients with advanced melanoma: A systematic review and network meta-analysis. JAMA Netw Open. (2020) 3:e201611. doi: 10.1001/jamanetworkopen.2020.1611 - DOI - PMC - PubMed

Substances

LinkOut - more resources