

Potential common mechanisms between primary Sjögren's syndrome and Hashimoto's thyroiditis: a public databases-based study
- PMID: 40364944
- PMCID: PMC12069379
- DOI: 10.3389/fgene.2025.1520332
Potential common mechanisms between primary Sjögren's syndrome and Hashimoto's thyroiditis: a public databases-based study
Abstract
Objective: Primary Sjögren's syndrome (pSS) and Hashimoto thyroiditis (HT) can occur in the same patient population, but the mechanism of co-occurrence remains unknown. This study aims to explore the underlying mechanism.
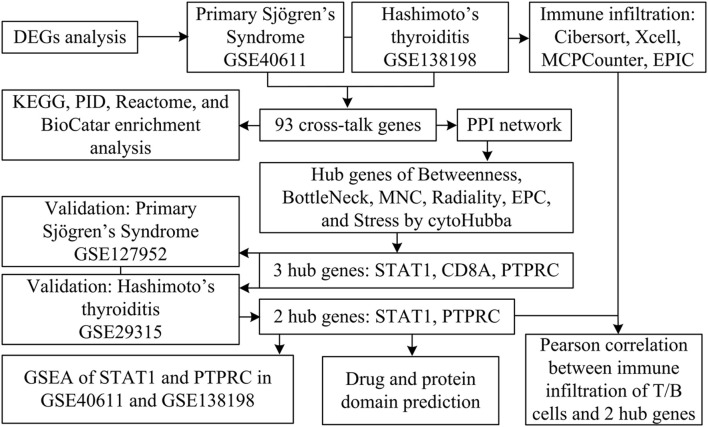
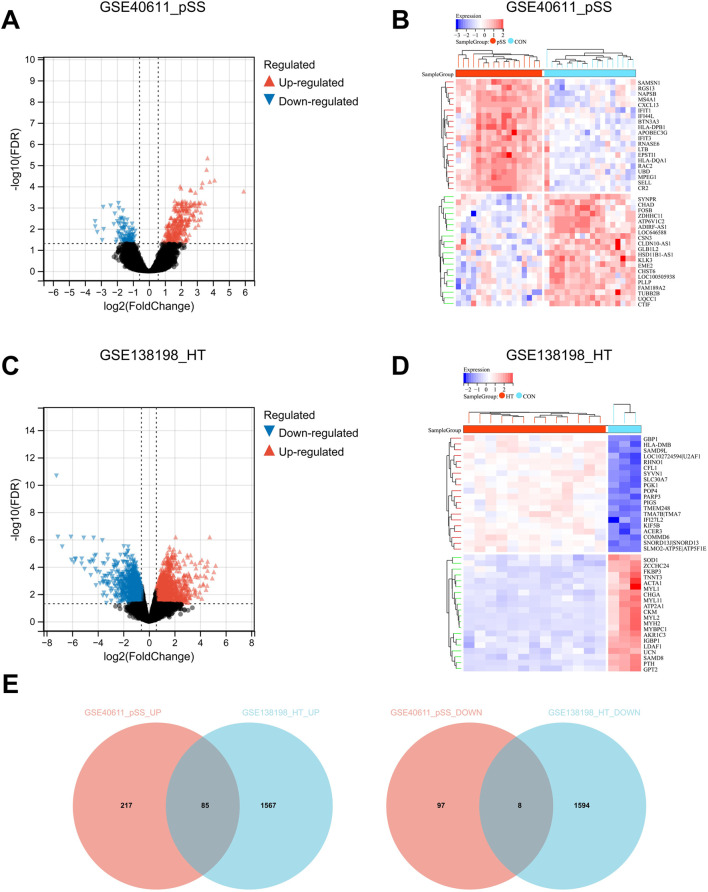
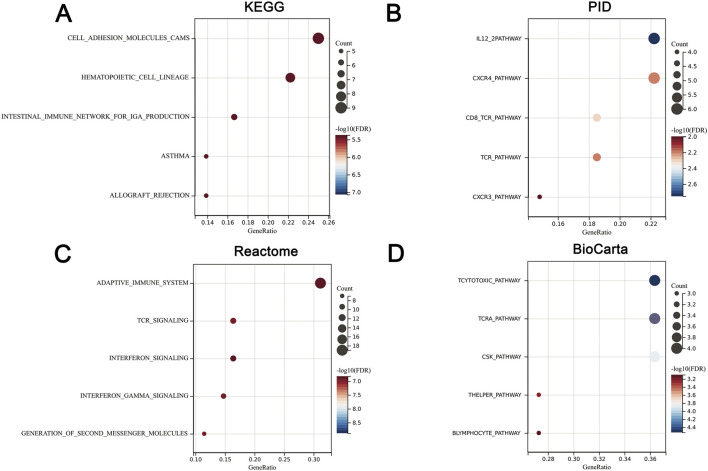
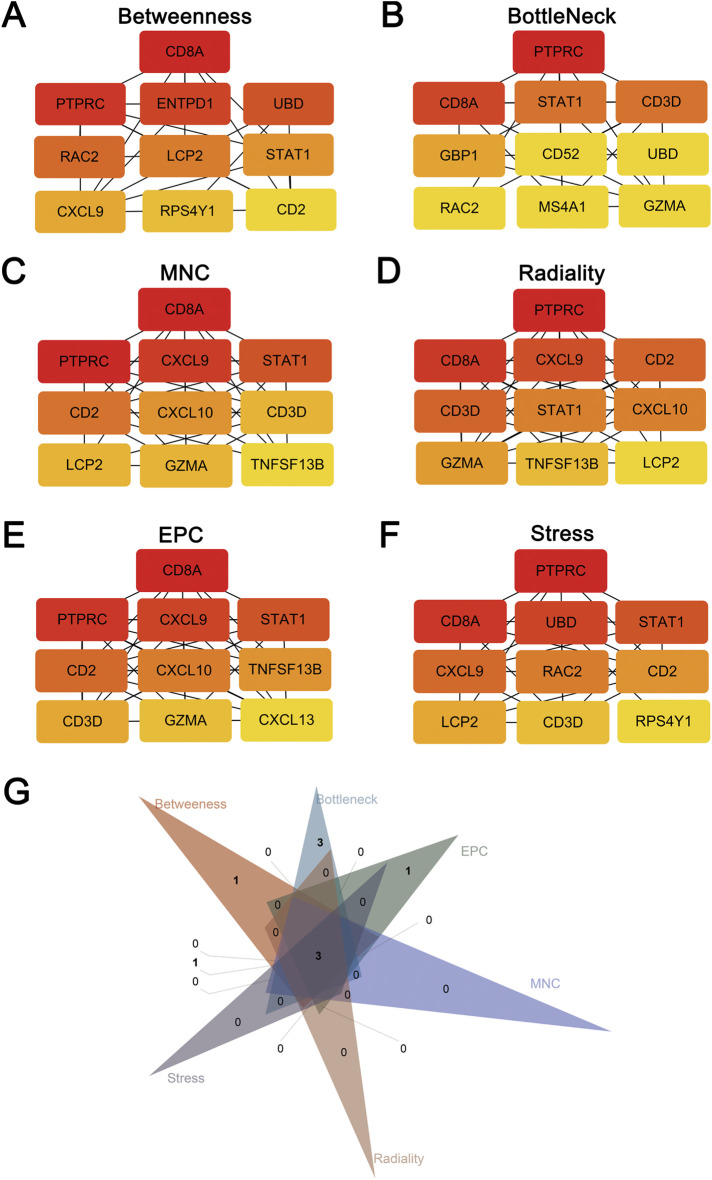
Methods: We screened differentially expressed genes (DEGs) in the pSS and HT-related transcriptomic microarrays. Based on KEGG, PID, Reactome, and BioCarta enrichment analysis, pathway annotations were performed. A PPI network was developed using STRING. Betweenness, BottleNeck, MNC, Radiality EPC, and Stress topological analyses were performed to identify hub genes. Then, we used two more datasets to validate the key genes. Immune infiltration landscape of pSS and HT were profiled based on CIBERSORT, Xcell, MCPCounter, and EPIC. Correlation between T/B cells and key genes was performed. Single gene GSEA analysis was performed to further explore enriched pathways of key genes. Finally, we predicted the drugs of key genes and the cross-talk genes targeted in the protein domain.
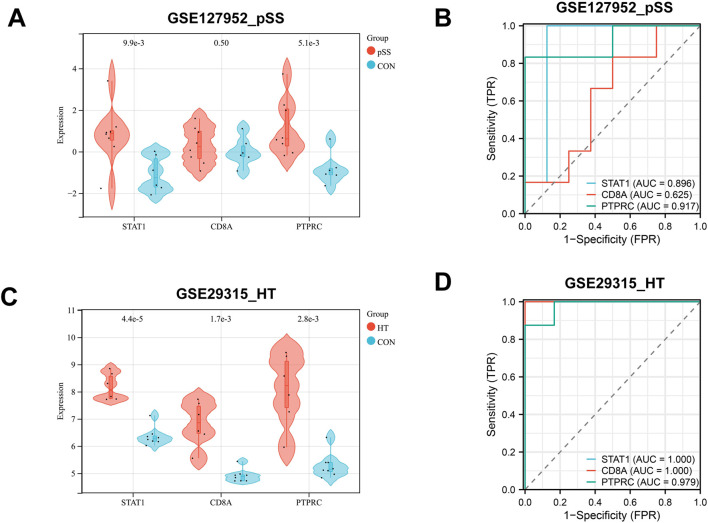
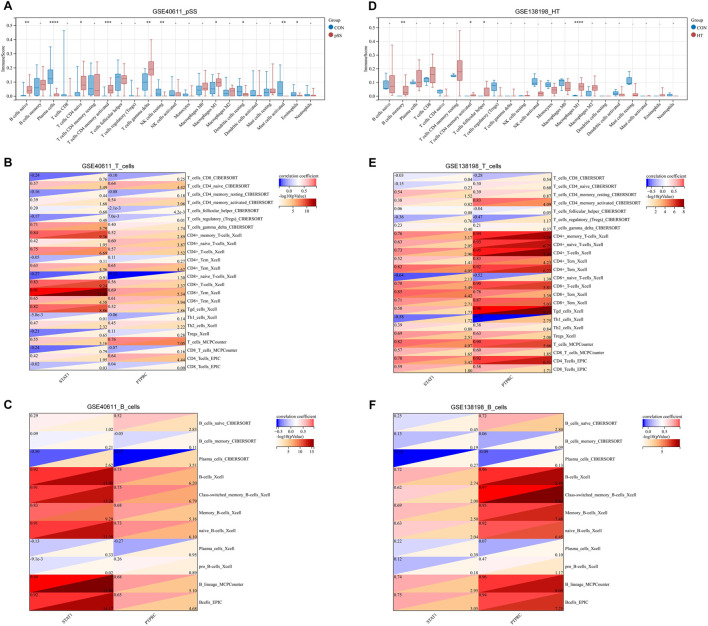
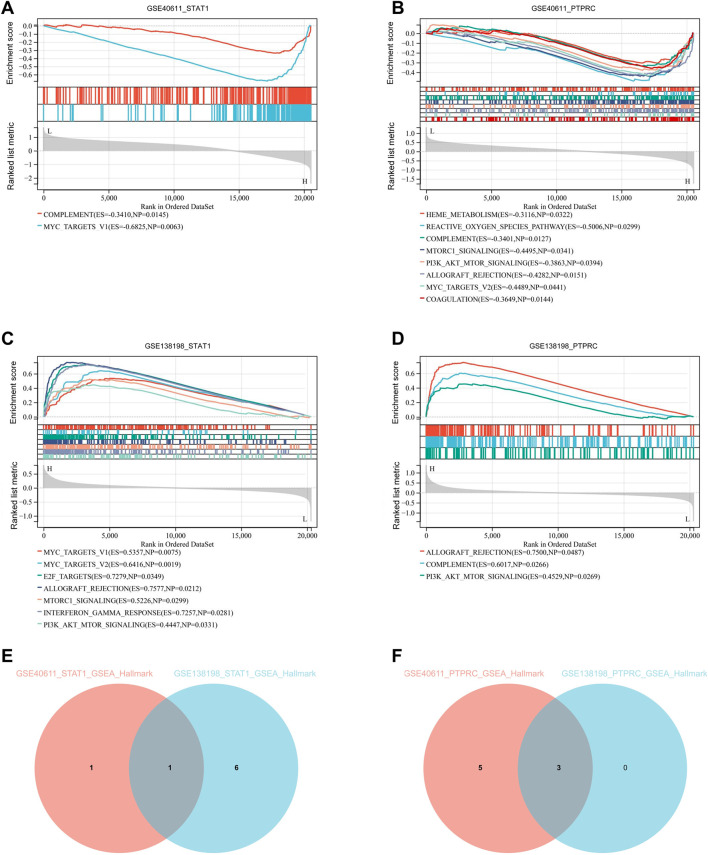
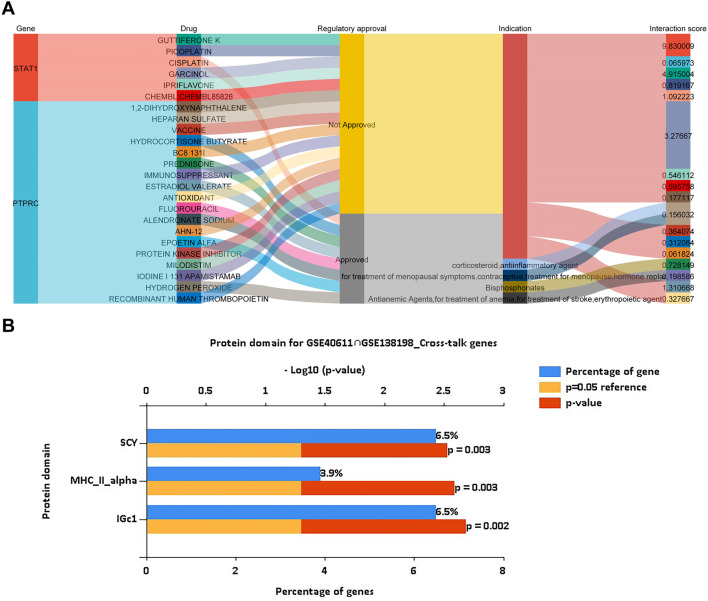
Results: A total of 93 cross-talk genes were found. These genes were mainly related to the immune system. STAT1, CD8A, and PTPRC were identified as hub genes using six topological methods. STAT1 and PTPRC are considered key genes after in silico validation. STAT1 and PTPRC were linked to CD8+ Tcm and other immune cells in the pSS and HT dataset. GSEA analysis showed that STAT1 and PTPRC may play a role in pSS and HT through several pathways, including IFNγ response, IFNα response, allograft rejection, E2F targets, complement, G2M checkpoint, IL6-JAK-STAT3 signaling, KRAS signaling up, IL2-STAT5 signaling, IL6-JAK-STAT3-signaling, and inflammatory response. Guttiferone K and picoplatin may be the candidate drugs for the treatment of pSS and HT. Cross-talk genes were mainly enriched in IGc1, MHCIIα and SCY.
Conclusion: We analysed databases and gene expression data for pSS and HT. We identified two genes (STAT1, PTPRC) as potential biomarkers of disease activity in pSS and HT. We also gained new insights into the cellular and molecular mechanisms associated with pSS and HT. Based on the key genes and cross-talk genes, we predicted potential drugs and protein domains for pSS and HT.
Keywords: Hashimoto’s thyroiditis; common mechanisms; cross-talk genes; hub genes; primary Sjögren’s syndrome.
Copyright © 2025 Lin, Tang, Lin, Wang, Xing, Xu, Li, Fang, Wei, Wu and Chen.
Conflict of interest statement
The authors declare that the research was conducted in the absence of any commercial or financial relationships that could be construed as a potential conflict of interest.
Figures
Similar articles
-
Exploring the comorbidity mechanisms between atherosclerosis and hashimoto's thyroiditis based on microarray and single-cell sequencing analysis.Sci Rep. 2025 Jan 13;15(1):1792. doi: 10.1038/s41598-025-85112-0. Sci Rep. 2025. PMID: 39805933 Free PMC article.
-
Identification of key genes in salivary gland in Sjögren's syndrome complicated with Hashimoto thyroiditis: Common pathogenesis and potential diagnostic markers.Medicine (Baltimore). 2023 Sep 29;102(39):e35188. doi: 10.1097/MD.0000000000035188. Medicine (Baltimore). 2023. PMID: 37773833 Free PMC article.
-
Transcriptomics explores potential mechanisms for the development of Primary Sjogren's syndrome to diffuse large B-cell lymphoma in B cells.BMC Immunol. 2024 Jul 30;25(1):53. doi: 10.1186/s12865-024-00646-8. BMC Immunol. 2024. PMID: 39080525 Free PMC article.
-
Comprehensive analysis of hub biomarkers associated with immune and oxidative stress in Hashimoto's thyroiditis.Arch Biochem Biophys. 2023 Sep 1;745:109713. doi: 10.1016/j.abb.2023.109713. Epub 2023 Aug 4. Arch Biochem Biophys. 2023. PMID: 37543352
-
Exploration of the shared diagnostic genes and mechanisms between periodontitis and primary Sjögren's syndrome by integrated comprehensive bioinformatics analysis and machine learning.Int Immunopharmacol. 2024 Nov 15;141:112899. doi: 10.1016/j.intimp.2024.112899. Epub 2024 Aug 13. Int Immunopharmacol. 2024. PMID: 39142001
References
LinkOut - more resources
Full Text Sources
Research Materials
Miscellaneous