. 2025 Apr 29:16:1565034.
doi: 10.3389/fmicb.2025.1565034. eCollection 2025.

Associations of rumen and rectum bacteria with the sustained productive performance of dairy cows

Affiliations

Associations of rumen and rectum bacteria with the sustained productive performance of dairy cows

Jianhao Yang et al. Front Microbiol. .

Abstract

The gut bacterial community is essential for maintaining lifelong health and productivity in ruminants, but the relationship between the gut microbiota and the sustained productivity of ruminants remains inadequately understood. In this study, we selected long-lived dairy cows in mid-lactation (≥5 parities) with different levels of milk production (n = 10). Significant differences were observed in the rumen bacterial structures between the two groups of dairy cows, whereas no significant differences were detected in the rectum bacterial communities. Additionally, there were no significant differences in serum oxidative stress biomarkers, inflammatory markers, or immunological markers between the long-lived high-yield (LH) and long-lived low-yield (LL) dairy cows. Furthermore, the concentrations of propionate (Pr) in the rumen and butyrate (Bu) in the rectum were elevated in the high-yield group. Spearman correlation and microbial co-occurrence network analyses revealed that several rumen-enriched bacteria, such as Syntrophococcus, Lachnospira, Shuttleworthia, Erysipelotrichaceae_UCG-2, and Roseburiaare associated with rumen propionate (Pr) production. In the rectum, the reduced abundance of Christensenellaceae_R-7_group and Moryella favors butyrate production. Furthermore, Random Forest machine learning analysis demonstrated that six bacterial taxa in the rumen combined with one serum biomarker, as well as three bacterial taxa in the rectum combined with three serum biomarkers, can serve as potential biomarkers for distinguishing between LH and long- LL dairy cows, achieving prediction accuracies of 92 and 99%, respectively. The findings of this study indicate that rumen and rectum bacteria are associated with the milk production phenotypes of dairy cows with sustained productivity. The rumen microbes are closely linked to the long-term productive capacity of dairy cows and represent a key target for the development of gut microbiota-based interventions. The unique bacterial communities of the rumen and rectum of long-lived high-yielding dairy cows contribute to maintaining their productive capacity.

Keywords: milk yield; production performances; productive lifespan; rectum bacteria; rumen bacteria.


Conflict of interest statement

The authors declare that the research was conducted in the absence of any commercial or financial relationships that could be construed as a potential conflict of interest.

Figures
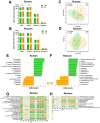
Figure 1
Figure 1
Comparison of microbiota diversity and structure in the rumen and rectum of LH and LL groups. (A,B) Alpha diversity indices of rumen and rectum microbiota. Error bars represent mean ± SEM. **p < 0.01. (C,D) The PCoA of rumen and rectum microbiota at the ASV level were based on the Bray–Curtis dissimilarity. Dissimilarity was analyzed using ANOSIM statistical tests with 999 permutations. (E,F) The LEfSe bar plots show differentially abundant bacterial taxa between LH and LL groups in rumen and rectum microbial community. The significance threshold was set at LDA >2 and p < 0.05. (G,H) Heatmaps show the association between rectum and rumen bacterial genera (average relative abundance > 0.1 and 0.01%) and the production and physiological parameters (Spearman’s correlation). *p < 0.05, **p < 0.01, and ***p < 0.001.
Figure 2
Figure 2
Differences in the BugBase-predicted microbial phenotypes between LH and LL groups. (A,B) Prediction of nine microbial phenotypes in the rumen and rectum of LH and LL groups using BugBase phenotype prediction. The bars represent mean ± SEM. *p < 0.05.
Figure 3
Figure 3
Correlation between rumen and rectum SCFAs, differential serum parameters and MY-related microbiota. (A,B) Concentrations of SCFAs in the rumen and rectum of the LH and LL groups. The bars represent mean ± SEM. *p < 0.05. (C,D) Correlation matrix among physiological parameters, SCFA concentrations in rumen and rectum, and serum metabolites in the LH and LL groups were calculated using Mantel’s test. The distance matrix for clinical factors was computed based on the Bray–Curtis algorithm, while Spearman’s correlation coefficients were used to evaluate associations. *p < 0.05, **p < 0.01, and ***p < 0.001. (E,F) Spearman’s rank correlation heatmaps between MY-related bacteria and SCFAs in rumen and rectum. The color gradient represents the values of correlation coefficients. *p < 0.05, **p < 0.01, and ***p < 0.001.
Figure 4
Figure 4
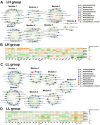
Co-occurrence networks and correlation analysis of rumen microbiota in LH and LL cows. (A,C) Co-occurrence network of rumen bacteria at the genus level, with bacterial genera assigned based on their network roles in LH and LL cows (n = 10 per group). Nodes represent bacterial genera, with node size indicating the relative abundance of each genus. The color of the edges between nodes indicates positive (green) or negative (yellow) correlations (Spearman’s |r| >0.60 and p < 0.05). The thickness of the edges represents the magnitude of Spearman’s |r|. (B,D) Correlation analysis on the rumen microbiota modules and phenotypes in LH and LL group. The color gradient represents the values of correlation coefficients (Spearman’s correlation). *p < 0.05, **p < 0.01, and ***p < 0.001.
Figure 5
Figure 5
Functional predictions of rumen bacteria between LH and LL groups by PICRUSt2. Relative abundances of functional KEGG pathways at level 1, level 2, and level 3 in rumen bacteria (top 10 of global and overview map, carbohydrate metabolism, amino acid metabolism, and metabolism of cofactors and vitamins). KEGG pathways were compared using Student’s t-tests. *p < 0.05.
Figure 6
Figure 6
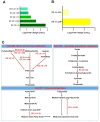
Differential rumen KEGG enzymes and metabolic pathways between LH and LL groups. (A,B) Significantly different rumen carbohydrate-related and lipid-related KEGG enzymes between LH and LL groups (LDA >2, p < 0.05). (C) Differential microbial metabolic pathways between LH and LL groups. Red names and arrows indicate KEGG orthology and KEGG enzymes enriched in LH cows. EC, Enzyme Commission.
Figure 7
Figure 7
Multiplex networks showing the relationships between phenotypes. (A) Multiplex networks about the relationships between rumen bacteria, rumen carbohydrate-related KEGG enzymes, rumen fermentation parameter, and milk production phenotypes. (B) Multiplex networks showing the relationships between rumen bacteria, rumen lipid-related KEGG enzymes, and milk production phenotypes. Lines between two nodes represent the correlation, with a yellow line indicating a positive correlation and a blue line indicating a negative correlation; Line thickness represents the strength of the correlation (Spearman’s |r| >0.50 and p < 0.05).
Figure 8
Figure 8
Random forest-based classification of milk yield in long-lived cows using (A) rumen and (B) rectum microbiota and phenotypic data. Important phenotypes were ranked by mean decrease in accuracy for classifying LH and LL groups. The classification model integrated SCFAs, serum parameters, and bacteria data to differentiate milk production categories using a random-forest algorithm.
Figure 9
Figure 9
Diagram of the effects of rumen and rectum bacteria on the production performance of high-yielding and long-lived dairy cows. FFAs, free fatty acids; Gro, glycerol; M/LCFAs, medium and long-chain fatty acids; CM, chylomicron.

Similar articles

References

    1. Amin A. B., Zhang L., Zhang J., Mao S. (2022). Metagenomic and metabolomic insights into the mechanism underlying the disparity in milk yield of Holstein cows. Front. Microbiol. 13:844968. doi: 10.3389/fmicb.2022.844968, PMID: - DOI - PMC - PubMed
    1. Antanaitis R., Džermeikaitė K., Krištolaitytė J., Girdauskaitė A., Arlauskaitė S., Tolkačiovaitė K., et al. . (2024). The relation between milk lactose concentration and the rumination, feeding, and locomotion behavior of early-lactation dairy cows. Animals 14:836. doi: 10.3390/ani14060836, PMID: - DOI - PMC - PubMed
    1. Aschenbach J. R., Kristensen N. B., Donkin S. S., Hammon H. M., Penner G. B. (2010). Gluconeogenesis in dairy cows: the secret of making sweet milk from sour dough. IUBMB Life 62, 869–877. doi: 10.1002/iub.400, PMID: - DOI - PubMed
    1. Aschenbach J. R., Zebeli Q., Patra A. K., Greco G., Amasheh S., Penner G. B. (2019). Symposium review: the importance of the ruminal epithelial barrier for a healthy and productive cow. J. Dairy Sci. 102, 1866–1882. doi: 10.3168/jds.2018-15243, PMID: - DOI - PubMed
    1. Bai H., Lai Z., Zhang J., Zheng X., Zhang J., Jin W., et al. . (2024). Host genetic regulation of specific functional groups in the rumen microbiome of dairy cows: implications for lactation trait. J. Adv. Res. doi: 10.1016/j.jare.2024.11.012, PMID: - DOI - PubMed

LinkOut - more resources