

Decoding the Tumor Microenvironment of Myoepithelial Cells in Triple-Negative Breast Cancer Through Single-Cell and Transcriptomic Sequencing and Establishing a Prognostic Model Based on Key Myoepithelial Cell Genes
- PMID: 40365116
- PMCID: PMC12074843
- DOI: 10.1155/ijog/6454413
Decoding the Tumor Microenvironment of Myoepithelial Cells in Triple-Negative Breast Cancer Through Single-Cell and Transcriptomic Sequencing and Establishing a Prognostic Model Based on Key Myoepithelial Cell Genes
Abstract
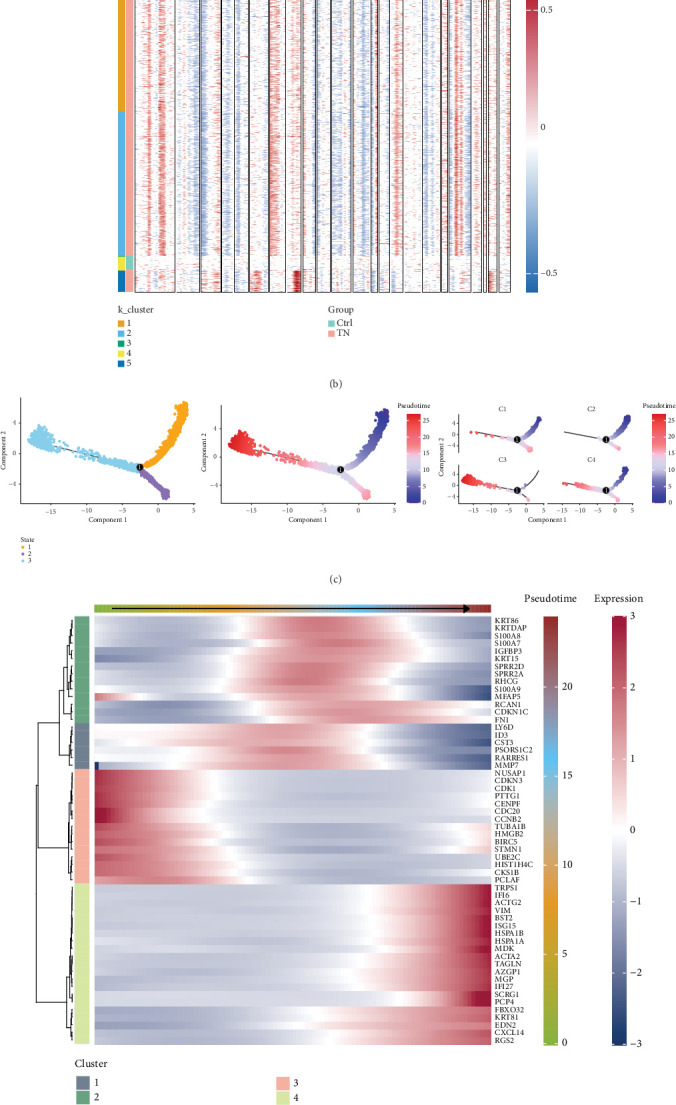
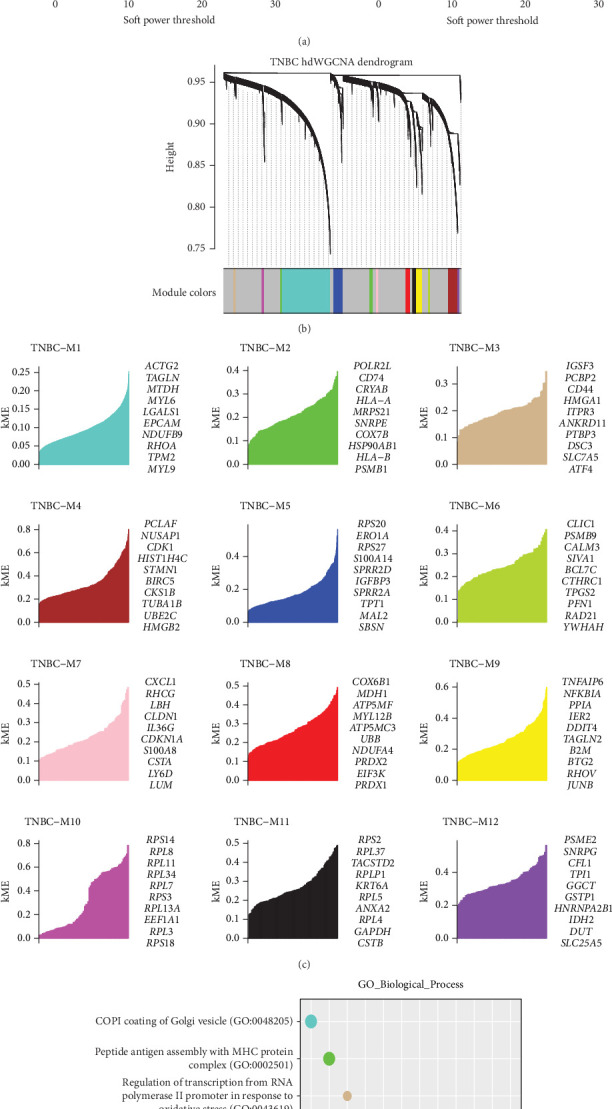
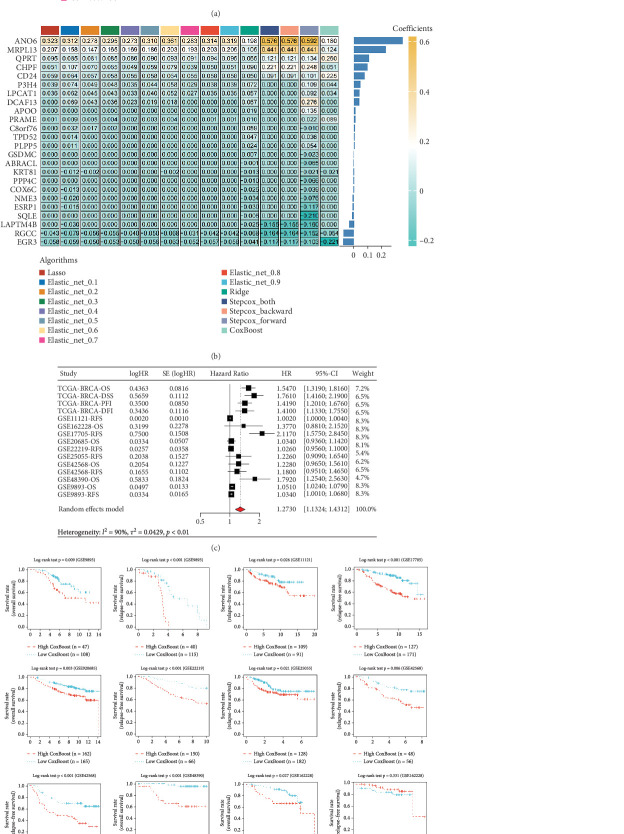
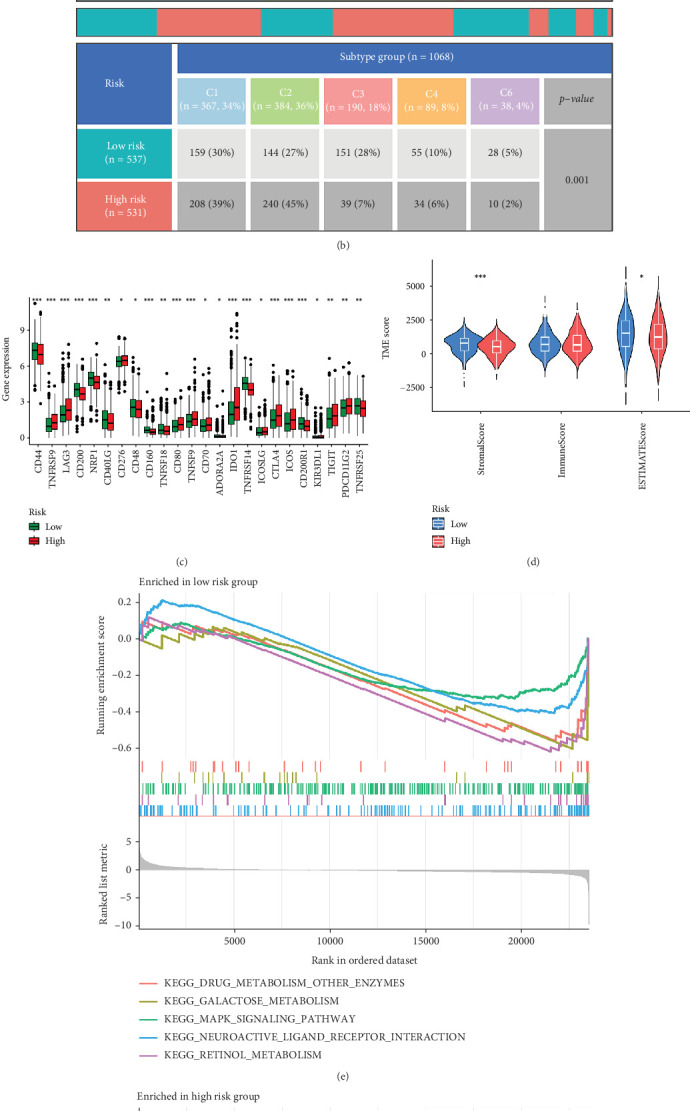
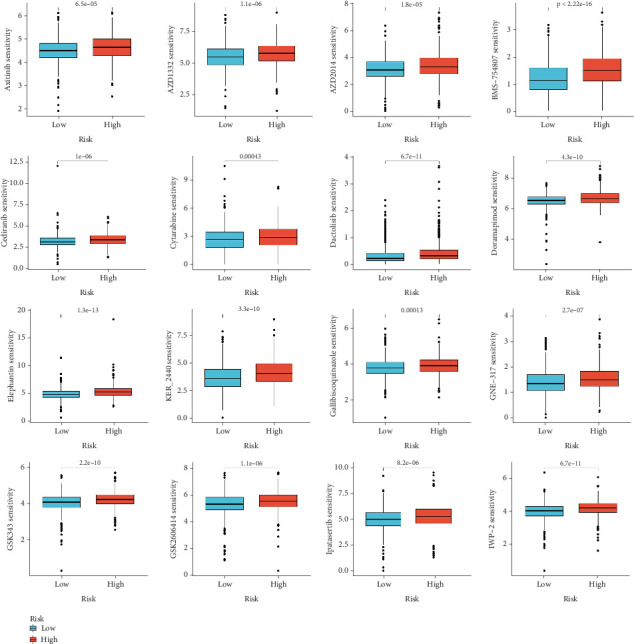
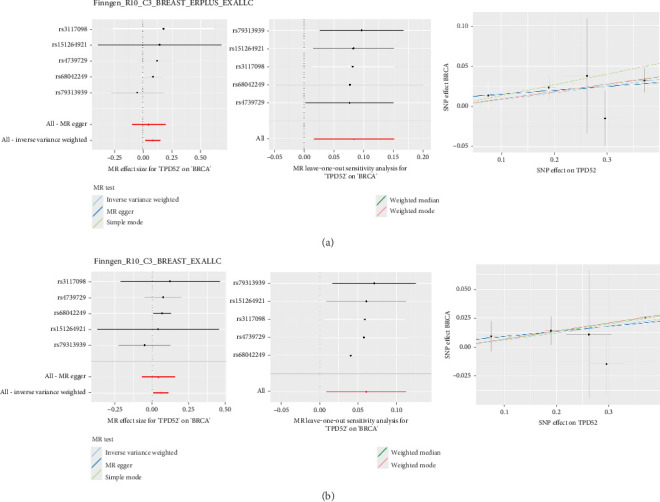
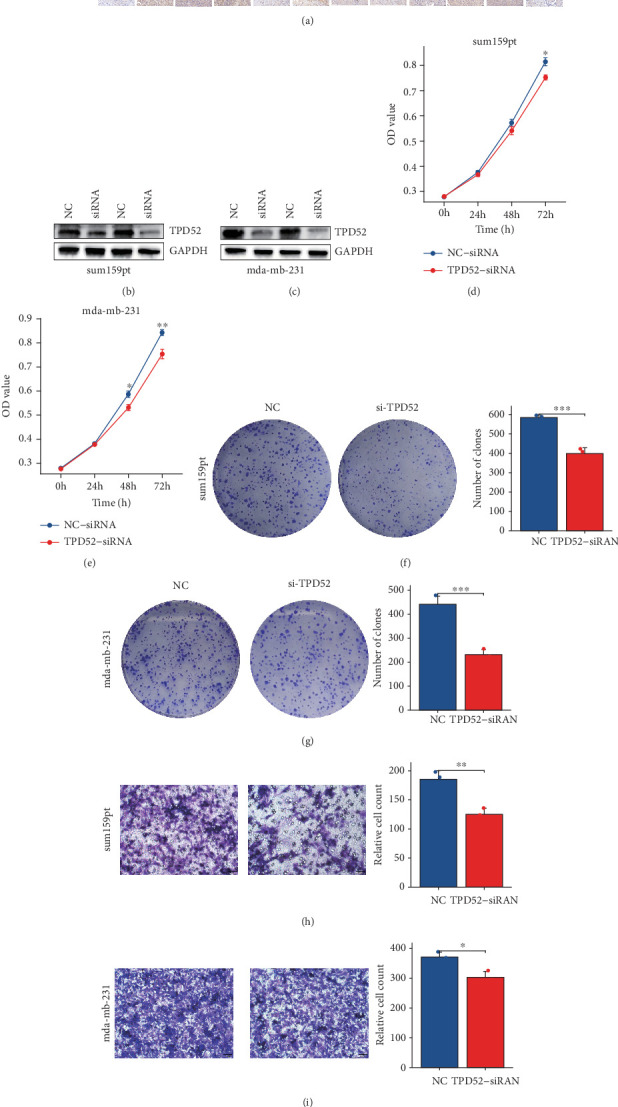
Background: Triple-negative breast cancer (TNBC) is an aggressive subtype with high malignancy, rapid progression, and a poor 5-year survival rate of ~77%. Due to the lack of targeted therapies, treatment options are limited, highlighting the urgent need for novel therapeutic strategies. Myoepithelial cells (MECs) in the tumor microenvironment may significantly influence TNBC development and progression. Methods: This study used single-cell RNA sequencing to compare the MEC gene expression in the normal versus TNBC tissues. TNBC-associated MECs showed increased expression of proliferation- and immune-related genes (e.g., FDCSP, KRT14, and KRT17) and decreased expression of inflammatory and extracellular matrix-related genes (e.g., CXCL8, SRGN, and DCN). Copy number variation and pseudotime analyses revealed genomic alterations and phenotypic dynamics in MECs. A CoxBoost-based prognostic model was developed and validated across 20 survival cohorts, integrating immune profiling, pathway enrichment, and drug sensitivity analyses. Mendelian randomization identified TPD52 as a TNBC risk-associated gene. siRNA knockdown of TPD52 was performed in TNBC cell lines to evaluate its effects on proliferation and migration. Results: TNBC MECs displayed significant changes in the gene expression and genomic integrity, impacting immune responses and tumor invasion. The prognostic model effectively predicted 1-, 3-, and 5-year survival outcomes, stratifying high-risk patients with enriched cell cycle and DNA replication pathways, reduced immune checkpoint expression, and chemotherapy resistance. TPD52 was identified as a tumor-promoting gene, and its knockdown suppressed TNBC cell proliferation and migration. Conclusion: This study highlights MECs' role in TNBC progression, provides a CoxBoost prognostic model for personalized treatment, and identifies TPD52 as a potential therapeutic target for TNBC intervention.
Keywords: TNBC; myoepithelial cells; prognosis.
Copyright © 2025 Xiaocheng Yu et al. International Journal of Genomics published by John Wiley & Sons Ltd.
Conflict of interest statement
The authors declare no conflicts of interest.
Figures

Similar articles
-
Programmed cell death-related prognostic genes mediate dysregulation of the immune microenvironment in triple-negative breast cancer.Front Immunol. 2025 Mar 12;16:1563630. doi: 10.3389/fimmu.2025.1563630. eCollection 2025. Front Immunol. 2025. PMID: 40145099 Free PMC article.
-
Regulatory T cells are associated with the tumor immune microenvironment and immunotherapy response in triple-negative breast cancer.Front Immunol. 2023 Sep 12;14:1263537. doi: 10.3389/fimmu.2023.1263537. eCollection 2023. Front Immunol. 2023. PMID: 37767092 Free PMC article.
-
Research and experimental verification on the mechanisms of cellular senescence in triple-negative breast cancer.PeerJ. 2024 Feb 29;12:e16935. doi: 10.7717/peerj.16935. eCollection 2024. PeerJ. 2024. PMID: 38435998 Free PMC article.
-
The analysis of gene co-expression network and immune infiltration revealed biomarkers between triple-negative and non-triple negative breast cancer.Front Genet. 2025 Jan 6;15:1505011. doi: 10.3389/fgene.2024.1505011. eCollection 2024. Front Genet. 2025. PMID: 39834541 Free PMC article.
-
A Systematic Review on the Therapeutic Potentiality of PD-L1-Inhibiting MicroRNAs for Triple-Negative Breast Cancer: Toward Single-Cell Sequencing-Guided Biomimetic Delivery.Genes (Basel). 2021 Aug 4;12(8):1206. doi: 10.3390/genes12081206. Genes (Basel). 2021. PMID: 34440380 Free PMC article.
References
-
- Bray F., Laversanne M., Sung H., et al. GLOBOCAN Estimates of Incidence and Mortality Worldwide for 36 Cancers in 185 Countries. CA: A Cancer Journal for Clinicians . 2022;74(2024):229–263. - PubMed
-
- Li Y., Yue L., Zhang S., et al. Proteomic, Single-Cell and Bulk Transcriptomic Analysis of Plasma and Tumor Tissues Unveil Core Proteins in Response to Anti-PD-L1 Immunotherapy in Triple Negative Breast Cancer. Computers in Biology and Medicine . 2024;176 doi: 10.1016/j.compbiomed.2024.108537.108537 - DOI - PubMed
LinkOut - more resources
Full Text Sources
Research Materials
Miscellaneous
