

Differential modulation of neural oscillations in perception-action links in Tourette syndrome
- PMID: 40365133
- PMCID: PMC12070268
- DOI: 10.1093/braincomms/fcaf172
Differential modulation of neural oscillations in perception-action links in Tourette syndrome
Abstract
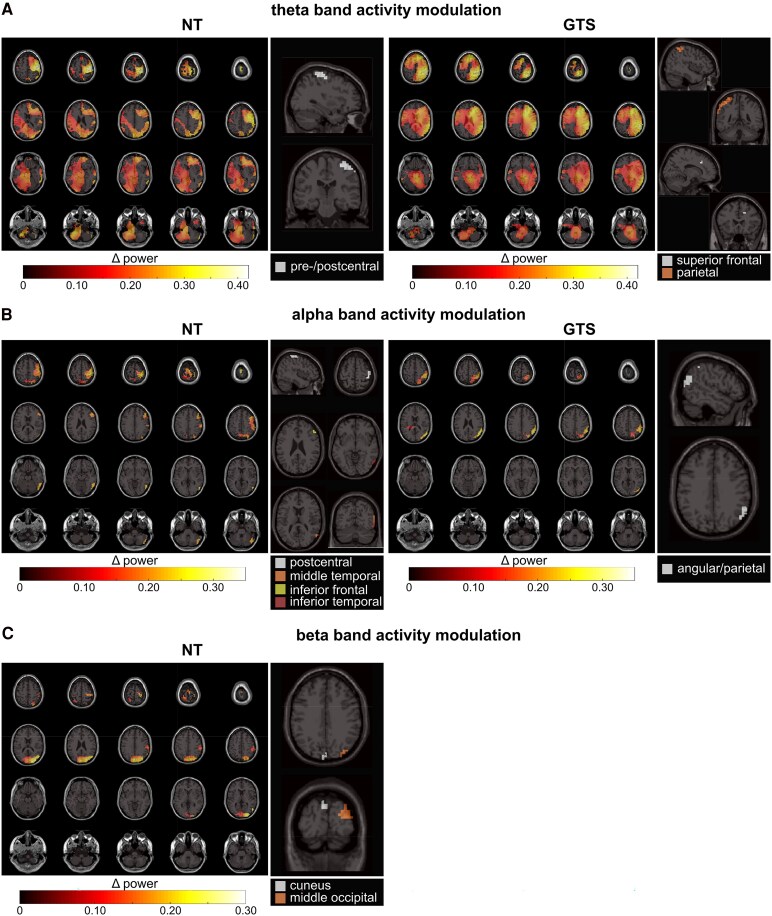
Gilles de la Tourette Syndrome (GTS) is a multi-faceted neuro-psychiatric disorder. While novel conceptions overcoming the criticized categorization of GTS as a movement disorder are on the rise, little is known about their neural implementation and whether there are links to known pathophysiological processes in GTS. This is the case for conceptions suggesting that aberrant perception-action processes reflect a key feature of GTS. Building on the concept that overly strong perception-action associations are pivotal to understanding GTS pathophysiology, we examined how these associations influence response inhibition and used EEG methods to examine the importance of theta, alpha and beta band activity due to their known relevance for GTS pathophysiology. In this case-control study, behavioural analyses revealed that adult patients with GTS experienced greater difficulty during motor response inhibition when perceptual features of Nogo stimuli overlapped with perceptual features of Go stimuli, indicating impaired reconfiguration of perception-action associations. Neurophysiological findings showed robust differential patterns of modulation in theta and alpha band activity between neurotypical (NT) individuals and GTS patients. Specifically, GTS patients exhibited stronger and more extended theta band modulation but weaker and more restricted alpha band modulation during overlapping Nogo trials than NT individuals. Unlike NT individuals, GTS patients did not exhibit beta band modulations necessary for dynamically handling perception-action codes. The findings highlight increased theta band modulation in GTS patients' significant stronger perception-action bindings and a lack of compensatory alpha band modulation. The robust differential modulation observed provides novel insights, emphasizing theta and alpha oscillations as key elements in GTS pathophysiology and offering potential implications for targeted cognitive-behavioural interventions.
Keywords: Tourette syndrome; alpha band activity; perception–action integration; response inhibition; theta band activity.
© The Author(s) 2025. Published by Oxford University Press on behalf of the Guarantors of Brain.
Conflict of interest statement
The authors report no competing interests.
Figures


Similar articles
-
Distinct Brain-Oscillatory Neuroanatomical Architecture of Perception-Action Integration in Adolescents With Tourette Syndrome.Biol Psychiatry Glob Open Sci. 2021 Apr 26;1(2):123-134. doi: 10.1016/j.bpsgos.2021.04.003. eCollection 2021 Aug. Biol Psychiatry Glob Open Sci. 2021. PMID: 36324991 Free PMC article.
-
Theta Activity Dynamics during Embedded Response Plan Processing in Tourette Syndrome.Biomedicines. 2023 Jan 28;11(2):393. doi: 10.3390/biomedicines11020393. Biomedicines. 2023. PMID: 36830930 Free PMC article.
-
Altered perception-action binding modulates inhibitory control in Gilles de la Tourette syndrome.J Child Psychol Psychiatry. 2019 Sep;60(9):953-962. doi: 10.1111/jcpp.12938. Epub 2018 Jun 20. J Child Psychol Psychiatry. 2019. PMID: 29924402
-
Neurofeedback and its possible relevance for the treatment of Tourette syndrome.Neurosci Biobehav Rev. 2015 Apr;51:87-99. doi: 10.1016/j.neubiorev.2015.01.012. Epub 2015 Jan 20. Neurosci Biobehav Rev. 2015. PMID: 25616186 Review.
-
Lower-level associations in Gilles de la Tourette syndrome: Convergence between hyperbinding of stimulus and response features and procedural hyperfunctioning theories.Eur J Neurosci. 2021 Aug;54(3):5143-5160. doi: 10.1111/ejn.15366. Epub 2021 Jul 7. Eur J Neurosci. 2021. PMID: 34155701 Review.
References
-
- Robertson MM, Eapen V, Singer HS, et al. Gilles de la Tourette syndrome. Nat Rev Dis Primers. 2017;3(1):16097. - PubMed
-
- Beste C, Münchau A. Tics and Tourette syndrome—Surplus of actions rather than disorder? Mov Disord. 2018;33(2):238–242. - PubMed
-
- Bartha S, Bluschke A, Rawish T, et al. Extra movements in healthy people: Challenging the definition and diagnostic practice of tic disorders. Ann Neurol. 2023;93(3):472–478. - PubMed
LinkOut - more resources
Full Text Sources
Research Materials