. 2025 Apr 21;15(12):5592-5615.
doi: 10.7150/thno.106811. eCollection 2025.

Integrated cascade antioxidant nanozymes-Cu5.4O@CNDs combat acute liver injury by regulating retinol metabolism

Affiliations

Integrated cascade antioxidant nanozymes-Cu5.4O@CNDs combat acute liver injury by regulating retinol metabolism

Jiayu Chen et al. Theranostics. .

Abstract

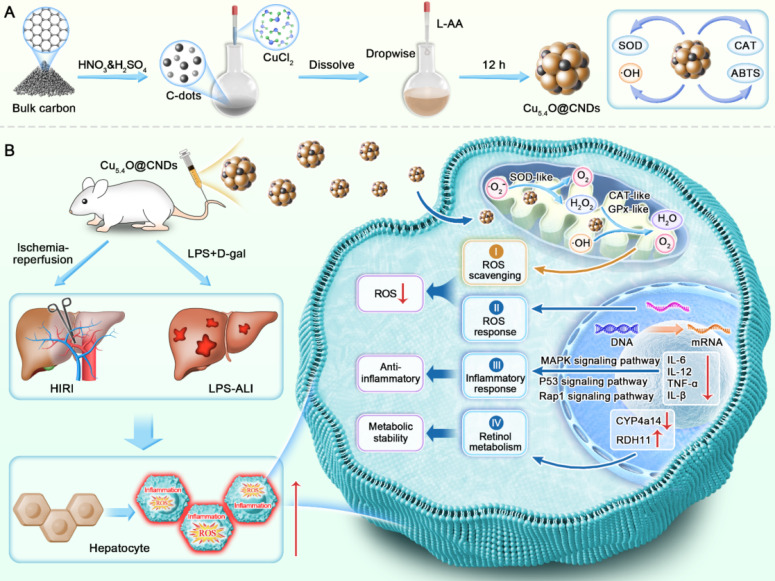
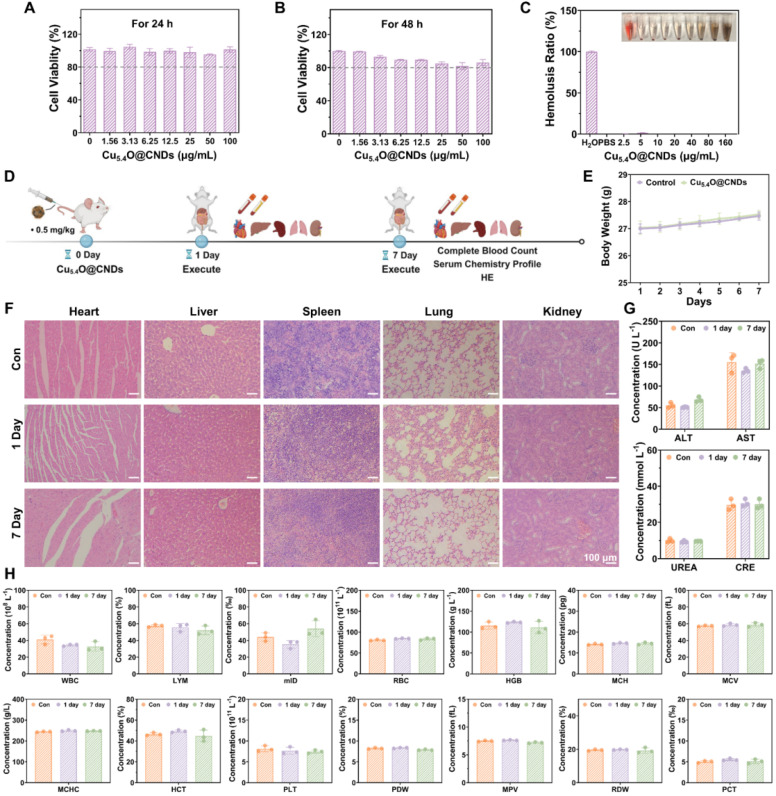
Background: Acute liver failure (ALF) represents a critical medical condition marked by the abrupt onset of hepatocyte damage, commonly induced by etiological factors such as hepatic ischemia/reperfusion injury (HIRI) and drug-induced hepatotoxicity. Across various types of liver injury, oxidative stress, heightened inflammatory responses, and dysregulated hepatic retinol metabolism are pivotal contributors, particularly in the context of excessive reactive oxygen species (ROS). Methods: C-dots were combined with Cu5.4O USNPs to synthesize a cost-effective nanozyme, Cu5.4O@CNDs, which mimics the activity of cascade enzymes. The in vitro evaluation demonstrated the ROS scavenging and anti-inflammatory capacity of Cu5.4O@CNDs. The therapeutic potential of Cu5.4O@CNDs was evaluated in vivo using mouse models of hepatic ischemia/reperfusion injury and LPS/D-GalN induced hepatitis, with transcriptome analysis conducted to clarify the mechanism underlying hepatoprotection. Results: The Cu5.4O@CNDs demonstrated superoxide dismutase (SOD) and catalase (CAT) enzyme activities, as well as hydroxyl radical (·OH) scavenging capabilities, effectively mitigating ROS in vitro. Furthermore, the Cu5.4O@CNDs exhibited remarkable targeting efficacy towards inflammation cells induced by H2O2 and hepatic tissues in murine models of hepatitis, alongside exhibiting favorable biocompatibility in both in vitro and in vivo settings. Moreover, it has been demonstrated that Cu5.4O@CNDs effectively scavenged ROS, thereby enhancing cell survival in vitro. Additionally, Cu5.4O@CNDs exhibited significant therapeutic efficacy in mice models of HIRI and lipopolysaccharide-induced acute lung injury (LPS-ALI). This efficacy was achieved through the modulation of the ROS response and hepatic inflammatory network, as well as the amelioration of disruptions in hepatic retinol metabolism. Conclusions: In summary, this study demonstrates that Cu5.4O@CNDs exhibit significant potential for the treatment of various acute liver injury conditions, suggesting their promise as an intervention strategy for clinical application.

Keywords: Acute liver injury; C-dots nanozymes; Cu5.4O nanoparticles; Hepatic ischemia-reperfusion injury; Reactive oxygen species.


Conflict of interest statement

Competing Interests: The authors have declared that no competing interest exists.

Figures

Scheme 1
Scheme 1
Schematic representation of Cu5.4O@CNDs for the treatment of HIRI and LPS-ALI diseases. (A) Synthesis route of Cu5.4O@CNDs with multiple enzymatic activities. (B) Cu5.4O@CNDs were injected into mice via the tail vein to scavenge excess ROS as free radical scavengers and to treat various acute liver injury diseases through anti-inflammatory, antioxidant, and regulation of retinol metabolism.
Figure 1
Figure 1
Transcriptomic sequencing of HIRI and LPS-ALI to analyze potential pathogenesis. (A) PCA analysis was done using the GSE112713 database and the GSE38941 database. (B) GSEA analysis of ROS metabolic process, inflammatory response pathway, and retinol metabolism was done using the GSE112713 database and GSE38941 database. (C) H&E staining of Con, HIRI, and LPS-ALI. (D) Volcano plots showed the identified upregulated and downregulated genes by Cu5.4O@CNDs. (E) GO (Biological Process) analysis. The 15 most significantly enriched pathways are shown. (F) Differential gene heat maps associated with Response to ROS (fold change ≥ 2 and P < 0.01). (H) Differential gene heat maps associated with Retinol metabolic process (fold change ≥ 2 and P < 0.01). (G) Differential gene heat maps associated with Inflammatory response (fold change ≥ 2 and P < 0.01).
Figure 2
Figure 2
Synthesis and characterization of C-dots, Cu5.4O USNPs, Cu5.4O@CNDs. (A) Synthesis path diagram of C-dots, Cu5.4O USNPs, Cu5.4O@CNDs. The figure was created partially with BioRender.com. (B-D) TEM and HR-TEM images of C-dots, Cu5.4O USNPs, and Cu5.4O@CNDs. (E) Zeta potential of C-dots, Cu5.4O USNPs, Cu5.4O@CNDs. (F) XRD patterns of C-dots, Cu5.4O USNPs, Cu5.4O@CNDs. (G) FTIR spectra of C-dots, Cu5.4O USNPs, Cu5.4O@CNDs. (H) XPS patterns of C-dots, Cu5.4O USNPs, Cu5.4O@CNDs. (I-J) C 1s split-peak fitting profiles of C-dots and Cu5.4O@CNDs. (K-L) Cu 2p split-peak fitting profiles of Cu5.4O USNPs and Cu5.4O@CNDs.
Figure 3
Figure 3
Enzymatic characterization of C-dots, Cu5.4O USNPs, Cu5.4O@CNDs. (A) Schematic diagram of O2•- scavenging by SOD-like enzymes. (B) The O2•- the scavenging capability of C-dots, Cu5.4O USNPs, Cu5.4O@CNDs. (C) The WST-1 kit evaluated the SOD-like activity of C-dots, Cu5.4O USNPs, and Cu5.4O@CNDs. (D) ESR assay for O2•- scavenging capability of C-dots, Cu5.4O USNPs, Cu5.4O@CNDs. (E) The schematic diagram for the scavenging of H2O2 by CAT-like enzymes. (F) Ultraviolet absorption test H2O2 scavenging capability of C-dots, Cu5.4O USNPs, Cu5.4O@CNDs. (G) The dissolved oxygen level of C-dots, Cu5.4O USNPs, and Cu5.4O@CNDs reacted with H2O2 detected by an oxygen sensor. (H) ESR assay for H2O2 scavenging capability of C-dots, Cu5.4O USNPs, Cu5.4O@CNDs. (I) The schematic diagram for the scavenging of ⋅OH and ABTS•+ radicals. (J) The ⋅OH scavenging capability of C-dots, Cu5.4O USNPs, Cu5.4O@CNDs. (K) ESR assay for ⋅OH scavenging capability of C-dots, Cu5.4O USNPs, Cu5.4O@CNDs. (L) The ABTS•+ radical scavenging capability of C-dots, Cu5.4O USNPs, Cu5.4O@CNDs. Data represent means ± s.d. from three independent replicates. ns: not significant, *P < 0.05, **P < 0.01, ***P < 0.001, one-way ANOVA.
Figure 4
Figure 4
Cellular uptake and biodistribution of Cu5.4O@CNDs. (A) Fluorescence images of THLE-2 cells incubated with Cu5.4O@CNDs for 4 h. (B) Fluorescence images of Raw264.7 cells incubated with Cu5.4O@CNDs for 4 h. (C) Fluorescence imaging of healthy mice and organs at specified time points after intravenous injection of Cu5.4O@CNDs. (D) Fluorescence imaging of hepatitis mice and organs at specified time points after intravenous injection of Cu5.4O@CNDs. (E-F) Distribution of Cu5.4O@CNDs in major organs at different time points. (G) Difference of liver fluorescence level between healthy mice and hepatitis mice after intravenous injection of Cu5.4O@CNDs. (H) Average cellular fluorescence signals of blood at different time points after intravenous injection of Cu5.4O@CNDs. Data represent means ± s.d. from three independent replicates. ns: not significant, *P < 0.05, **P < 0.01, ***P < 0.001, one-way ANOVA.
Figure 5
Figure 5
Anti-oxidative stress properties of Cu5.4O@CNDs in vitro. (A) Schematic representation of Cu5.4O@CNDs treatment of Oxidative stress cells. The figure was created partially with BioRender.com. (B) Representative JC-1 staining of THLE-2 and Raw264.7 cells under different treatment conditions. (C) Quantitative analysis of JC-1 fluorescent staining of THLE-2 cells. (D) Quantitative analysis of JC-1 fluorescent staining of Raw264.7 cells. (E) The quantitative flow cytometry results show cell apoptosis and necrosis distribution of THLE-2 cells under different treatment conditions. (F) The quantitative flow cytometry results show cell apoptosis and necrosis distribution of Raw264.7 cells under different treatment conditions. (G) Representative DHE staining of THLE-2 and Raw264.7 cells under different treatment conditions. (H) Quantitative analysis of DHE fluorescent staining of THLE-2 cells. (I) Quantitative analysis of DHE fluorescent staining of Raw264.7 cells. (J) Representative DCFH-DA staining of THLE-2 and Raw264.7 cells under different treatment conditions. (K) Quantitative analysis of DCFH-DA fluorescent staining of THLE-2 cells. (L) Quantitative analysis of DCFH-DA fluorescent staining of Raw264.7 cells. (M) The results by flow cytometry to ROS levels of THLE-2 cells under the indicated treatment conditions. (N) The results by flow cytometry to ROS levels of Raw264.7 cells under the indicated treatment conditions. (O) Quantitative analysis of flow cytometry to ROS levels of THLE-2 cells under the indicated treatment conditions. (P) Quantitative analysis of flow cytometry to ROS levels of Raw264.7 cells under the indicated treatment conditions. Data represent means ± s.d. from three independent replicates. ns: not significant, *P < 0.05, **P < 0.01, ***P < 0.001, one-way ANOVA.
Figure 6
Figure 6
Anti-inflammatory properties of Cu5.4O@CNDs in vitro. (A) Schematic representation of Cu5.4O@CNDs treatment of LPS-induced inflammatory cells. The figure was created partially with BioRender.com. (B) Representative JC-1 staining of THLE-2 & Raw264.7 cells under different treatment conditions. (C) Quantitative analysis of JC-1 fluorescent staining of THLE-2 cells. (D) Quantitative analysis of JC-1 fluorescent staining of Raw264.7 cells. (E) The results by flow cytometry to CD80 levels of Raw264.7 cells under different treatment conditions. (F) Quantitative analysis of flow cytometry to CD80 levels of Raw264.7 cells. (G) Relative expression of mRNAs for inflammatory cytokines of IL-1β, IL-6, IL-12, and TNF-α. Data represent means ± s.d. from three independent replicates. ns: not significant, *P < 0.05, **P < 0.01, ***P < 0.001, one-way ANOVA.
Figure 7
Figure 7
Biocompatibility of Cu5.4O@CNDs. (A) THLE-2 cell viability after incubation for 24 h with Cu5.4O@CNDs. (B) THLE-2 cell viability after incubation for 48 h with Cu5.4O@CNDs. (C) The ratio of hemolysis in the subgroups. (D) Schematic diagram of biocompatibility experiment. The figure was created partially with BioRender.com. (E) Weight variation of normal mice at 7 days after treatment with Cu5.4O@CNDs. (F) Evaluation of in vivo toxicity of Cu5.4O@CNDs to major organs (heart, liver, spleen, lung, and spleen) at 1 day and 7 days after intravenous administration. (G) Serum levels of liver function indicators: alanine transaminase (ALT) and aspartate transaminase (AST). Serum levels of kidney function indicators: blood urea nitrogen (UREA) and creatinine (CRE). (H) Blood parameters in normal mice (control group) and mice intravenously injected with Cu5.4O@CNDs. Data represent means ± s.d. from three independent replicates. ns: not significant, *P < 0.05, **P < 0.01, ***P < 0.001, one-way ANOVA.
Figure 8
Figure 8
In vivo therapeutic efficacy of Cu5.4O@CNDs on HIRI & LPS-ALI mice. (A) Schematic illustration of the establishment and treatment schedule of HIRI mice. The figure was created partially with BioRender.com. (B) Optical image of liver tissue. (C) H&E staining (Scale bar: 100 μm & 50 μm) of liver tissues. (D) Serum levels of ALT and AST in HIRI mice at 24 h after different treatments. (E) TUNEL assay, DCFH-DA, and DHE staining (Scale bar: 25 μm) of liver tissues. (F) Relative expression of mRNAs for cytokines of IL-1β, IL-6, IL-12, TNF-α. (G) Schematic illustration of the establishment and treatment schedule of LPS-ALI mice. The figure was created partially with BioRender.com. (H) H&E staining (Scale bar: 200 μm & 100 μm) of liver tissues. (I) Serum levels of ALT and AST in LPS-ALI mice at 12 h after different treatments. (J) TUNEL assay, DCFH-DA, and DHE staining (Scale bar: 25 μm) of liver tissues. (K) Relative expression of mRNAs for cytokines of IL-1β, IL-6, IL-12, TNF-α. Data represent means ± s.d. from three independent replicates. ns: not significant, *P < 0.05, **P < 0.01, ***P < 0.001, one-way ANOVA.
Figure 9
Figure 9
Therapeutic mechanisms of Cu5.4O@CNDs on HIRI & LPS-ALI. (A) PCoA of the DEGs between the Sham group, HIRI group, and Cu5.4O@CNDs group (n = 4), each point represented one mouse. (B) PCoA of the DEGs between the Sham group, LPS-ALI group, and Cu5.4O@CNDs group (n = 4), each point represented one mouse. (C) Differential gene heat maps associated with Response to ROS (fold change≥2 and P< 0.01). (D) Differential gene heat maps related to inflammatory response (fold change≥2 and P< 0.01). (E) Differential genes with the same trend in HIRI and LPS-ALI. (F) Differential gene heat maps with the same trend in HIRI and LPS-ALI. (G) KEGG pathway enrichment analysis. The 20 most significantly enriched pathways were shown. (H) Differential gene heat maps associated with Retinol metabolic process (fold change≥2 and P< 0.01). (I) Expression difference of CYP4a14 and RDH11 genes in HIRI and LPS-ALI diseases, respectively. (J) Liver protein expression of CYP4a14 and RDH11 (n = 3).

Similar articles

References

    1. Bernal W, Lee WM, Wendon J, Larsen FS, Williams R. Acute liver failure: A curable disease by 2024? J Hepatol. 2015;62(1 Suppl):S112–120. - PubMed
    1. Wendon J, Cordoba J, Dhawan A, Larsen FS, Manns M, Samuel D. et al. Easl clinical practical guidelines on the management of acute (fulminant) liver failure. J Hepatol. 2017;66(5):1047–1081. - PubMed
    1. Reuben A, Tillman H, Fontana RJ, Davern T, Mcguire B, Stravitz RT. et al. Outcomes in adults with acute liver failure between 1998 and 2013. Ann Intern Med. 2016;164(11):724–732. - PMC - PubMed
    1. Bernal W, Wendon J. Acute liver failure. N Engl J Med. 2013;369(26):2525–2534. - PubMed
    1. Bajaj JS, Cordoba J, Mullen KD, Amodio P, Shawcross DL, Butterworth RF. et al. Review article: The design of clinical trials in hepatic encephalopathy - an international society for hepatic encephalopathy and nitrogen metabolism (ishen) consensus statement. Aliment Pharmacol Ther. 2011;33(7):739–747. - PMC - PubMed

MeSH terms