. 2025 Apr 28;15(12):6022-6043.
doi: 10.7150/thno.107200. eCollection 2025.

pH-responsive nano-vaccine combined with anti-PD-1 antibodies for enhanced immunotherapy of breast cancer

Affiliations

pH-responsive nano-vaccine combined with anti-PD-1 antibodies for enhanced immunotherapy of breast cancer

Ning Wang et al. Theranostics. .

Abstract

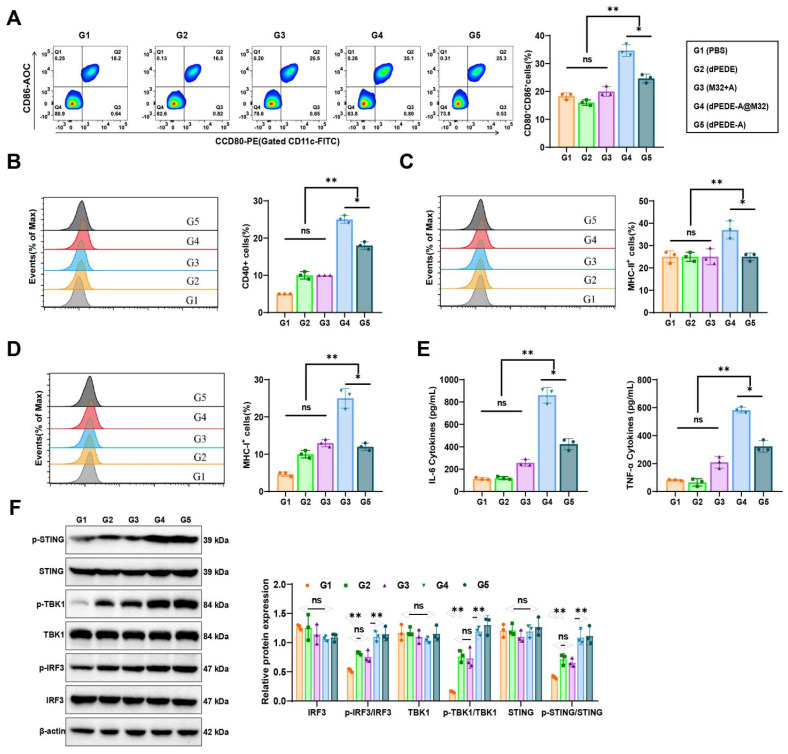
Objective: This study aimed to investigate the therapeutic potential and underlying mechanisms of a novel pH-responsive nano-vaccine in combination with anti-Programmed Cell Death Protein 1 (PD-1) antibodies for the treatment of breast cancer (BC), with a focus on tumor growth inhibition, metastasis prevention, and immune microenvironment modulation. Methods: A pH-responsive amphiphilic diblock copolymer was synthesized using reversible addition-fragmentation chain transfer (RAFT) polymerization and conjugated with STING agonist ADU-S100 and mannose to specifically target dendritic cells (DCs). The nano-vaccine was further formulated with antigen peptides and polyethyleneimine (PEI) to enhance antigen delivery. Its particle size, stability, and surface charge were characterized using dynamic light scattering (DLS) and zeta potential analysis. In vitro, the immunostimulatory capacity of the nano-vaccine was evaluated via flow cytometry (FCM) analysis of DC activation markers. In vivo, mouse immune and tumor recurrence models were used to assess the its effects on T-cell activation, tumor suppression, and immune memory induction. The therapeutic efficacy of nano-vaccine/anti-PD-1 combination therapy was further assessed. Results: The nano-vaccine efficiently activated DCs and promoted antigen presentation, as indicated by increased CD80, CD86, and MHC-II expression in vitro. In mouse models, it effectively inhibited tumor growth, induced antigen-specific T-cell responses, and suppressed recurrent and metastatic tumor progression. The combination with anti-PD-1 antibodies further enhanced tumor control, immune cell infiltration, and survival rates compared to monotherapy. Conclusion: The pH-responsive nano-vaccine combined with anti-PD-1 antibodies showed remarkable synergistic effects in BC treatment, highlighting its potential to enhance immune checkpoint blockade therapy and offer a promising strategy for clinical applications in solid tumors.

Keywords: antigen delivery; breast cancer; immune memory; immunotherapy; nano-vaccine; programmed cell death protein 1; tumor metastasis; tumor microenvironment.


Conflict of interest statement

Competing Interests: The authors have declared that no competing interest exists.

Figures

Figure 1
Figure 1
Schematic of the nano-vaccine delivering STING agonist and antigen. Note: (A) Schematic illustration of the nano-vaccine preparation and disassembly process of the nano-vaccine; (B) Diagram illustrating how the nano-vaccine enhances the STING pathway and boosts T-cell immune responses to improve immunity.
Figure 2
Figure 2
Schematic of the nano-vaccine delivering STING agonist and antigen. Note: (A) DLS and TEM images (top left) showing the size distribution and morphology of PEDE, dPEDE-A, and dPEDE-A@M32 nano-vaccines, scale bar = 50nm; (B) Zeta potential measurement of PEDE, dPEDE-A, and dPEDE-A@M32 nano-vaccine; (C) Release curve of ADU-S100 from dPEDE-A@M32 at different pH conditions; (D) Release curve of the model antigen M32 from dPEDE-A@M32 at different pH conditions; (E) Representative in vivo fluorescence imaging showing the biodistribution of PEDE@M32, PEDE-A@M32, dPED-A@M32, and dPEDE-A@M32 24 h after subcutaneous injection in mice; (F-G) Fluorescence imaging of axillary and iLNs isolated 24 or 48 h after subcutaneous injection (F) and corresponding statistical analysis (G) of axillary and inguinal LNs at 24 or 48 h after subcutaneous injection, assessing the biodistribution of PEDE@M32, PEDE-A@M32, dPED-A@M32, and dPEDE-A@M32 in vivo; (H) CLSM detection of co-localization of antigen and micelle nanoparticles in iLNs 48 h after injection, bar = 25μm; (I) Fluorescence labeling detection of DC (CD45+CD11c+MHCII+) uptake of M32 48 h post-inoculation. In vitro experiments were repeated three times, with three animals per group in animal experiments. Values are presented as mean ± SD. 'ns' indicates no significant difference between groups, * p < 0.05, ** p < 0.01, *** p < 0.001.
Figure 3
Figure 3
Experimental validation of dPEDE-A@M32 in promoting DC maturation and antigen cross-presentation while activating the cGAS-STING pathway. Note: (A) FCM analysis of BMDCs co-incubated for 24 h with free M32-FITC+ADU-S100, blank carrier dPEDE-FITC, and nano-vaccine dPEDE-A@M32-FITC, showing the percentage of CD80⁺CD86⁺ positive cells; (B-D) FCM analysis of BMDCs after 24-hour co-incubation with free M32-FITC+ADU-S100, blank carrier dPEDE-FITC, and nano-vaccine dPEDE-A@M32-FITC, (B) Percentage of CD40-positive cells, (C) Percentage of MHC-II-positive cells, (D) Percentage of MHC-I-positive cells; (E) ELISA measurements of IL-6 and TNFα levels in the supernatants of BMDCs from different treatment groups; (F) Western Blot analysis detecting the protein expression levels of p-STING, p-TBK1, and p-IRF3 in BMDCs under different treatment groups. In vitro experiments were repeated three times. Values are presented as mean ± SD. 'ns' indicates no significant difference between groups, * p < 0.05, ** p < 0.01, *** p < 0.001.
Figure 4
Figure 4
Impact of nano-vaccine mediated mouse DC immune responses on primary tumor development. Note: Mice were divided into four groups and received subcutaneous injections of PBS, dPEDE, M32+A, dPEDE-A, and dPEDE-A@M32 on days 0, 7, and 14 in the left flank. On day 21, serum, splenocytes, and iLNs cells were collected to assess the immunological effects of the nano-vaccine. (A) Schematic diagram of the mouse immune model and experimental procedure; (B) FCM analysis of the proportion of CD80+CD86+ positive DCs extracted from the iLNs of mice in different treatment groups; (C) Percentage of CD40+ positive DCs extracted from the iLNs of mice in different treatment groups; (D) ELISA measurements of TNF-α and IFN-γ levels in the serum of mice from different treatment groups; (E) Schematic diagram of the mouse immune tumor growth model and experimental procedure; (F) In vivo bioluminescence imaging of 4T1-luc tumors, showing three representative mice per group; (G) Tumor growth curves for different treatment groups; (H) Survival curves for different treatment groups. Each group in animal experiments consisted of six mice, and values are presented as mean ± SD, ** p < 0.01, *** p < 0.001.
Figure 5
Figure 5
Observing the therapeutic efficacy of nano-vaccine on BC recurrence. Note: (A) Schematic diagram of treatment in the 4T1-luc orthotopic tumor incomplete resection model; (B) In vivo bioluminescence imaging of 4T1-luc tumors post-primary tumor resection, displaying three representative mice per group; (C) Tumor growth curves of the tumor resection model treated with PBS, dPEDE, M32+A, dPEDE-A, and dPEDE-A@M32; (D) Survival curves of the tumor resection model treated with PBS, dPEDE, M32+A, dPEDE-A, and dPEDE-A@M32; (E) FCM analysis of tumor-infiltrating CD8+ T cells and CD4+Foxp3+ Tregs, with images and relative quantitative statistics; (F) FCM analysis of TAMs: M1 type (CD80hi CD11b+ F4/80+) and M2 type (CD206hi CD11b+ F4/80+), with images and relative quantitative statistics; (G) FCM analysis of effector memory T-cells (CD62Llow CD44hi CD3+ CD8+ TEM) in the spleen, with images and relative quantitative statistics. Each group in animal experiments consisted of six mice, and values are presented as mean ± SD. 'ns' indicates no significant difference between groups, * p < 0.05, ** p <0.01, *** p < 0.001.
Figure 6
Figure 6
Observing the therapeutic efficacy of nano-vaccine on hematogenous metastasis of BC. Note: (A) Schematic of the hematogenous metastasis model, in which 4T1-luc breast cancer cells were intravenously injected into tumor-bearing mice on day 10, followed by treatment with PBS, dPEDE, M32+A, dPEDE-A, and dPEDE-A@M32 at specific time points; (B-C) In vitro bioluminescence imaging (BLI) of the lungs on day 20 post-treatment, with quantification (C). Representative images of three mice per group are shown (B) and corresponding statistical analysis (C), displaying three representative mice per group; (D) Tumor growth curves of the hematogenous metastasis model treated with PBS, dPEDE, M32+A, dPEDE-A, and dPEDE-A@M32; (E) Survival curves of the hematogenous metastasis model treated with PBS, dPEDE, M32+A, dPEDE-A, and dPEDE-A@M32; (F) Lung metastasis images and quantification of lung metastases in the PBS, dPEDE, M32+A, dPEDE-A, and dPEDE-A@M32 groups; (G) H&E staining of lung metastatic areas, with quantification of lung metastasis ratios, scale bar = 100 μm; (H) FCM analysis images and relative quantitative statistics of CD8+ T cells in the blood; (I) FCM analysis images and relative quantitative statistics of CD4+Foxp3+ Tregs in the blood. Each group in animal experiments consisted of six mice, and values are presented as mean ± SD. 'ns' indicates no significant difference between groups, * p < 0.05, ** p <0.01, *** p < 0.001.
Figure 7
Figure 7
Impact of nano-vaccine combined with ICB therapy on BC mice. Note: (A) Immunostaining images of tumor tissues for IFN-γ and PD-1 post-nano-vaccine treatment, bar = 100μm; (B) Schematic diagram of the combined treatment process; (C) Tumor growth curves for the BC mouse groups; (D) Display of tumor volume and mass on day 28 post-treatment in each BC mouse group; (E) Survival curves for the BC mouse groups; (F) Flow cytometer analysis showing the proportion of INFγ+CD8+ T cells, TNF-α+CD8+ T cells, and GzmB+CD8+ T cells in tumor tissues of BC mice across different groups; (G-I) Tumor sections stained with H&E, Ki67, and TUNEL (G), statistical graph of Ki67 positive cells (H), and statistical graph of TUNEL positive cells (I), bar = 50 μm. Each group in animal experiments consisted of six mice, and values are presented as mean ± SD. 'ns' indicates no significant difference between groups, * p < 0.05, ** p <0.01, *** p < 0.001.

Similar articles

References

    1. Nagy Z, Jeselsohn R. ESR1 fusions and therapeutic resistance in metastatic breast cancer. Front Oncol. 2023;12:1037531. - PMC - PubMed
    1. Ye L, Zhong F, Sun S, Ou X, Yuan J, Zhu J. et al. Tamoxifen induces ferroptosis in MCF-7 organoid. J Cancer Res Ther. 2023;19:1627–35. - PubMed
    1. Wang B, Li R, Wu S, Liu X, Ren J, Li J. et al. Breast cancer resistance to cyclin-dependent kinases 4/6 inhibitors: intricacy of the molecular mechanisms. Front Oncol. 2021;11:11. 651541. - PMC - PubMed
    1. Sung H, Ferlay J, Siegel RL, Laversanne M, Soerjomataram I, Jemal A. et al. Global cancer statistics 2020: GLOBOCAN estimates of incidence and mortality worldwide for 36 cancers in 185 countries. CA Cancer J Clin. 2021;71:209–49. - PubMed
    1. Wilkinson L, Gathani T. Understanding breast cancer as a global health concern. Br J Radiol. 2021;95:20211033. - PMC - PubMed

MeSH terms