. 2025 Apr 28;15(12):5969-5997.
doi: 10.7150/thno.111266. eCollection 2025.

Lipopolysaccharide-induced DNA damage response activates DNA-PKcs to drive actin cytoskeleton disruption and cardiac microvascular dysfunction in endotoxemia

Affiliations

Lipopolysaccharide-induced DNA damage response activates DNA-PKcs to drive actin cytoskeleton disruption and cardiac microvascular dysfunction in endotoxemia

Ying Tan et al. Theranostics. .

Abstract

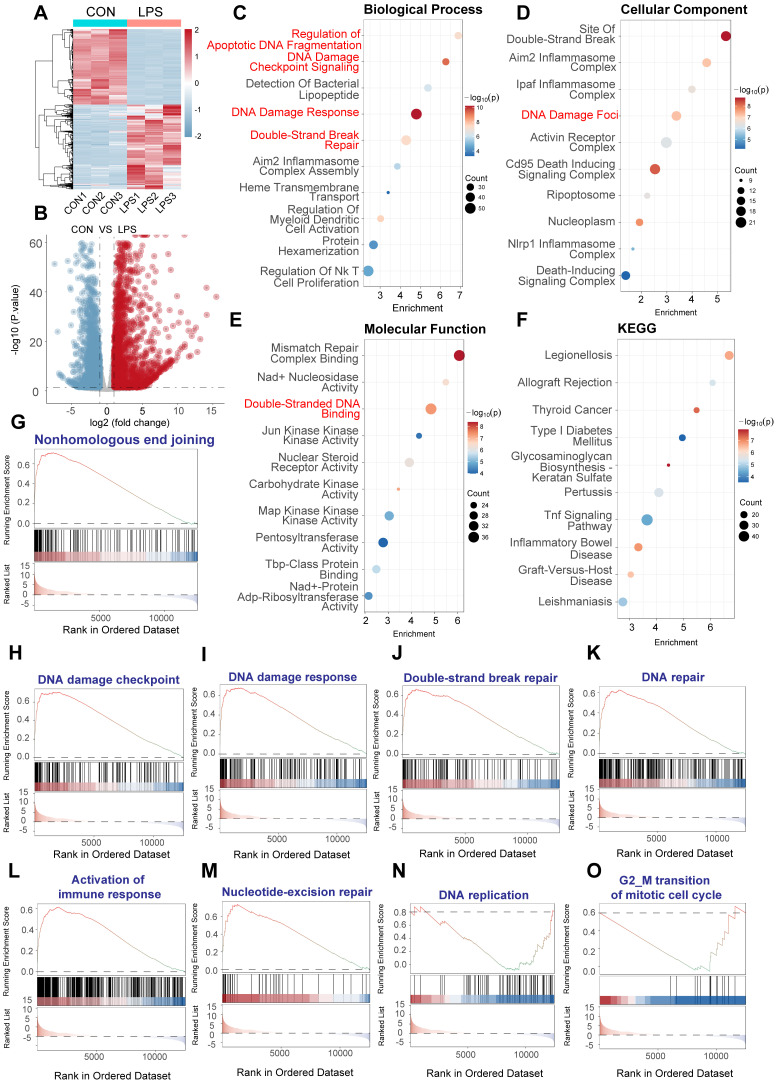
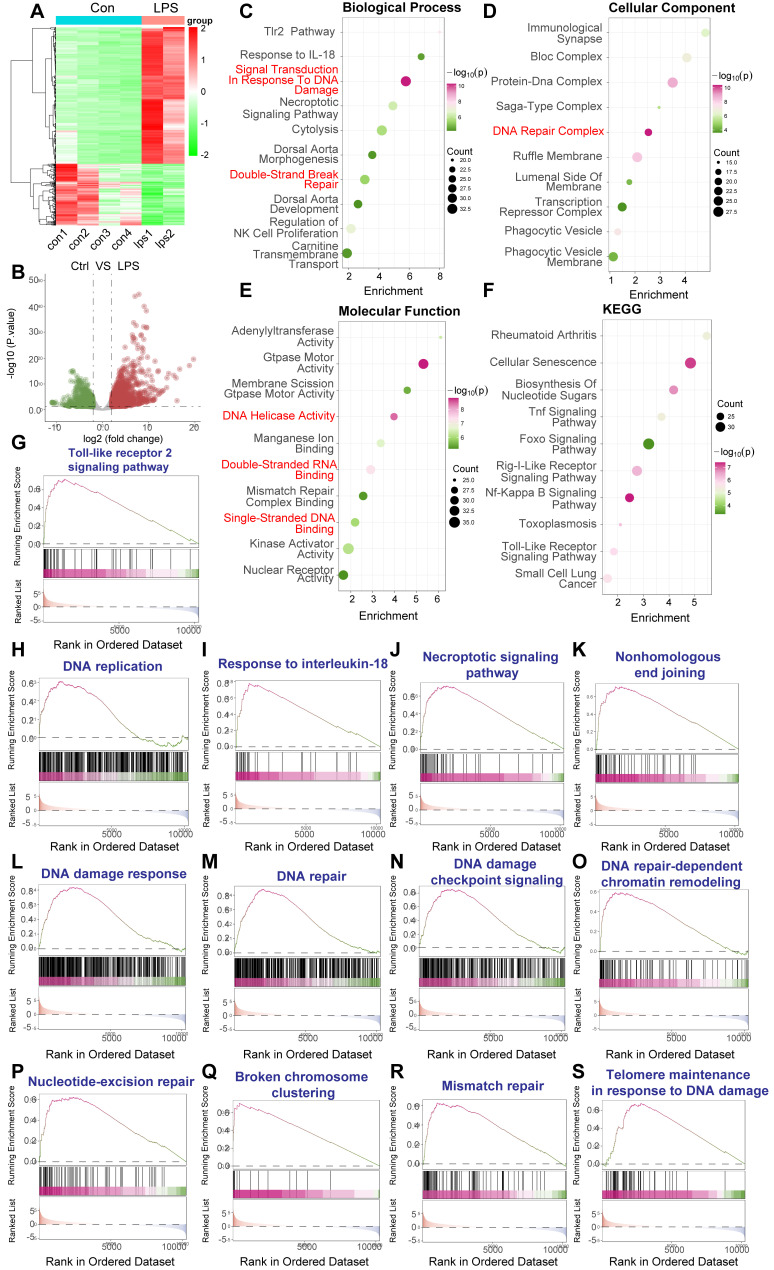
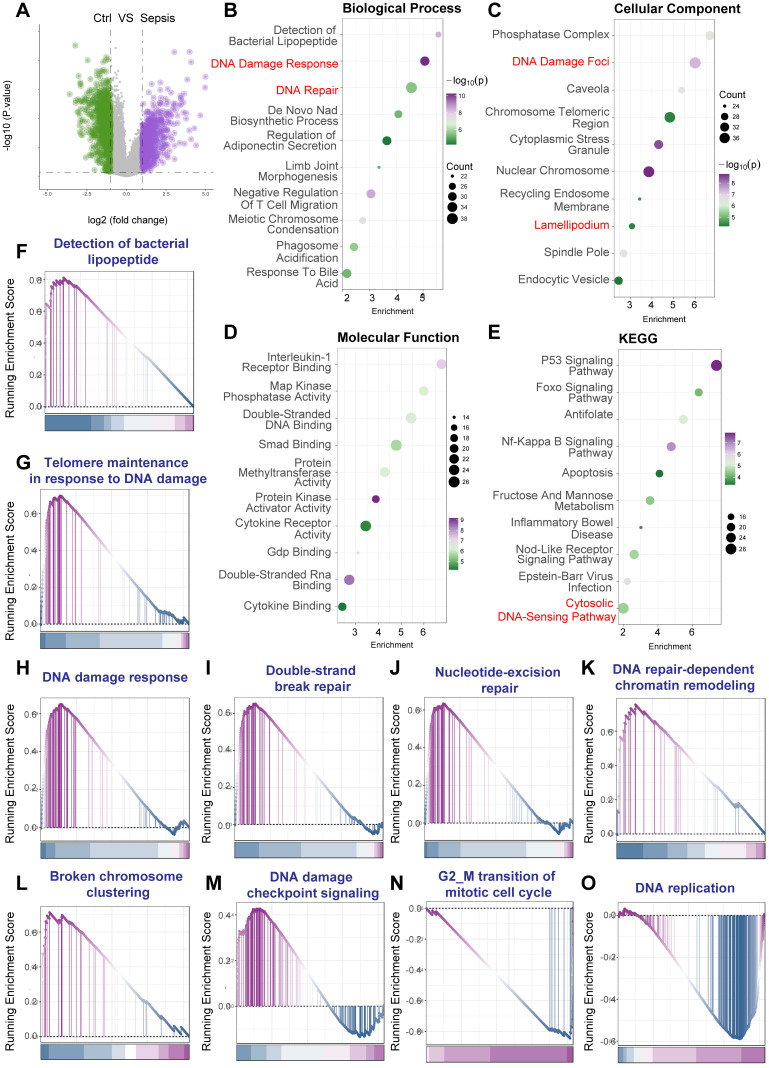
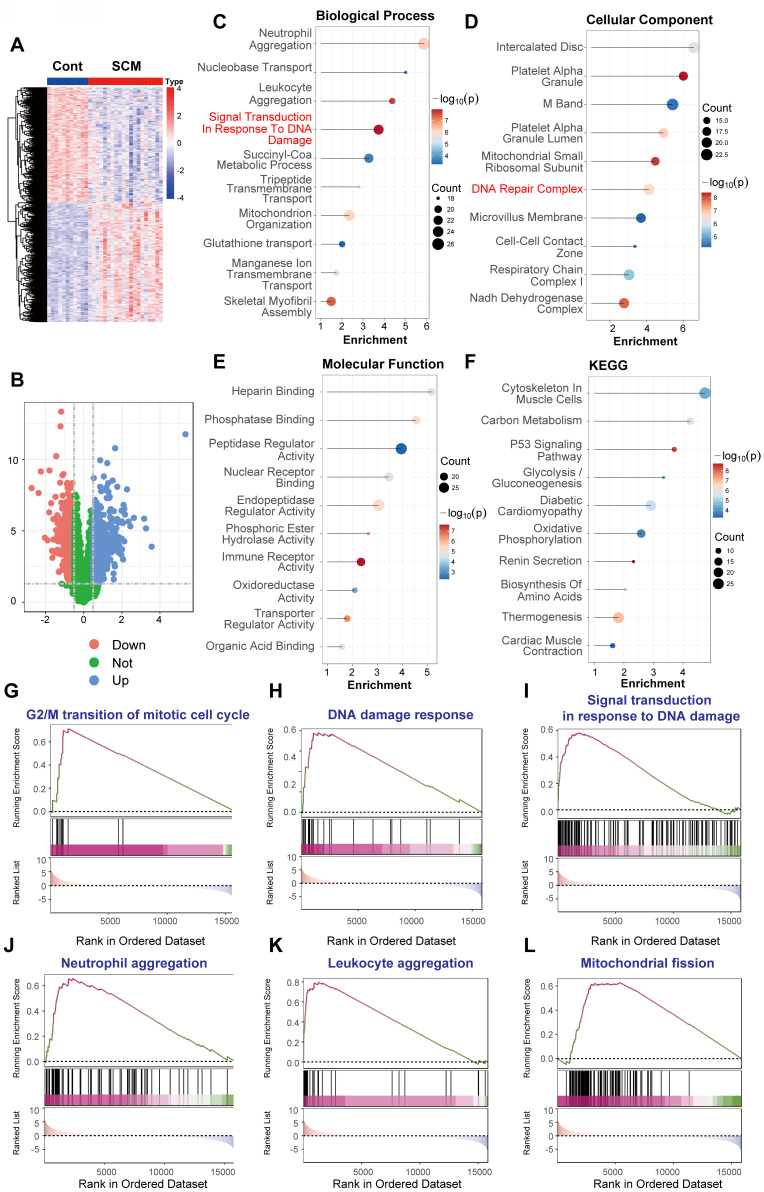
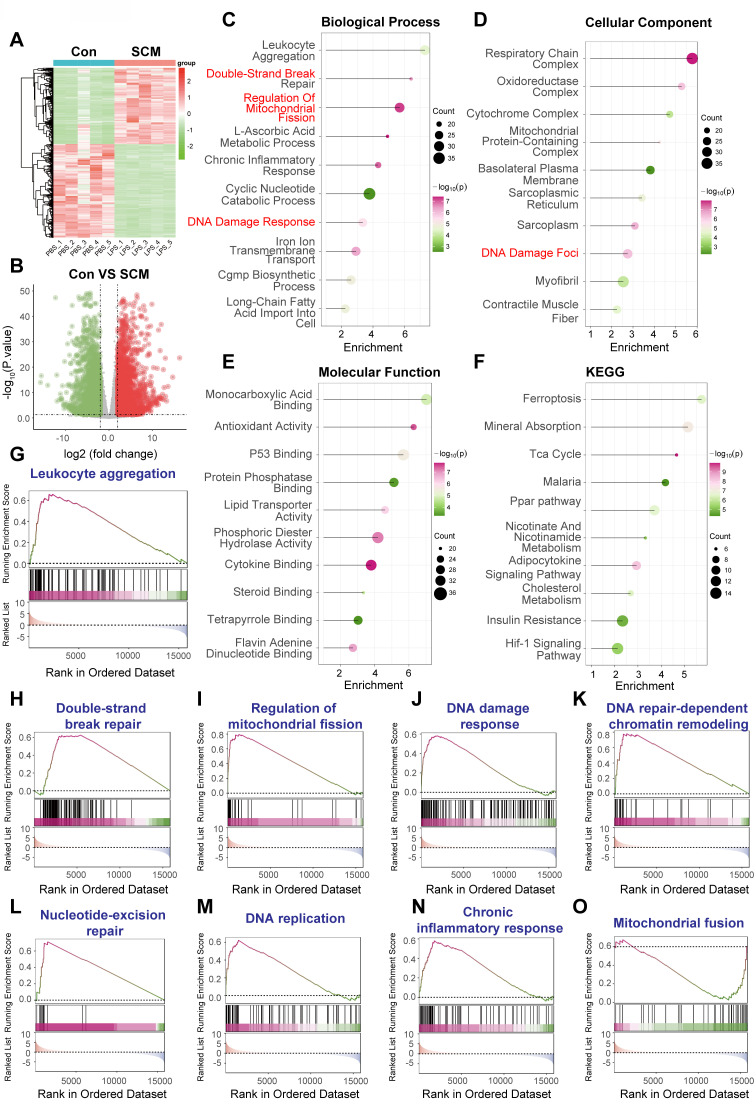
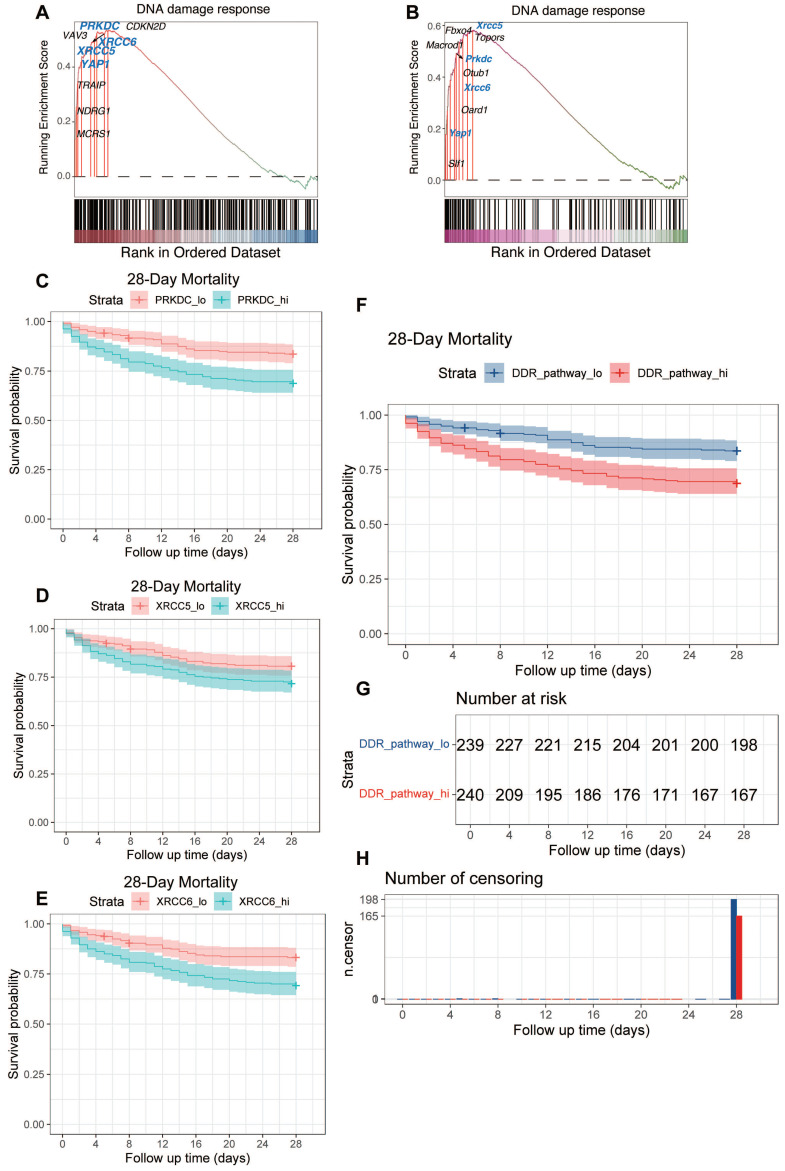
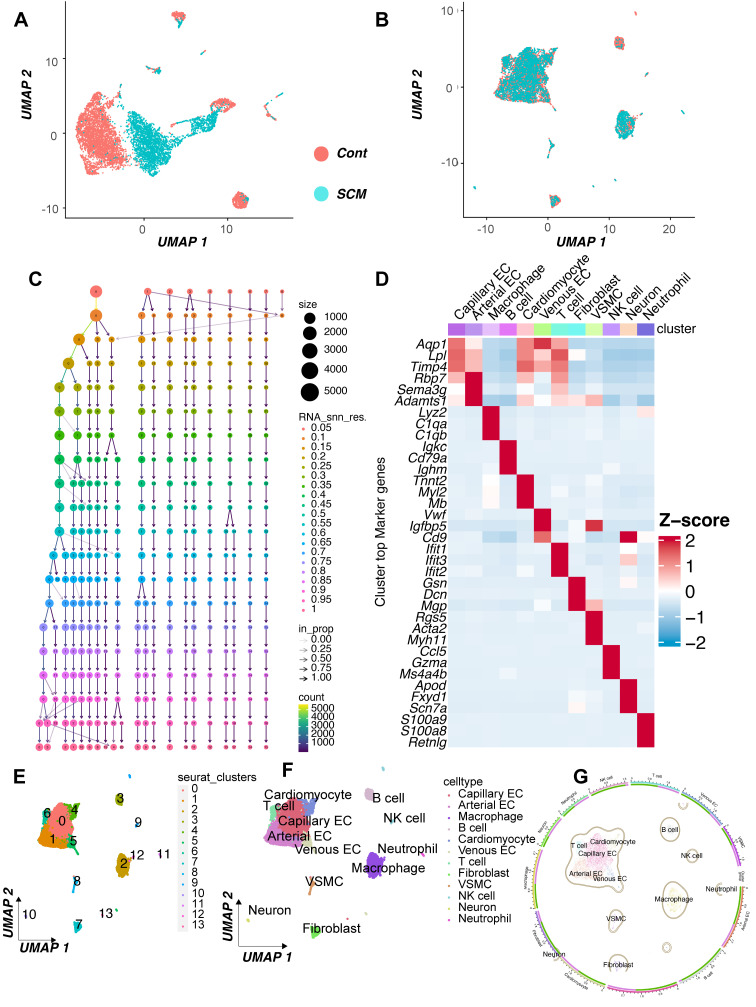
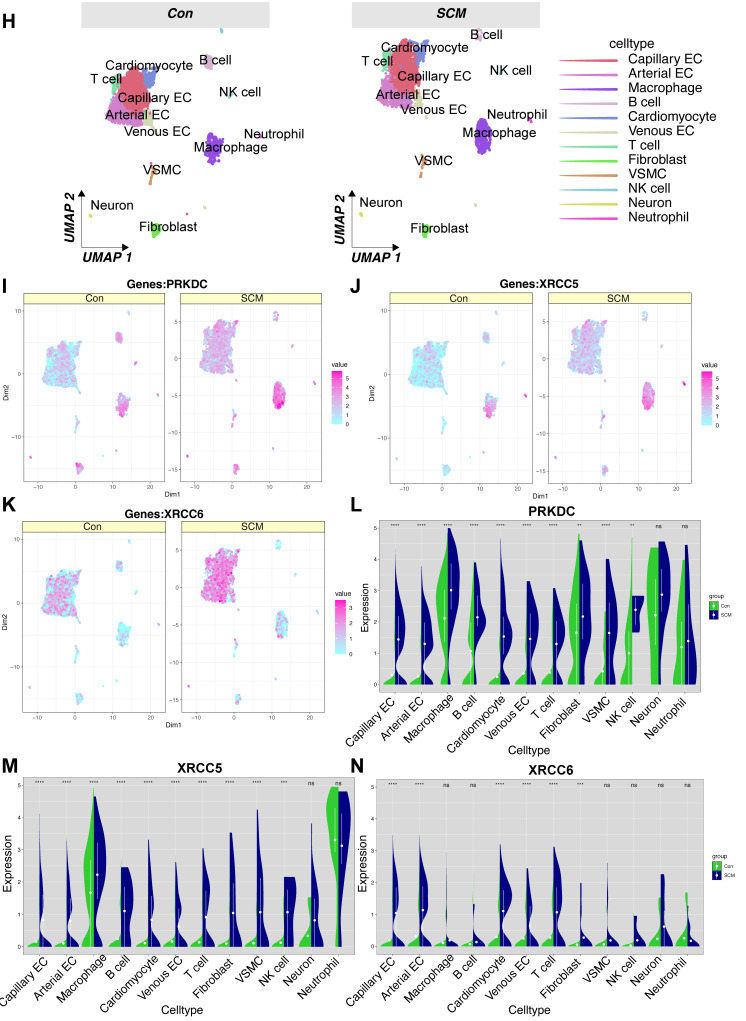
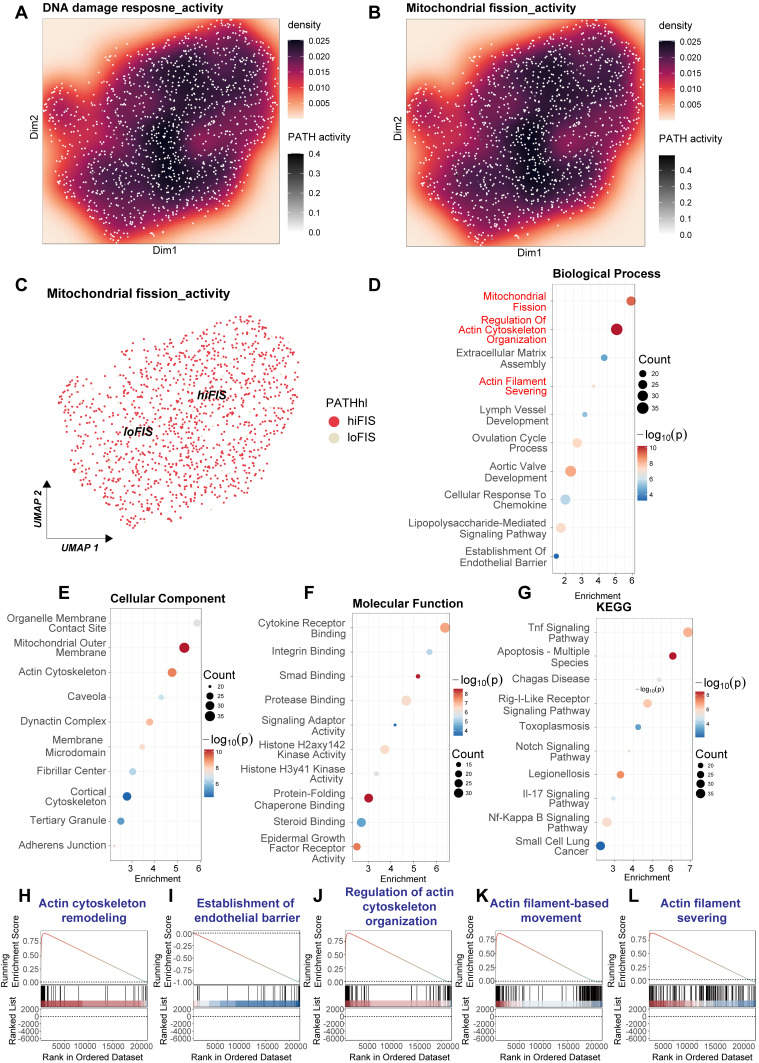
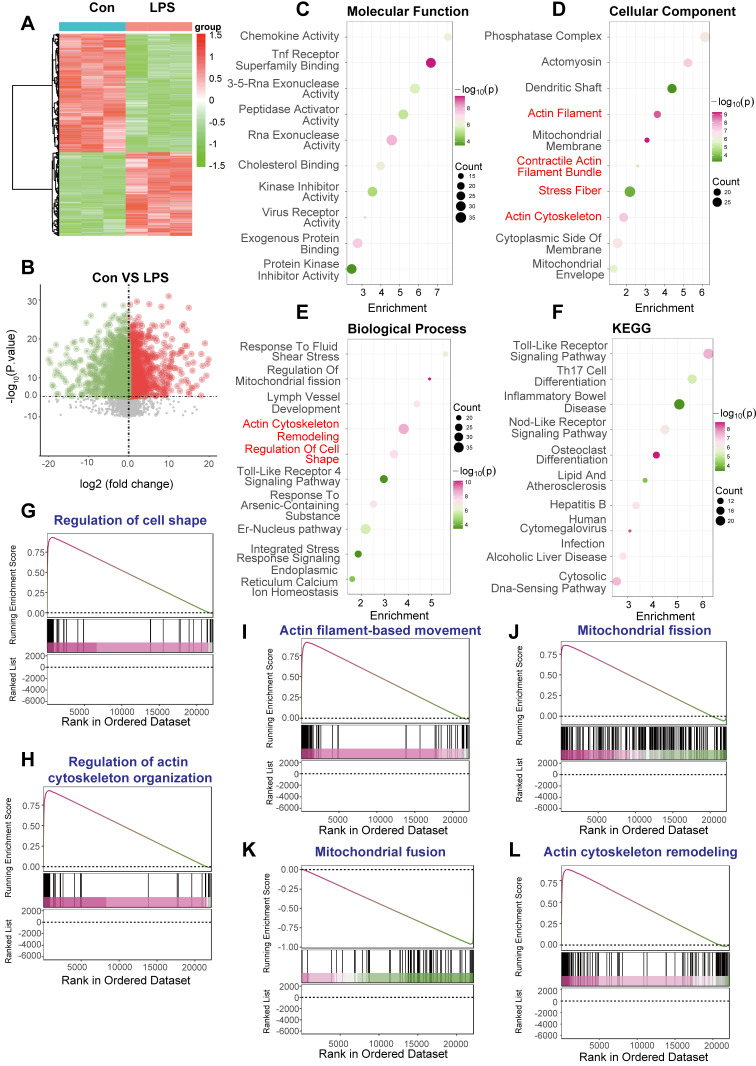
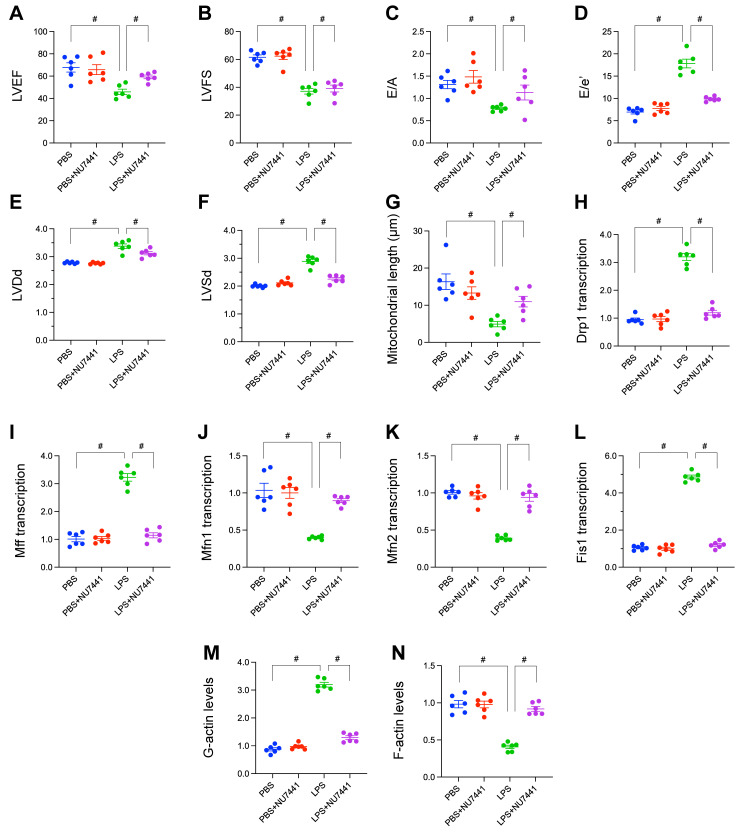
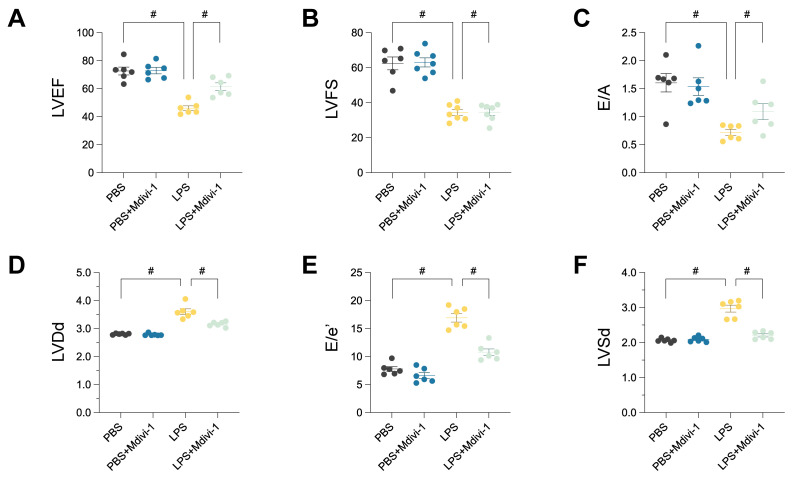
Rationale: Sepsis-induced cardiomyopathy is characterized by microvascular injury, which is linked to lipopolysaccharide (LPS)-induced DNA damage response (DDR). This study investigates the role of DNA-PKcs, a key enzyme in the DDR pathway, in driving actin disruption and microvascular dysfunction following LPS exposure. Methods: We analyzed diverse transcriptomic datasets from septic human and murine models using bioinformatics tools to assess DDR pathway activation, correlations, and prognosis. In vivo, LPS-challenged mice were treated with inhibitors of DNA-PKcs or mitochondrial fission, and we evaluated cardiac function, microvascular integrity, mitochondrial status, and actin polymerization. Results: Bioinformatic analyses consistently revealed significant activation of the DDR pathway and upregulation of key genes across diverse septic models. Notably, elevated DDR pathway activity was significantly correlated with poor 28-day survival in human sepsis patients. Single-cell analysis localized this DDR gene upregulation predominantly to cardiac endothelial cells (ECs), fibroblasts, and macrophages during sepsis. Within septic capillary ECs, DDR pathway activity scores strongly correlated spatially and functionally with heightened mitochondrial fission and cytoskeletal remodeling pathway activities. In vivo experiments confirmed that LPS induced severe systolic and diastolic dysfunction, microvascular damage, and mitochondrial fragmentation, as well as significant actin depolymerization. Inhibition of DNA-PKcs with NU7441 markedly attenuated all these LPS-induced pathologies, improving cardiac function, preserving microvascular structure, preventing mitochondrial fragmentation, and normalizing related gene expression and actin cytoskeleton stability. Additionally, inhibiting mitochondrial fission with Mdivi-1 significantly ameliorated LPS-induced cardiac dysfunction and microvascular injury. Conclusions: Our findings suggest that LPS triggers a DNA-PKcs-dependent DDR that promotes mitochondrial fragmentation and actin disruption, particularly in cardiac ECs, contributing to sepsis-induced cardiomyopathy. Targeting DNA-PKcs or mitochondrial fission may hold therapeutic potential for the treatment of sepsis-induced cardiomyopathy.

Keywords: DNA damage response; DNA-PKcs; actin; cytoskeleton; mitochondria.


Conflict of interest statement

Competing interests: The authors have declared that no competing interest exists.

Figures

Figure 1
Figure 1
LPS induces DNA damage response (DDR) activation in human CD14+ monocytes. RNA sequencing data from human CD14+ monocytes, pre-treated with IFNγ (100 U/mL) overnight and then stimulated with LPS (10 ng/mL) for 3 h, were analyzed (GSE262911 dataset, GSM8181391). Reads were aligned to the human genome (hg38) and quantified using STAR aligner against Gencode v38 annotations. (A) Heatmap of differentially expressed genes (DEGs) between control and LPS-treated monocytes. Color scale represents gene expression levels (red: upregulation, blue: downregulation). (B) Volcano plot of DEGs. Statistical significance is plotted against the magnitude of change. Significantly upregulated genes are in red, and downregulated genes are in blue. (C) Gene Ontology (GO) enrichment analysis of biological processes. Dot size represents gene count. Key terms related to DNA damage and repair are highlighted. (D) GO enrichment analysis of cellular components. Dot size and color as in (C). Locations relevant to DDR are emphasized. (E) GO enrichment analysis of molecular functions. Dot size and color as in (C). Activities related to DNA binding, repair, and enzymatic processes are highlighted. (F) KEGG pathway enrichment analysis. Dot size and color as in (C). Pathways related to inflammation, DNA damage, and disease are noted. (G-O) Gene Set Enrichment Analysis (GSEA) plots. Enrichment scores (ES) are plotted against the ranked gene list. The running ES is shown as a blue line; vertical black lines indicate gene positions within the gene set. Positive ES indicates upregulation in the LPS-treated group. Gene sets analyzed: (G) Nonhomologous end joining. (H) DNA damage checkpoint. (I) DNA damage response. (J) Double-strand break repair. (K) DNA repair. (L) Activation of immune response. (M) Nucleotide-excision repair. (N) DNA replication. (O) G2/M transition of mitotic cell cycle.
Figure 2
Figure 2
LPS-induced sepsis activates DNA damage response and inflammatory pathways in murine PBMCs. Bioinformatic analysis of RNA sequencing data from peripheral blood mononuclear cells (PBMCs) isolated from a murine model of LPS-induced sepsis. Data were generated using Illumina sequencing platforms. (A) Heatmap illustrating differentially expressed genes (DEGs) between control (Con) and LPS-treated mice PBMCs, showing distinct clustering based on treatment group. Color scale represents Z-score normalized expression levels (Red: higher expression, Blue: lower expression). (B) Volcano plot depicting the magnitude of gene expression change versus statistical significance. Red dots indicate significantly upregulated genes (n=1062); blue dots indicate significantly downregulated genes (n=479). Thresholds for significance were set at adjusted. (C-F) Functional enrichment analyses of DEGs. Dot size represents the number of genes enriched in the term/pathway; color intensity corresponds to the statistical significance. (C) Gene Ontology (GO) Biological Process enrichment, highlighting terms related to DNA damage response, DNA repair, and immune/inflammatory signaling. (D) GO Cellular Component enrichment, indicating involvement of structures like the DNA Repair Complex. (E) GO Molecular Function enrichment, showing enrichment of activities such as DNA Helicase Activity and Mismatch Repair Complex Binding. (F) Kyoto Encyclopedia of Genes and Genomes (KEGG) pathway enrichment analysis, revealing significant enrichment in inflammatory pathways and disease-related pathways. (G-S) Gene Set Enrichment Analysis (GSEA) plots for selected gene sets. The plots show the running enrichment score (ES, blue line) across the ranked list of genes. Vertical black lines indicate the positions of genes within the specific gene set. Positive ES indicates enrichment (upregulation) of the gene set in the LPS-treated group. Gene sets shown are relevant to inflammation, cell death, and various aspects of DNA damage response and repair.
Figure 3
Figure 3
Activation of DNA damage response pathways in peripheral blood mononuclear cells from human septic shock patients. Bioinformatic analysis of microarray gene expression data from peripheral blood mononuclear cells (PBMCs) comparing post-surgical patients diagnosed with septic shock (Sepsis) versus post-surgical patients with non-septic shock (Ctrl) (Homo sapiens; GEO accession: GSE131761). Gene expression was profiled using the Agilent Whole Human Genome Microarray platform (GPL13497). (A) Volcano plot illustrating differential gene expression between septic shock and non-septic shock PBMCs. (B-E) Functional enrichment analyses performed on the identified DEGs. Dot plots display significantly enriched terms for (B) Gene Ontology (GO) Biological Process (BP), (C) GO Cellular Component (CC), (D) GO Molecular Function (MF), and (E) Kyoto Encyclopedia of Genes and Genomes (KEGG) pathways. Within these plots, dot size typically corresponds to the number of genes associated with the term, and color intensity reflects the statistical significance. Key enriched terms highlighted include those related to DNA Damage Response, DNA Repair, DNA Damage Foci, Double-Stranded DNA Binding, p53 Signaling, and inflammatory pathways. (F-O) Gene Set Enrichment Analysis (GSEA) plots showing the enrichment profiles for selected gene sets when comparing septic shock versus non-septic shock PBMCs. The plots display the running Enrichment Score (ES) across the ranked gene list, with vertical lines indicating the positions of genes within the set. A positive ES indicates significant enrichment (upregulation) of the gene set in the septic shock group.
Figure 4
Figure 4
DNA damage response activation is evident in human septic cardiomyopathy heart tissue. Bioinformatic analysis of microarray gene expression data from human heart tissue comparing samples obtained from patients who died from sepsis (Septic Cardiomyopathy, SCM) versus non-failing donor hearts (Control, Cont). Expression profiling was performed using the Affymetrix Human Gene 1.0 ST Array platform (GPL6244). (A) Heatmap displaying differentially expressed genes (DEGs) between SCM and Cont heart tissue samples, illustrating distinct clustering based on group. Color scale represents Z-score normalized expression levels (Red: higher expression, Blue: lower expression). (B) Volcano plot visualizing gene expression changes against statistical significance. Red dots indicate significantly upregulated genes (n=459); blue dots indicate significantly downregulated genes (n=442). (C-F) Functional enrichment analyses performed on the DEGs identified in SCM hearts compared to controls. Dot size corresponds to the number of genes enriched in the term/pathway; color intensity reflects the statistical significance. (C) Gene Ontology (GO) Biological Process enrichment. (D) GO Cellular Component enrichment. (E) GO Molecular Function enrichment, indicating alterations in various binding and enzymatic activities. (F) Kyoto Encyclopedia of Genes and Genomes (KEGG) pathway enrichment. (G-L) Gene Set Enrichment Analysis (GSEA) plots for selected functionally relevant gene sets. The plots show the running enrichment score (ES, blue/purple line) across the ranked gene list, with vertical lines marking the positions of genes within the set. A positive ES indicates enrichment (upregulation) of the gene set in the SCM group.
Figure 5
Figure 5
DNA damage response activation in mouse hearts following LPS-induced septic cardiomyopathy. Bioinformatic analysis of RNA sequencing data obtained from heart tissue comparing C57BL/6 mice subjected to lipopolysaccharide (LPS)-induced sepsis (modeling Septic Cardiomyopathy, SCM; 10 mg/kg i.p. LPS for 12 h) versus vehicle-treated controls (Con; PBS). (A) Heatmap visualizing differentially expressed genes (DEGs) between SCM and Con mouse hearts, demonstrating distinct clustering based on treatment group. Color scale represents Z-score normalized expression levels (Red: higher expression, Blue: lower expression). (B) Volcano plot displaying gene expression changes against statistical significance. Red dots indicate significantly upregulated genes (n=1558); green dots indicate significantly downregulated genes (n=1909). (C-F) Functional enrichment analyses performed on the DEGs identified in SCM mouse hearts compared to controls. Dot size corresponds to the number of genes enriched in the term/pathway; color intensity reflects the statistical significance. (C) Gene Ontology (GO) Biological Process enrichment. (D) GO Cellular Component enrichment. (E) GO Molecular Function enrichment. (F) Kyoto Encyclopedia of Genes and Genomes (KEGG) pathway analysis. (G-O) Gene Set Enrichment Analysis (GSEA) plots for selected functionally relevant gene sets. The plots show the running enrichment score (ES, colored line) across the ranked gene list, with vertical lines marking the positions of genes within the set. A positive ES indicates enrichment (upregulation) of the gene set in the SCM (LPS-treated) group.
Figure 6
Figure 6
Conserved DNA damage response activation predicts poor prognosis in human sepsis. (A, B) Gene Set Enrichment Analysis (GSEA) plots illustrating the enrichment of the "DNA damage response" pathway in (A) human septic cardiomyopathy heart tissue (GSE79962) and (B) murine LPS-induced septic heart tissue (GSE267388). Key conserved upregulated genes identified within the leading-edge subset, including YAP1, PRKDC, XRCC5, and XRCC6, are highlighted, indicating cross-species relevance. (C-E) Prognostic significance analysis using the GSE65682 dataset, comprising whole blood transcriptomic data from human sepsis patients upon ICU admission linked to 28-day survival outcomes. Kaplan-Meier curves comparing 28-day survival between patients with high versus low expression levels of (C) PRKDC, (D) XRCC5, and (E) XRCC6. P-values were determined by log-rank test. (F-H) Patients were stratified into 'High' and 'Low' groups based on the median expression level or pathway activity score. (F) Kaplan-Meier curve comparing 28-day survival between patients with high versus low DNA Damage Response (DDR) pathway activity scores, calculated using single-sample GSEA (ssGSEA). P-value was determined by log-rank test. (G) Table showing the number of patients at risk over the 28-day follow-up period for the high and low DDR pathway activity groups depicted in panel F. (H) Bar chart comparing the absolute number of surviving patients at day 28 between the High-DDR and Low-DDR activity groups.
Figure 7
Figure 7
Single-cell RNA sequencing analysis reveals cell-type specific upregulation of DDR genes in murine septic hearts. Single-cell transcriptomic analysis of heart tissue isolated from control mice (Con) and mice 3 days post cecal ligation and puncture (CLP)-induced sepsis (SCM). (A, B) Uniform Manifold Approximation and Projection (UMAP) visualization of integrated single-cell transcriptomes, colored by experimental condition (e.g., A: Merged Con and SCM; B: Split view or alternative projection). (C, D) Identification of distinct cell clusters based on canonical marker gene expression, shown via (C) dot plot indicating the percentage of cells expressing marker genes (dot size) and average expression level (color intensity) per cluster, and (D) heatmap displaying scaled expression of top marker genes across clusters. (E, F) UMAP visualization colored by assigned cell type identity, identifying major cardiac populations including Cardiomyocytes (CM), Endothelial Cells (EC - Arterial, Capillary, Venous subtypes), Fibroblasts, Vascular Smooth Muscle Cells (VSMCs), Neurons, and various Immune cells (Macrophages, T cells, NK cells, Neutrophils). (G) Graphical summary shows the relative proportions of the identified cell types in the analyzed heart tissue. (H) UMAP visualizations split by experimental condition (Con vs. SCM), colored by cell type, facilitating comparison of cell population distributions and potential state changes induced by sepsis. (I-K) Feature plots overlaid on the UMAP demonstrating the expression levels and spatial distribution across cells for key DNA Damage Response (DDR) genes. Color intensity corresponds to the normalized expression level. (L-N) Violin plots comparing the expression distribution of DDR genes between SCM (e.g., purple violins) and Con (e.g., green violins) groups within major identified cell types: (L) Prkdc, (M) Xrcc5, and (N) Xrcc6. Height and width of violins represent density of cells at different expression levels.
Figure 7
Figure 7
Single-cell RNA sequencing analysis reveals cell-type specific upregulation of DDR genes in murine septic hearts. Single-cell transcriptomic analysis of heart tissue isolated from control mice (Con) and mice 3 days post cecal ligation and puncture (CLP)-induced sepsis (SCM). (A, B) Uniform Manifold Approximation and Projection (UMAP) visualization of integrated single-cell transcriptomes, colored by experimental condition (e.g., A: Merged Con and SCM; B: Split view or alternative projection). (C, D) Identification of distinct cell clusters based on canonical marker gene expression, shown via (C) dot plot indicating the percentage of cells expressing marker genes (dot size) and average expression level (color intensity) per cluster, and (D) heatmap displaying scaled expression of top marker genes across clusters. (E, F) UMAP visualization colored by assigned cell type identity, identifying major cardiac populations including Cardiomyocytes (CM), Endothelial Cells (EC - Arterial, Capillary, Venous subtypes), Fibroblasts, Vascular Smooth Muscle Cells (VSMCs), Neurons, and various Immune cells (Macrophages, T cells, NK cells, Neutrophils). (G) Graphical summary shows the relative proportions of the identified cell types in the analyzed heart tissue. (H) UMAP visualizations split by experimental condition (Con vs. SCM), colored by cell type, facilitating comparison of cell population distributions and potential state changes induced by sepsis. (I-K) Feature plots overlaid on the UMAP demonstrating the expression levels and spatial distribution across cells for key DNA Damage Response (DDR) genes. Color intensity corresponds to the normalized expression level. (L-N) Violin plots comparing the expression distribution of DDR genes between SCM (e.g., purple violins) and Con (e.g., green violins) groups within major identified cell types: (L) Prkdc, (M) Xrcc5, and (N) Xrcc6. Height and width of violins represent density of cells at different expression levels.
Figure 8
Figure 8
Transcriptomic analysis reveals activation of mitochondrial fission and cytoskeleton remodeling pathways in LPS-stimulated HUVECs. Bioinformatic analysis of microarray data derived from the GSE27912 dataset. This dataset profiled transcriptomes of Human Umbilical Vein Endothelial Cells (HUVECs) stimulated with lipopolysaccharide (LPS; 100 ng/mL for 4 h) compared to untreated control cells, using the Affymetrix Human Gene 1.0 ST Array platform. (A, B) Visualization of estimated pathway activity scores across samples, mapped onto dimension reduction coordinates (Dim1/Dim2). Density plots represent calculated activity for (A) DNA damage response and (B) Mitochondrial fission pathways. Color intensity correlates with pathway activity level. (C) UMAP projection potentially stratifying samples based on calculated mitochondrial fission activity scores (e.g., distinguishing high-fission [hiFIS] from low-fission [loFIS] samples). (D-G) Functional enrichment analysis performed on genes differentially expressed between LPS-treated and control HUVECs. Dot plots show significantly enriched terms for: (D) Gene Ontology (GO) Biological Process, highlighting terms related to mitochondrial fission, actin cytoskeleton organization, and endothelial barrier function. (E) GO Cellular Component, indicating involvement of mitochondrial membranes and cytoskeletal structures. (F) GO Molecular Function. (G) Kyoto Encyclopedia of Genes and Genomes (KEGG) pathways, confirming enrichment of inflammatory signaling pathways. In these plots, dot color typically represents the p-value, and dot size reflects the number of differentially expressed genes associated with the term. (H-L) Gene Set Enrichment Analysis (GSEA) plots illustrating the enrichment profiles for specific gene sets comparing LPS-treated versus control HUVECs. The plots show the running enrichment score (ES) across the ranked list of genes.
Figure 9
Figure 9
Transcriptomic signatures link mitochondrial fission and cytoskeletal remodeling pathways in septic mouse hearts. Bioinformatic analysis comparing gene expression profiles from whole heart tissue of mice subjected to CLP-induced sepsis (Day 3, labeled LPS) versus control mice (Con). (A) Heatmap displaying differentially expressed genes (DEGs) between the LPS and Con samples, illustrating distinct clustering patterns according to experimental condition. The color scale represents Z-score normalized expression levels. (B) Volcano plot visualizing differential gene expression. Red and green dots denote significantly upregulated and downregulated genes, respectively, in the LPS group compared to the Con group. (C-F) Functional enrichment analyses performed on the identified DEGs. (G-L) Gene Set Enrichment Analysis (GSEA) plots comparing the LPS versus Con groups for specific pathways. The plots display the running enrichment score (ES) across the ranked list of genes.
Figure 10
Figure 10
Inhibition of DNA damage response ameliorates LPS-induced cardiomyopathy, mitochondrial fission, microvascular injury, and cytoskeletal disruption. In vivo validation experiments using a murine model of LPS-induced sepsis, comparing PBS (Control), PBS + NU7441 (DNA-PKcs inhibitor control), LPS, and LPS + NU7441 treatment groups. (A-F) Echocardiographic assessment of cardiac function. Quantification of (A) Left Ventricular Ejection Fraction (LVEF, %), (B) Left Ventricular Fractional Shortening (LVFS, %), (C) E/A ratio, (D) E/e' ratio, (E) Left Ventricular End-Diastolic Dimension (LVDd, mm), and (F) Left Ventricular End-Systolic Dimension (LVSd, mm). (G) Representative micrographs of Hematoxylin and Eosin (HE) stained cardiac tissue sections, illustrating microvascular morphology in the different treatment groups. Scale bar = 75 µm. (H) Quantification of average mitochondrial length (µm) derived from transmission electron microscopy images of cardiomyocytes. (I-L) Relative mRNA expression levels of mitochondrial dynamics regulators quantified by qRT-PCR: (J) Drp1, (K) Mff, (L) Mfn1, (M) Mfn2, and (N) Fis1. (M-N) Quantification of relative levels of (M) globular actin (G-actin) and (N) filamentous actin (F-actin). Data are presented as mean ± SD. #P < 0.05.
Figure 11
Figure 11
Pharmacological inhibition of mitochondrial fission mitigates LPS-induced cardiac dysfunction and microvascular injury. In vivo validation experiments using a murine model of LPS-induced sepsis, comparing PBS (Control), PBS + Mdivi-1 (mitochondrial fission inhibitor control), LPS, and LPS + Mdivi-1 treatment groups. (A-F) Echocardiographic assessment of cardiac function. Quantification of (A) Left Ventricular Ejection Fraction (LVEF, %), (B) Left Ventricular Fractional Shortening (LVFS, %), (C) E/A ratio, (D) Left Ventricular End-Diastolic Dimension (LVDd, mm), (E) E/e' ratio, and (F) Left Ventricular End-Systolic Dimension (LVSd, mm). #P < 0.05.

Similar articles

References

    1. Qiao W, Huang Y, Bian Z, Sun X, Wang X, Gao Q. et al. Lipopolysaccharide-induced DNA damage response activates nuclear factor κB signalling pathway via GATA4 in dental pulp cells. Int Endod J. 2019;52:1704–15. - PubMed
    1. Goodwin JF, Knudsen KE. Beyond DNA repair: DNA-PK function in cancer. Cancer Discov. 2014;4:1126–39. - PMC - PubMed
    1. Yue X, Bai C, Xie D, Ma T, Zhou P-K. DNA-PKcs: A multi-faceted player in DNA damage response. Front Genet. 2020. 11. - PMC - PubMed
    1. Burma S, Chen DJ. Role of DNA-PK in the cellular response to DNA double-strand breaks. DNA Repair (Amst) 2004;3:909–18. - PubMed
    1. Nastasi C, Mannarino L, D'Incalci M. DNA damage response and immune defense. Int J Mol Sci. 2020;21:7504. - PMC - PubMed

MeSH terms

Substances

LinkOut - more resources