Review
. 2025 Apr 21;15(12):5616-5665.
doi: 10.7150/thno.112204. eCollection 2025.

Inorganic and hybrid nanomaterials for NIR-II fluorescence imaging-guided therapy of Glioblastoma and perspectives

Affiliations
Review

Inorganic and hybrid nanomaterials for NIR-II fluorescence imaging-guided therapy of Glioblastoma and perspectives

Zhigang Li et al. Theranostics. .

Abstract

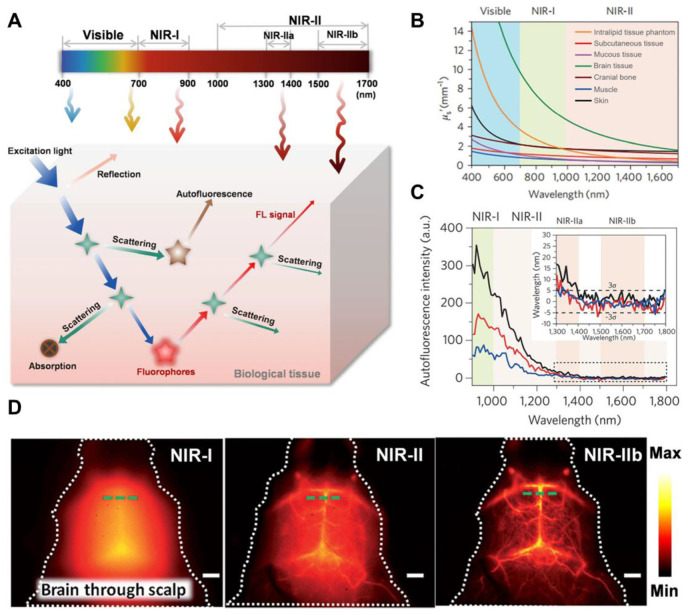
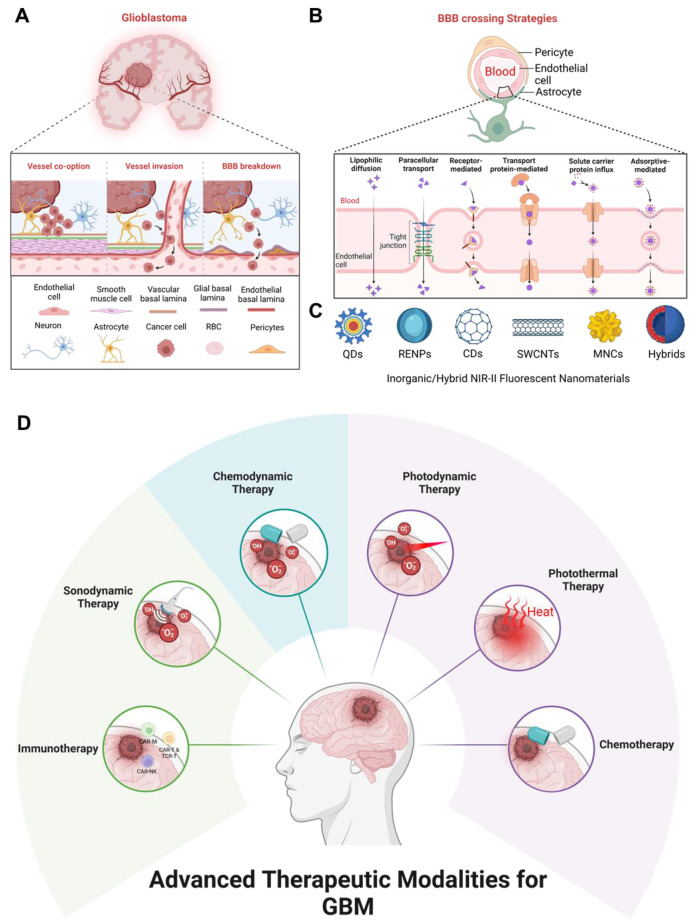
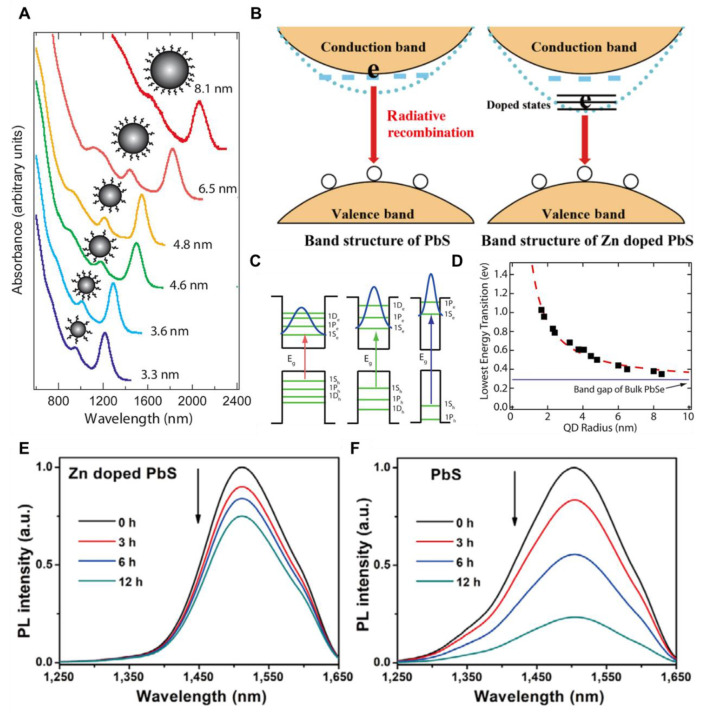
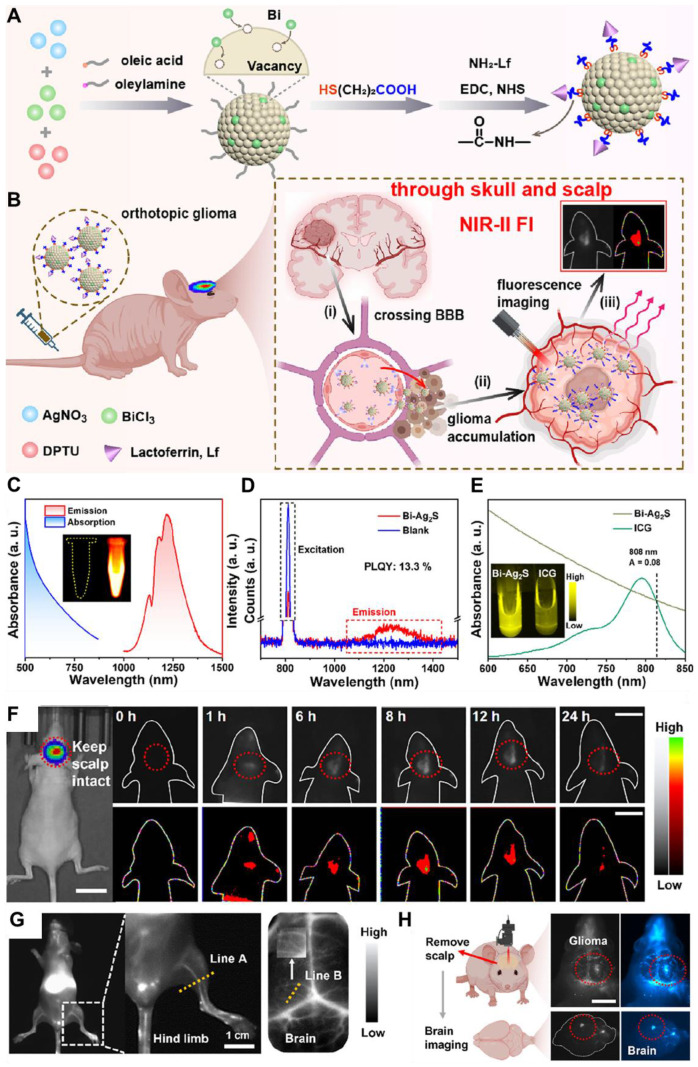
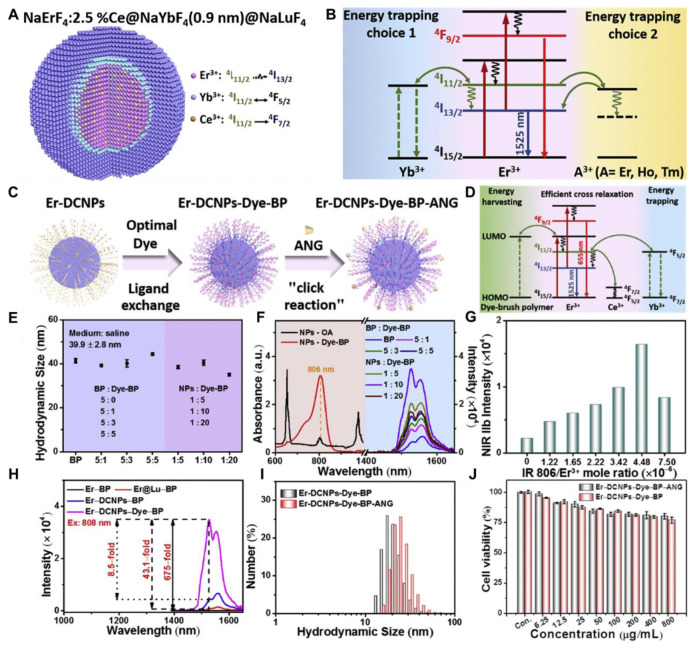
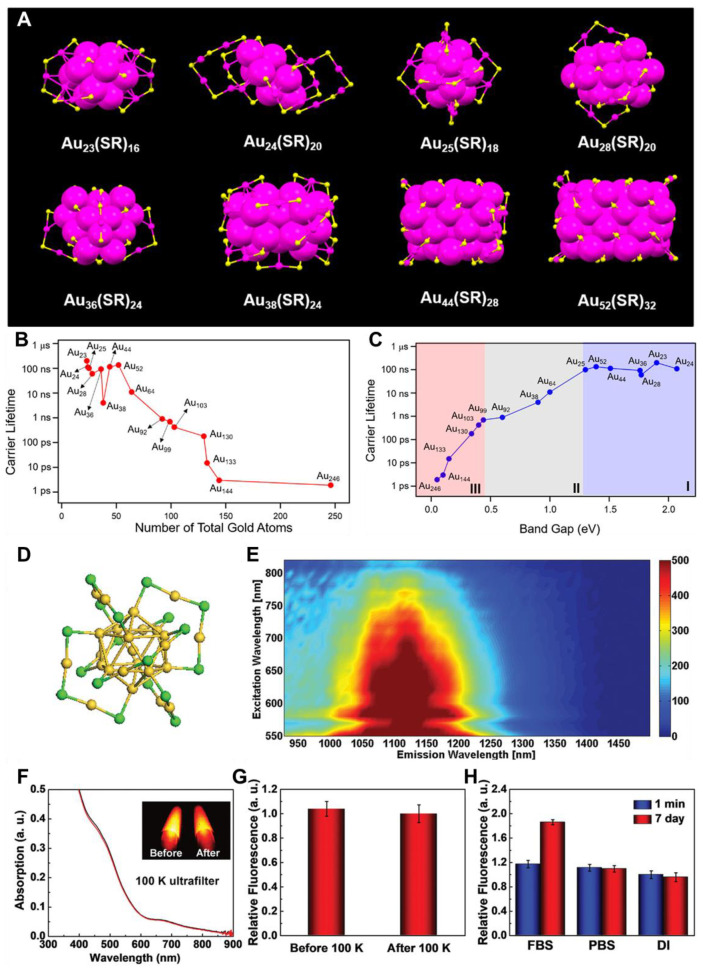
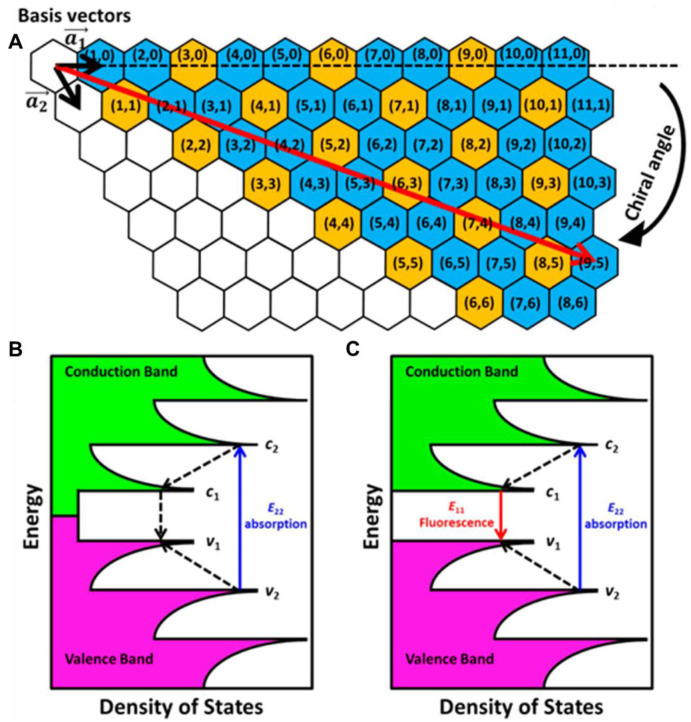
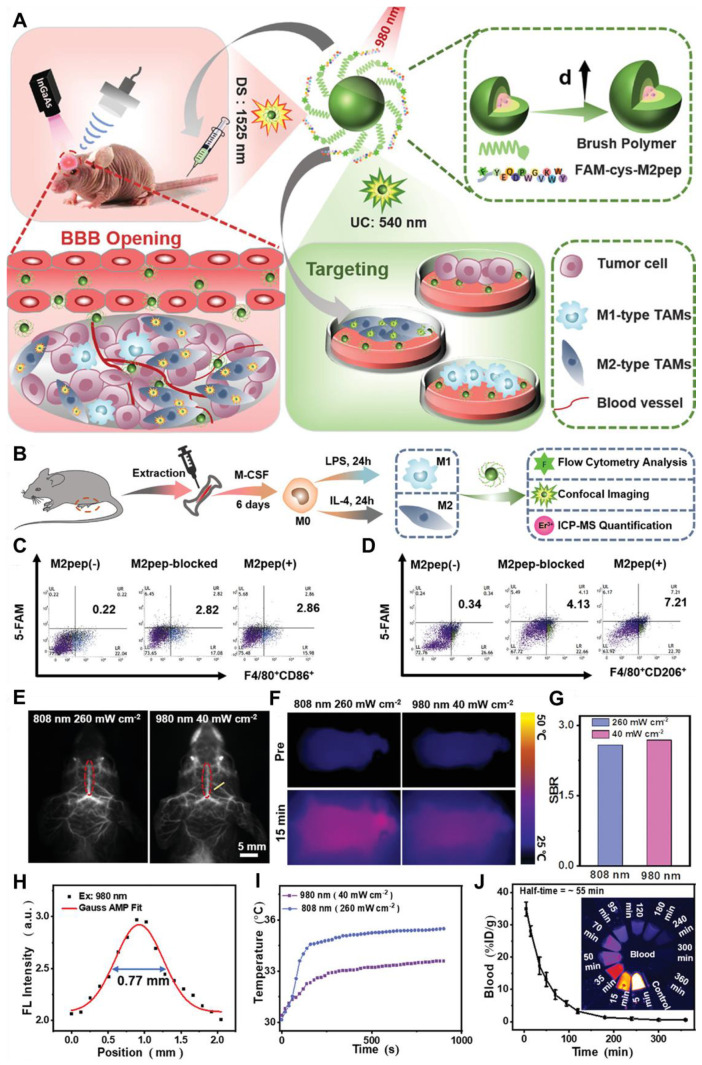
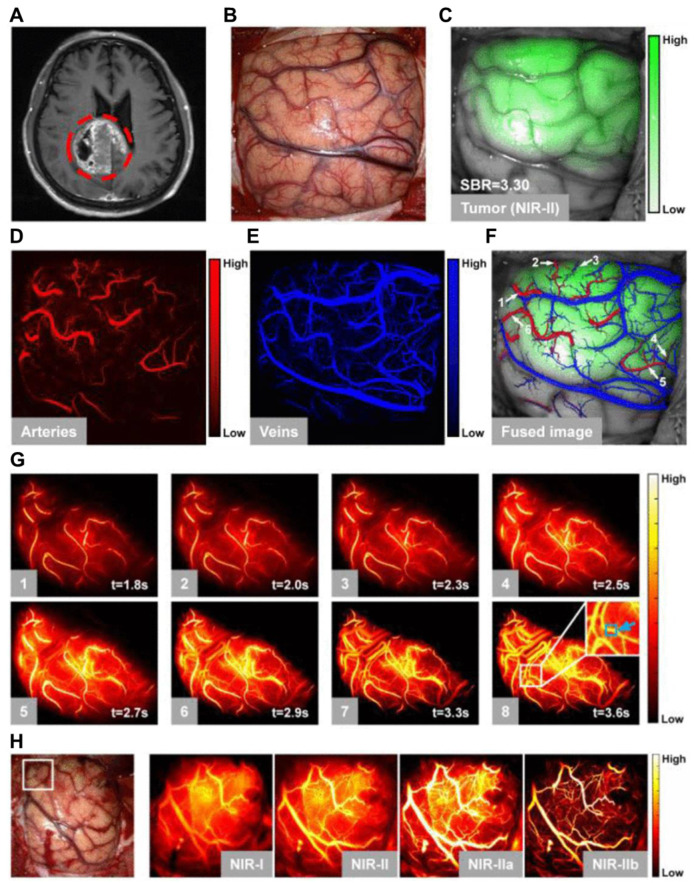
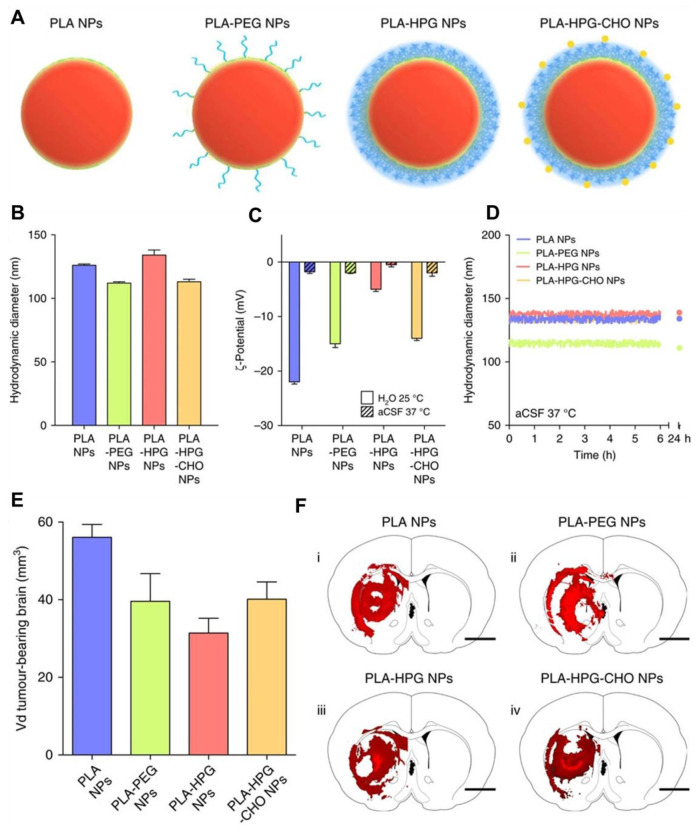
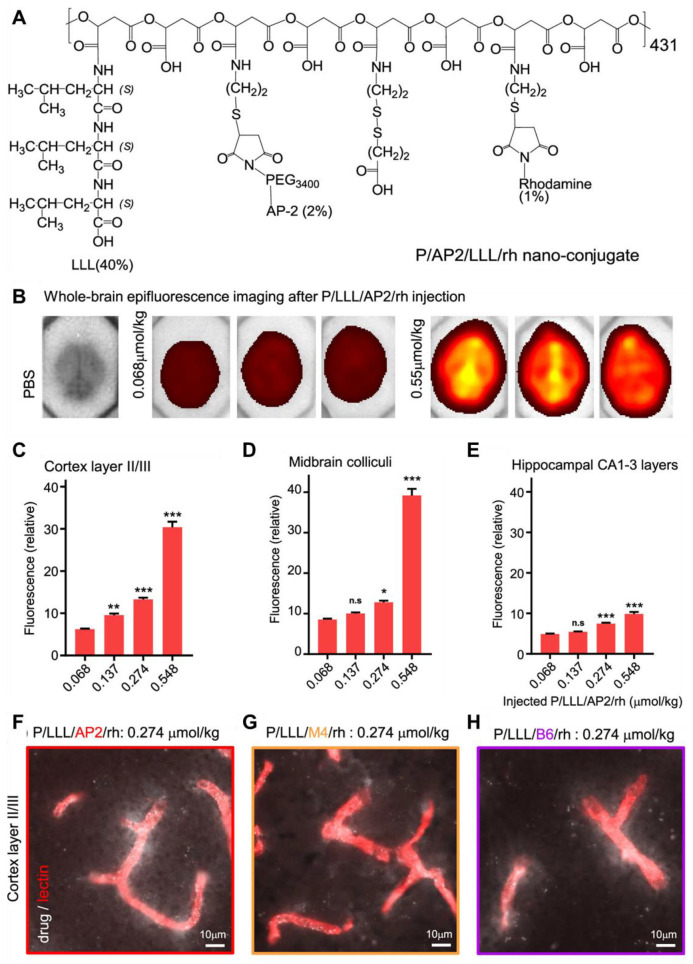
Glioblastoma (GBM) is the most invasive and lethal brain tumor, with limited therapeutic options due to its highly infiltrative nature, resistance to conventional therapies, and blood-brain barriers. Recent advancements in near-infrared II (NIR-II) fluorescence imaging have facilitated greater tissue penetration, improved resolution, and real-time visualization of GBM, providing a promising approach for precise diagnosis and treatment. The inorganic and hybrid NIR-II fluorescent materials have developed rapidly for NIR-II fluorescence imaging-guided diagnosis and therapy of many diseases, including GBM. Herein, we offer a timely update to explore the contribution of inorganic/hybrid NIR-II fluorescent nanomaterials, such as quantum dots, rare-earth-doped nanoparticles, carbon-based nanomaterials, and metal nanoclusters in imaging-guided treatment for GBM. These nanomaterials provide high photostability, strong fluorescence intensity, and tunable optical properties, allowing for multimodal imaging and enhanced therapeutic efficacy. Additionally, their integration with modern therapeutic strategies, such as photothermal therapy, chemodynamic therapy, photodynamic therapy, sonodynamic therapy, and immunotherapy, has shown significant potential in overcoming the limitations of traditional treatments. Looking forward, future advancements including safe body clearance, long-term biocompatibility, efficient BBB penetration, and extended emission wavelengths beyond 1500 nm could enhance the theranostic outcomes. The integration of dual imaging with immunotherapy and AI-driven strategies will further enhance precision and accelerate the clinical translation of smart theranostic platforms for GBM treatment.

Keywords: Glioblastoma; NIR-II fluorescence imaging; imaging-guided therapy; inorganic and hybrid nanomaterials; targeting.


Conflict of interest statement

Competing Interests: The authors have declared that no competing interest exists.

Figures

Figure 1
Figure 1
(A) The comparison of the interaction of light with body tissues from visible to NIR-IIb range. Adopted with permission from , Copyrights 2024 ACS PUBLICATIONS. (B) Demonstration of lower scattering coefficients in various tissues across the 400-1700 nm range. (C) Ex vivo autofluorescence spectra of different body organs of mice like liver (black), spleen (red), and heart tissue (blue) upon 808 nm irradiation demonstrating almost zero autofluorescence in the NIR-IIb range. Adopted with permission from , Copyrights 2017 NATURE. (D) Cerebrovascular Fluorescence imaging of mice demonstrating the resolution comparison among NIR-I, NIR-II, and NIR-IIb (Scale bars: 2mm). Adopted with permission from , Copyrights 2015 WILEY.
Scheme 1
Scheme 1
Schematic illustration of: (A) Physiopathology of GBM (B) BBB crossing strategies for GBM. (C) Inorganic/hybrid NIR-II fluorescent materials for the treatment of GBM. (D) Advanced therapeutic modalities for imaging-guided therapy of GBM.
Figure 2
Figure 2
(A) Graphical representation of normal functioning of Notch signaling pathway and its importance in controlling cellular and developmental processes. (B) Schematic illustration of Hedgehog pathway: The left side demonstrates inactivation of the HH signaling pathway without HH ligand. The right side demonstrates the active HH signaling pathway after binding with the HH ligand. (C) Schematic representation of WNT pathway: The left side demonstrates WNT pathway deactivation in the absence of WNT ligands. The right side demonstrates activation of the WNT signaling pathway when the WNT ligand binds to the FZD receptor. Adopted with permission from , Copyrights 2022 ELSEVIER.
Figure 3
Figure 3
(A) Size-dependent absorption spectra of QDs demonstrating quantum confined 1st exciton-mediated absorption shift. (B) Demonstration of composition-dependent change in the bandgap of the QDs. (C) Demonstration of discrete transitions representing the discrete exciton transitions. (D) Representation of increased quantum confinement of the 1st exciton by decreasing the size of the particle. (E-F) FL spectra of the QDs after exposure to air at 80 °C, representing the composition-dependent FL stability of the QDs. (B), (E), and (F) are adopted with permission from , Copyrights 2020 SPRINGER NATURE. (A), (C), and (D) are reused under Creative Commons Attribution License .
Figure 4
Figure 4
Schematic demonstration of (A) Lactoferrin functionalized Bi-Doped Ag2S NCs and their (B) application in NIR-II imaging of orthotopic glioma. (C) Absorption and FL spectra of the NCs in chloroform and the inset showing the FL image captured via a near-infrared camera upon 808 nm laser excitation and 100 ms exposure time with LP1000 filter. (D) Measurement of the absolute Φ of the NCs in chloroform. (E) Absorption spectra and NIR-II imaging comparison of the NCs in chloroform and ICG in DMSO under 808 nm laser excitation. (F) NIR-II imaging of orthotopic glioma-bearing mice following the injection of sample NCs upon 200 ms exposure time with LP1000 filter. (G) NIR-II imaging of hind-limb and cerebral blood vessels following i.v. administration of sample NCs (scale bar: 1 cm). (H) Schematic representation of FL images of the exposed brain and ex vivo brain tissue 24 hours post-injection upon 400 ms exposure time with LP1000 filter (scale bar: 0.5 cm). Adopted with permission from , Copyrights 2024 ACS PUBLICATIONS.
Figure 5
Figure 5
(A) Graphical representation of core-shell structured RENPs for NIR-II FL imaging. (B) The demonstration of the energy diagram of the nanoparticle representing the upconversion (655 nm) and downconversion (1525 nm) process upon 808 nm light irradiation. (C) Graphical representation of the synthetic mechanism of brush polymer-based-dye conjugated angiopep-2 functionalized RENPs. (D) The energy diagram demonstrates the transfer of energy transfer between dye and Er3+ ions and photon changeover among the Er3+, Ce3+, and Yb3+ causing 1525 nm FL. (E) The size of the RENPs depends on the amount of brush polymer and dye. (F) Composition-dependent absorption and NIR-IIb emission spectra of the RENPs upon 808 nm light irradiation. (G) The amounts of dye and Er3+ ion-dependent NIR-IIb FL intensity of the RENPs. (H) The NIR-IIb FL spectra of different compositions of RENPs. (I) The angiopep-2 dependent hydrodynamic size variations of RENPs. (J) Demonstration of angiopep-2 dependent biocompatibility of the RENPs for U87 cells after 24 hours of incubation. Adopted with permission from , Copyrights 2020 ELSEVIER.
Figure 6
Figure 6
(A) Schematic illustration of crystal geometry of Aun(SR)m nanoclusters. Color coding: magenta for Au and yellow for S. (B and C) Graphical representation of carrier lifetime vs no. of Au atoms and carrier lifetime vs bandgap for -S- protected Au nanoclusters. (D) The representation of the crystal geometry of Au25 nanocluster as core functionalized with 18 Sulfur atoms. (E) FL vs excitation spectra of Au nanoclusters demonstrating emission at 1120 nm. (F) UV-vis absorption and NIR-II FL imaging comparison for Au nanoclusters in water upon 808 nm excitation at power of 25 mW cm-2 pre- and post-filtration with the ultrafiltration tube of 100 K. (G) NIR-II FL intensity demonstration for Au nanoclusters pre- and post-filtration with the ultrafiltration tube of 100 K. (H) Demonstration of stability of Au nanoclusters in water, PBS, and FBS solutions in different time frames. Adopted with permission from , Copyrights 2019 ACS PUBLICATIONS. Adopted with permission from , Copyrights 2019 WILEY.
Figure 7
Figure 7
Schematic illustration of physical and electronic band constructions of SWCNTs for NIR-II FL imaging. (A) The hexagonal honeycomb-like assembly of graphene demonstrating various roll-up vectors resulted in different indices and chiralities. (B) The bandgap structure of metallic carbon nanotubes exhibits no FL emission because of the continuous DOS near Fermi levels. (C) The bandgap structure of semiconducting carbon nanotubes exhibits fluorescence emission upon excitation. Adopted with permission from , Copyrights 2015 ACS PUBLICATIONS.
Figure 8
Figure 8
(A) Schematic representation of both top-down and bottom-up methodologies for the preparations of NIR-II CDs. (B) Schematic representation of the synthetic scheme of the sample: (i) hydrogen bonding mediated synthesis of APBA macromolecules; (ii) macromolecules deposition into the sample. (C) UV-vis and NIR absorption spectra of the sample. (D) The FL of the sample in the NIR-II range when irradiated with an 808 nm light. The inset demonstrates the optical and NIR-II FL images of the CDs in water. (E) NIR-II FL imaging of nude mice demonstrating high magnifications images of the brain blood vessels at different time frames after injecting PBS and sample. Adopted with permission from , Copyrights 2024 ACS PUBLICATIONS. Adopted with permission from , Copyrights 2019 ELSEVIER.
Figure 9
Figure 9
(A) Graphical representation of in situ bone regeneration visualization via NIR-II in vivo FL imaging by employing ErBG@IR808 NIR-II fluorescent scaffolds. (B) Demonstration of absorption spectra of different concentrations of IR808 and Er nanoparticles in chloroform. (C and D) Demonstration of change NIR-II FL imaging and FL spectra of ErBG@IR808 NIR-II fluorescent scaffold concerning the presence of HClO upon 808 and 980 nm light irradiation. (E) Schematic representation of NIR-II FL mediated monitoring of skull bone inflammation. (F) ErBG@IR808 NIR-II fluorescent scaffold implant guided NIR-II FL images of mice skull bone defects upon 808 and 980 nm laser irradiation (Scale bar: 2 mm). Adopted with permission from , Copyrights 2022 ACS PUBLICATIONS.
Figure 10
Figure 10
(A) Schematic illustration of the targeted brain tumor visualization by employing Gd-Ag2S NIR-II fluorescent nanoprobe. (B) Absorption and emission spectra of Gd-Ag2S NIR-II fluorescent nanoprobe (Insets represent the optical and FL images upon visible and 808 nm laser irradiation, respectively). (C) T1 relaxivity graph of the nanoprobe representing the MRI efficiency of the probe (the inset represents the T1 mapping of an MR imaging of the Gd-Ag2S NIR-II fluorescent nanoprobe at different molarity). (D) NIR-II FL imaging-guided surgery of U87MG tumor-bearing mice (Scale bar = 2.5 mm). (E) H&E-stained of the surgically removed tumor tissue representing the tumor margins. (F) Flow cytometric graphs of the residual tumor tissues representing the tumor removal efficiency of the surgical process. Adopted with permission from , Copyrights 2015 WILEY.
Figure 11
Figure 11
(A) A pictorial illustration of the synthetic methodology of the sample nanocapsules. (B) Graphical illustration of therapeutic and diagnostic mechanisms of the sample nanocapsules. (C) The distribution of Gd content within the body after the i.v. injection of different samples at different time frames. (D) Demonstration of in vivo NIR-II FL imaging of the intracranial glioma within the mice treated with prepared samples upon 808 nm laser illumination at designed time frames. (E) The measured FL intensity of different samples after injection at various time frames. (F) Representation of ex vivo NIR-II FL images of the major body organs and tumors at 8 hours of injection with different samples. (G) Demonstration of histological comparison of GBM-bearing mice when subjected to different treatments indicated. (H) The respective H&E-staining of the GBM slices of different groups after different treatments. Adopted with permission from , Copyrights 2022 ELSEVIER.
Figure 12
Figure 12
(A) Schematic demonstration of the synthetic scheme of the sample. (B) Schematic representation NIR-II FL imaging-guided PTT precisely inducing the pyroptosis activation. (C) Representation of photothermal curves of the sample at different concentrations upon 808 nm light illumination. (D) Comparison of the photothermal ability of the sample with ICG upon 808 nm light illumination. (E) Comparison of photothermal cycling curves of the sample with ICG for demonstration of the photothermal ability of the sample. (F) Schematic demonstration of NIR-II FL imaging of the mice bearing orthotopic U87MG. (G) NIR-II FL imaging of orthotopic brain tumor-bearing mice at different time frames by using functionalized and unfunctionalized samples. (H) Demonstration of relative FL intensity of the orthotopic brain tumor areas at suggested time frames for validating the targeting. (I) NIR-II FL imaging of the mice skull with comparison to the bioluminescence imaging. Adopted with permission from , Copyrights 2025 WILEY.
Figure 13
Figure 13
(A) Graphical illustration of the synthetic process, diagnosing ability, and treatment mechanism of YMIGL. (B) Representation of downconversion FL spectra of different samples upon 808 nm light irradiation with 0.4 W/cm2 in simulated TME. (C) Representation of ESR spectra of different samples to confirm the ROS production upon 808 nm light irradiation. (D) Cytotoxicity of the sample incubated with L929, C6 cell lines upon 808 nm laser excitation with 1 W/cm2 power for 7 minutes time duration. (E) The demonstration of variation in tumor volume after sample administration and therapy. (F) Schematic illustration of treatment and monitoring cycle plan. (G) Demonstration of change in body weight after sample administration and therapy. (H) NIR-II FL imaging of orthotopic glioma-bearing mice when injected with the sample 24 hours after injection. Adopted with permission from , Copyrights 2022 ACS PUBLICATIONS.
Figure 14
Figure 14
(A) Schematic demonstration of synthetic process of the sample and activatable NIR-II FL imaging-guided CDT and PTT combinatory therapy. (B) Demonstration of chemodynamic behavior of the sample in the presence of H2O2 and TMB with and without laser irradiation. (C) The demonstration of the photothermal behavior of the sample via FL spectra with and without laser irradiation. (D) Demonstration of ROS production efficiency of the sample in the presence of H2O2 and DMPO with and without laser irradiation. (E) Schematic representation of H2O2 activatable NIR-II FL imaging of the sample in tumor-bearing mice. (F) Schematic representation of treatment plan of the tumor-bearing mice after sample injection. (G) In vivo NIR-II FL imaging of the tumor-bearing mice after injection of the sample nanoparticles. (H) Demonstration of thermal imaging of the tumor area within the tumor-bearing mice after sample injection under 808 nm laser excitation having 1.0 W cm-2 power for 10 min. (I) Demonstration of treatment efficiency of the applied therapy by ex vivo tumor images of the tumor-bearing mice. Adopted with permission from , Copyrights 2024 WILEY.
Figure 15
Figure 15
(A) Schematic illustration of multimodal imaging-guided TME self-enhanced SDT of GBM. (B) Demonstration of NIR-II FL spectra of the sample in H2O and simulated TME. (C) Demonstration of 1O2 generation detection in various conditions by ESR. (D) Cytotoxicity profile of the sample with different cell lines at different concentrations. (E) NIR-II FL imaging of orthotopic glioma-bearing mice after the tail vein injection of different samples, scale bar: 5 mm. (F) Demonstration of treatment and monitoring plan for tumor-bearing mice. (G) Demonstration of change in the tumor volume after treatment (n = 3). Adopted with permission from , Copyrights 2022 NATURE.
Figure 16
Figure 16
(A) Schematic representation of NIR-IIb FL imaging-guided targeting of M2 TAMs for in vitro and in vivo immunotherapy of orthotopic GBM. (B) Schematic representation of isolation, maturation, and polarization of the macrophages. (C and D) Demonstration of flow cytometry results of M1 and M2 macrophages when incubated with different nanoprobes with the help of F4/80+CD86+. (E) NIR-II FL images of brain vessels of normal mice after i.v. injection of the sample nanoparticles upon 808 nm and 980 nm laser excitation respectively. (F) Representation of infrared thermal pictures of nude mice upon 808 nm and 980 nm laser excitation for 15 minutes. (G) Demonstration of SBR of the NIR-IIb FL images of brain vessels. (H) Measurement of vessel width via NIR-II FL imaging. (I) Monitoring of temperature variation in the sample upon light irradiation. (J) Calculation of blood circulation half-life of the sample via NIR-II FL intensity of the sample (mean ± SD, n = 3). Adopted with permission from , Copyrights 2022 WILEY.
Figure 17
Figure 17
(A) MRI-based identification of the brain tumor; the red circle indicates a tumor lesion in the right parietal. (B) Visible light imaging of brain vasculature. (C) NIR-II FL imaging of the tumor site with an SBR of 3.30. (D) NIR-IIb FL imaging of the blood supplying arteries. (E) NIR-IIb FL imaging of venial system after injecting ICG. (F) Fused imaging-based demonstration of tumors, arteries, and veins. White arrows indicated the blood-suppling arteries of the tumor. (G) Demonstration of real-time NIR-II FL imaging-based blood flow visualization of a female patient. (H) Comparison of multispectral FL images of the cerebral vessels demonstrating the superior penetration ability of NIR-IIb FL imaging. Reused under Creative Commons Attribution License .
Figure 18
Figure 18
(A) Graphical representation of PLA-based nanoparticles with various surface coatings (PEG, HPG, and HPG-CHO). (B) Demonstration of size analysis of the nanoparticles coated with different coatings dispersed in water. (C) Measurement of zeta potential in water at 25 °C and in artificial cerebrospinal fluid at 37 °C demonstrated surface neutralization of the particles in artificial cerebrospinal fluid. (D) Demonstration of particle stabilization in CSF at 37 °C up to 24 hours without aggregation. (E) Nanoparticle distribution study in RG2 tumor-bearing mice. (F) Distribution pattern of the nanoparticles in tumor-bearing brains representing the effect of coating in BBB penetration. Adopted with permission from , Copyrights 2017 NATURE.
Figure 19
Figure 19
(A) Chemical composition of the sample nanoconjugate for BBB penetration. (B) Whole brain epifluorescence imaging by injecting different concentrations (PBS, 0.068, and 0.55 µmol/kg) of sample to demonstrate the concentration-dependent BBB penetration of the probe. (C-D) The average FL intensity of the nanoconjugate in the brain parenchyma was measured by injecting four different drug concentrations in μmol/kg. FL imaging exhibiting rh-labeled nanoconjugate penetration of the BBB by P/LLL/rh combined to AP2 (F), M4 (G), and B6 (H). Adopted with permission from , Copyrights 2019 ACS PUBLICATIONS.
Figure 20
Figure 20
(A, B) Demonstration of FL spectra of the sample solution upon 808 and 980 nm laser irradiation. (C) Absorption spectra of aqueous solution of Nd3+ and Yb3+. (D) Schematic representation of energy transfer mechanisms and FL emission of the sample beyond 1500 nm upon NIR laser excitation. Adopted with permission from , Copyrights 2023 WILEY.
Figure 21
Figure 21
Schematic representation of the biocompatible self-assembly cuproptosis booster for synergistic cancer immunotherapy. Adopted with permission from , Copyrights 2024 ELSEVIER.
Figure 22
Figure 22
Demonstration of CycleGAN-based NIR-IIa to NIR-IIb image translation. (A) Comparison of NIR-IIa and NIR-IIb images in mice injected with p-FE and QDs upon 808-nm laser excitation (1000-nm long-pass and 1200-nm short-pass filters for NIR-IIa image, while 1500-nm long-pass filter for NIR-IIb image). (B) Cross-sectional intensity profiles of the images in both the NIR-IIa and NIR-IIb windows. (C) Demonstration of CycleGAN model training process. A random NIR-IIa image was processed by generator GA to create an NIR-IIb image, which was then input to generator GB to reconstruct the original NIR-IIa image. A discriminator DB distinguished real from generated NIR-IIb images, with the overall loss being a weighted sum of adversarial and cycle consistency losses to ensure accurate image translation. (D) In vivo FL imaging of mice injected with p-FE and QDs, where the NIR-IIa image was processed by generator GA to produce a contrast-enhanced image (Scale bar = 5 mm). Reused under Creative Commons Attribution License .

Similar articles

References

    1. Claus EB, Walsh KM, Wiencke JK, Molinaro AM, Wiemels JL, Schildkraut JM. et al. Survival and low-grade glioma: the emergence of genetic information. Neurosurg Focus. 2015;38:E6. - PMC - PubMed
    1. Ostrom QT, Cioffi G, Waite K, Kruchko C, Barnholtz-Sloan JS. CBTRUS statistical report: primary brain and other central nervous system tumors diagnosed in the United States in 2014-2018. Neuro Oncol. 2021;23:1–105. - PMC - PubMed
    1. Kim H, Lim KY, Park JW, Kang J, Won JK, Lee K. et al. Sporadic and lynch syndrome-associated mismatch repair-deficient brain tumors. Lab Invest. 2022;102:160–71. - PMC - PubMed
    1. Michaeli O, Tabori U. Pediatric high grade gliomas in the context of cancer predisposition syndromes. J Korean Neurosurg Soc. 2018;61:319–32. - PMC - PubMed
    1. Ceglie G, Del Baldo G, Agolini E, Rinelli M, Cacchione A, Del Bufalo F. et al. Cancer predisposition syndromes associated with pediatric high-grade gliomas. Front Pediatr. 2020;8:561487. - PMC - PubMed