. 2025 Apr 21;15(12):5738-5755.
doi: 10.7150/thno.102752. eCollection 2025.

Investigating post-infection anxiety- and depression-like behaviors in a SARS-CoV-2 mouse model

Affiliations

Investigating post-infection anxiety- and depression-like behaviors in a SARS-CoV-2 mouse model

Qian Ge et al. Theranostics. .

Abstract

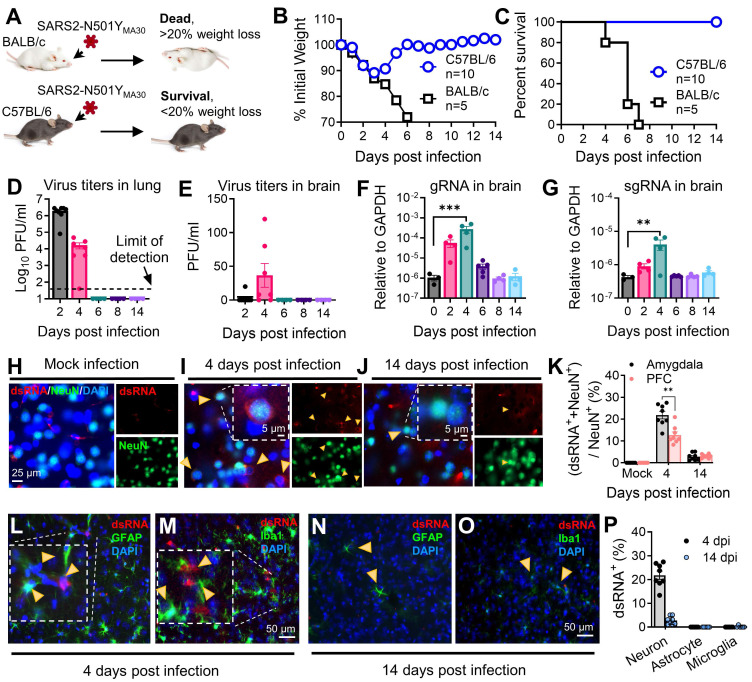
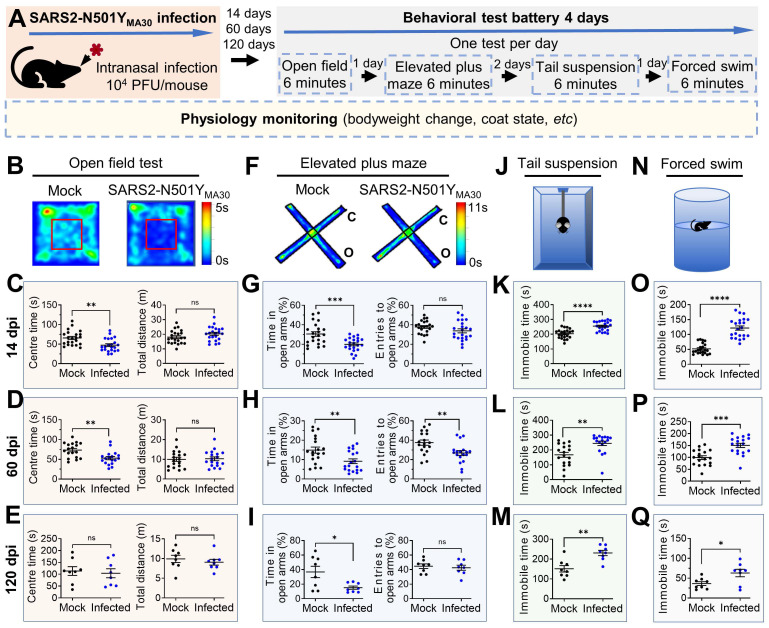
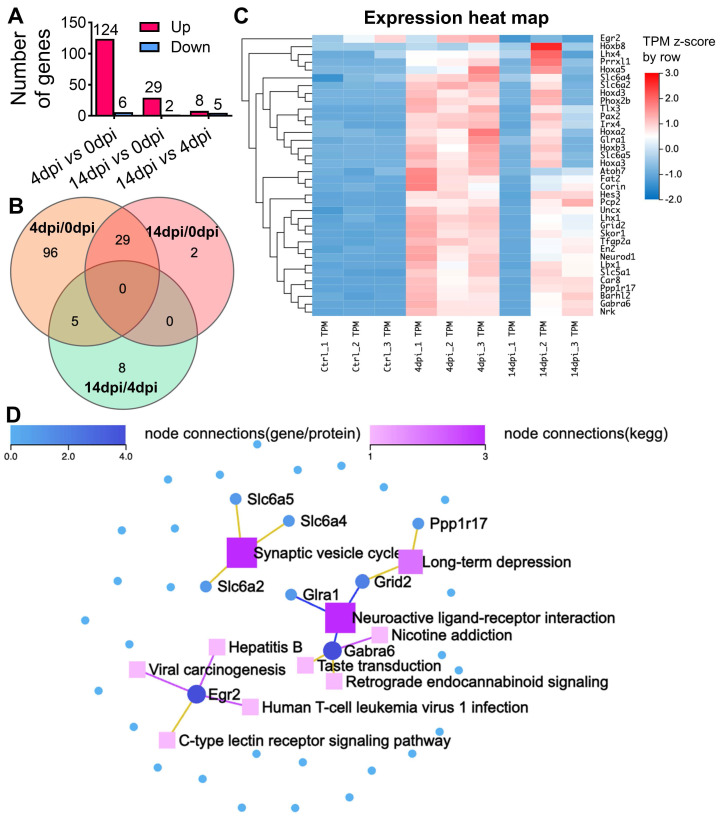
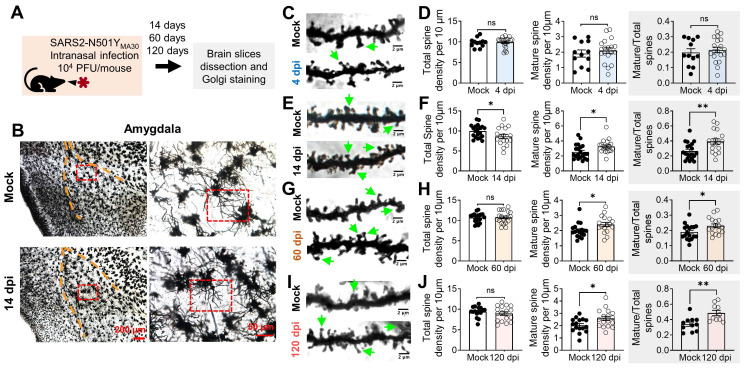
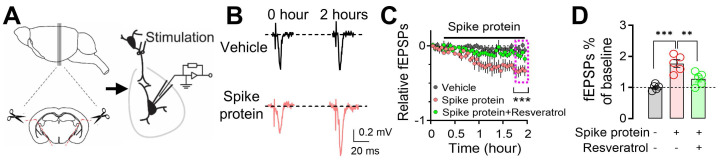
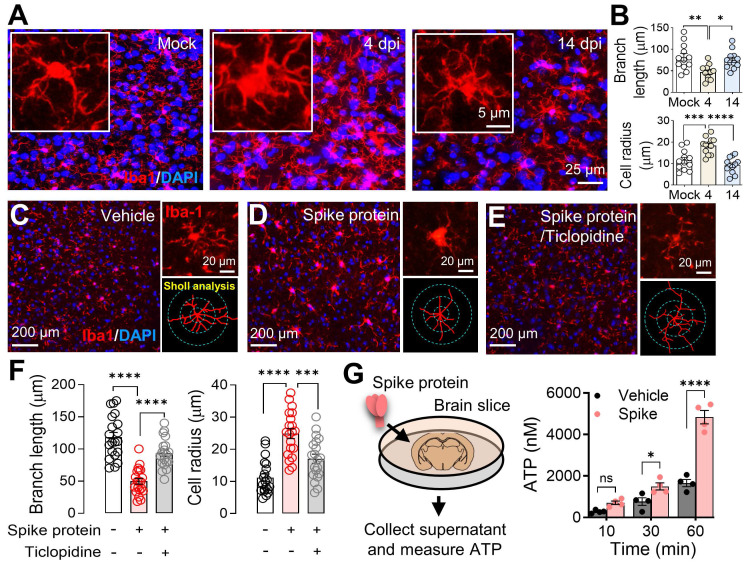
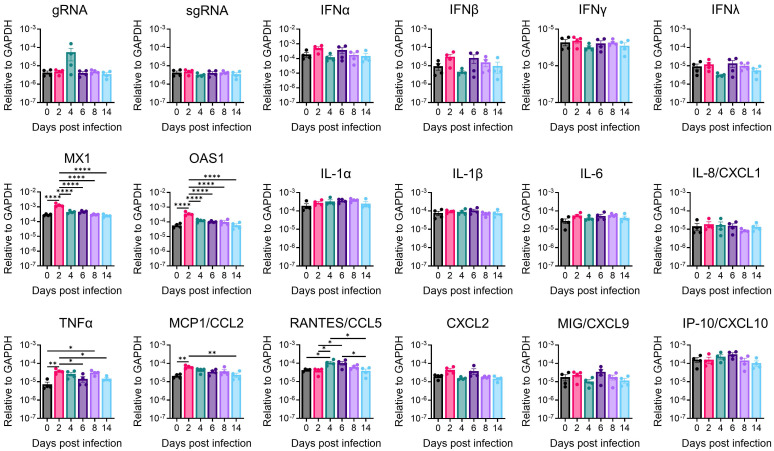
Rationale: The COVID-19 pandemic, driven by SARS-CoV-2, has resulted in a wide range of neuropsychiatric symptoms associated with post-acute sequelae (PASC). However, the mechanisms by which SARS-CoV-2 impacts the brain and leads to persistent behavioral changes remain poorly understood. We hypothesize that SARS-CoV-2 exposure induces neuroinflammation and microglial activation, leading to anxiety- and depression-like behaviors in mice. Methods: We established a SARS-CoV-2 mouse model using the virulent SARS2-N501YMA30 strain to investigate its impact on the central nervous system (CNS). We assessed neuroinvasion via immunostaining of dsRNA and markers for neuronal, astrocyte, and microglia in brain slices. Behavioral changes were evaluated at 2 weeks, 2 months, and 4 months post-infection. Molecular and cellular analyses included bulk RNA-seq, Golgi-Cox staining, field excitatory postsynaptic potential (fEPSP) recordings, immunofluorescence, and quantitative real-time PCR (qRT-PCR) to assess gene expression, neuronal morphology, and microglial activation in the brain. Results: We demonstrated that intranasal inoculation of SARS2-N501YMA30 results in viral dissemination to multiple brain regions, including the amygdala and the prefrontal cortex (PFC). Behavioral assays indicated a marked elevation in anxiety- and depression-like behaviors post-infection. A comparative analysis of RNA expression profiles disclosed alterations in the post-infected brains. Additionally, we observed dendritic spine remodeling on neurons within the amygdala after infection. Infection with SARS2-N501YMA30 was associated with microglial activation and a subsequent increase in microglia-dependent neuronal activity in the amygdala. Transcriptomic analysis of infected brains revealed the upregulation of inflammatory and cytokine-related pathways, implicating neuroinflammation in the pathogenesis of neuronal hyperactivity and behavioral abnormality. Conclusion: Our findings provide evidence that SARS-CoV-2 neuroinvasion plays a critical role in the development of lasting behavioral sequelae observed in PASC. These data provide critical insights into the neurological consequences of SARS-CoV-2 infection and underscore microglia as a potential therapeutic target for ameliorating virus-induced neurobehavioral abnormalities.

Keywords: Amygdala; Anxiety- and depression-like behaviors.; Microglia; Post-acute sequelae of COVID-19; SARS-CoV-2.


Conflict of interest statement

Competing Interests: The authors have declared that no competing interest exists.

Figures

Figure 1
Figure 1
Outcomes of intranasal infection with SARS2-N501YMA30. (A) Schematic depicting the outcomes of infection in young BALB/c and C57BL/6 mice following administration of 104 PFU of SARS2-N501YMA30. (B-C) Daily monitoring of body weight (B) and survival (C) in young BALB/c and C57BL/6 mice post-infection. (D-E) Virus titers in the lungs (D) and brains (E) of C57BL/6 mice infected with SARS2-N501YMA30 at the indicated dpi. (F-G) Viral genomic RNA (gRNA) (F) and subgenomic RNA (sgRNA) (G) levels in brain tissues from SARS2-N501YMA30 infected C57BL/6 mice. The levels of viral gRNA and sgRNA were normalized to GAPDH and presented as 2^-ΔCT (n=4 or 5 mice per group). CT values for viral gRNA or sgRNA from mock-infected tissues were consistently greater than 35. Statistical significance: ***p=0.001 and **p=0.0017 were determined by ordinary one-way ANOVA. (H-J) Immunofluorescence staining targeting dsRNA (red), neuronal nuclear protein (NeuN, green), and nuclei (DAPI, blue) in amygdala brain slices collected from mice infected with SARS2-N501YMA30 infection at 4 or 14 dpi (I-J), compared to mock infection (H). Arrows indicate dsRNA and NeuN-positive neurons. Inserts show enlarged single-cell images. (K) Percentage of dsRNA-positive cells (dsRNA+) in slices from the amygdala and the PFC. The peak of dsRNA+ cells is observed at 4 dpi. Statistical significance: **p=0.0012 was determined by a two-tailed unpaired Student's t-test. (L-O) Immunofluorescence targeting dsRNA (red), astrocyte (glial fibrillary acidic protein, GFAP, green) or microglia (Ionized calcium-binding adaptor molecule 1, Iba1, green), and nuclei (DAPI, blue) in amygdala slices from mice 4 or 14 dpi. (P) Comparison of dsRNA+ cells with NeuN+, GFAP+, and Iba1+ at 4 dpi. Data are presented as mean ± SEM.
Figure 2
Figure 2
Induction of anxiety- and depression-like behaviors in mice following SARS2-N501YMA30 infection. (A) Experimental design and timeline illustrating the administration of SARS2-N501YMA30 and the behavioral test battery. (B-E) Open field test. Top: Representative heat map tracking of activity in the mock and SARS2-N501YMA30 infected mice. Bottom: The total travel distance and time spent in the center area are shown for 14 dpi (C), 60 dpi (D), and 120 dpi (E), respectively. Statistical significance: 14 dpi group: **p=0.0013; ns, non-significant, p=0.1119; n=22 mice each group. 60 dpi group: **p=0.0017; ns, p=0.8427; n=18 mice in each group. 120 dpi group: ns, p=0.7272; p=0.4923; n=8 mice in each group. (F-I) Elevated plus maze test. Top: Representative heat map tracking of activity in mock and SARS2-N501YMA30 infected mice in closed arms (c) and open arms (o). Bottom: The percentages of time spent in the open arms and the number of open arm entries are shown for 14 dpi (G), 60 dpi (H), and 120 dpi (I), respectively. Statistical significance: 14 dpi group: ***p=0.0004; ns, p=0.1241; n=22 mice each group. 60 dpi group: **p=0.0064; p=0.0059; n=18 mice in each group. 120 dpi group: *p=0.0187; ns, p=0.2243; n=8 mice in each group. (J-M) Schematics of the tail suspension test and results showing immobile time at 14 dpi (K), 60 dpi (L), and 120 dpi (M), respectively. Statistical significance: 14 dpi group: ****p<0.0001, n=22 mice in each group. 60 dpi group: **p=0.0015, n=18 mice in each group; 120 dpi group: **p=0.0018, n=8 mice in each group. (N-Q) Schematics of the forced swim test and results showing immobile time at 14 dpi (O), 60 dpi (P), and 120 dpi (Q), respectively. Statistical significance: 14 dpi group: ****p<0.0001; n=22 mice in each group. 60 dpi group: ***p=0.0001; n=18 mice in each group. 120 dpi group: *p=0.0245; n=8 mice in each group. All statistical analyses were performed using a two-tailed unpaired Student's t-test. Data are presented as mean ± SEM.
Figure 3
Figure 3
RNA sequencing reveals distinct alterations in the brains of SARS2-N501YMA30 infected mice. (A) The histogram represents the corresponding numbers of differentially expressed genes (DEGs) between groups. (|log2fold| ≥ 1.5, Q value ≤ 0.05). (B) Venn diagram illustrating the differential gene expression analysis between groups of gene sets. The intersections show shared gene expression patterns, while non-overlapping regions indicate uniquely expressed genes. The numbers within each section denote the count of genes. (C) Heatmap displaying hierarchical clustering of 36 selected genes associated with neuron functions. (D) KEGG Network analysis of key driver genes and enriched KEGG pathways among the 36 selected genes. Dots symbolize genes, squares represent KEGG pathways, and lines connecting genes to squares signify gene enrichment within the respective pathway.
Figure 4
Figure 4
Golgi-Cox staining of neurons in the amygdala of SARS2-N501YMA30 infected mice. (A) Experimental design and timeline depicting the administration of SARS2-N501YMA30, dissection of brain slices, and Golgi staining process. (B) Left: Representative Golgi-Cox staining images of amygdala slices from mock-infected (top) and mice infected with SARS2-N501YMA30 at 14 dpi (bottom). Right: Enlarged images from the red boxes in the left images for each respective group. (C-D) Representative images of dendrites in amygdala slices from mock-infected mice (top) and SARS2-N501YMA30-infected mice at 4 dpi (bottom) (C). Green arrows indicate the mushroom spines. Comparison of total spine density, mature spine density, and the percentage of mature spines (the number of mature spines divided by the total number of spines) between the mock-infected and SARS2-N501YMA30-infected groups (D). Statistical significance: ns, p=0.8482; p=0.5094; p=0.5734. n=12-19 neurons/4 mice in each group. (E-F) Representative images of dendrites at 14 dpi (bottom) (E) and spine comparisons (F). Statistical significance: *p=0.0427; *p=0.0216; **p=0.0049. n=17-21 neurons/4 mice in each group. (G-H) Representative images of dendrites at 60 dpi (bottom) (G) and spine comparisons (H). Statistical significance: ns, p=0.8948; *p=0.0308; **p=0.0250. n=17-20 neurons/4 mice in each group. (I-J) Representative images of dendrites at 120 dpi (bottom) (I) and spine comparisons (J). Statistical significance: ns, p=0.4205; *p=0.0177; **p=0.0038. n=10-17 neurons/4 mice in each group. Statistical analysis was performed using a two-tailed unpaired Student's t-test. Data are presented as mean ± SEM.
Figure 5
Figure 5
Enhancement of microglia-dependent fEPSPs in the amygdala by SARS-CoV-2 variant B.1.351 spike protein. (A) Schematic representation of fEPSP recordings in the amygdala brain slices. (B) Representative fEPSP traces were recorded at the beginning (0 hours) and the end of the 2-hour recordings, during perfusion with either vehicle or spike protein (S1+S2, B.1.351, β variant, 167 ng/ml). (C) Average fEPSP data. The spike protein was applied to the slice (167 ng/ml) at the indicated time point (red trace). In the vehicle group, a mock aqueous buffer solution without the spike protein was used (gray trace). The enhancement of fEPSPs by the spike protein was attenuated by pre-treating brain slices with 50 μM Resveratrol (green trace). (D) Summarized amplitudes of the last five fEPSPs as shown in (C). Statistical significance: ***p=0.0003 and **p=0.0082 were determined by one-way ANOVA with Tukey's post hoc multiple comparisons. The analysis includes data from 5 slices in each group. Data are presented as mean ± SEM.
Figure 6
Figure 6
Microglial activation in response to SARS-CoV-2 infection and B1.351 spike protein. (A) Dynamics of microglial activation post-infection in the amygdala of mice. Immunofluorescence staining for Iba1 highlights microglia in amygdala slices from mice at indicated time points following infection. An enlarged view of individual microglia is provided to detail the changes in shape and morphology indicative of activation states. (B) Microglial activation results from (A) were compared using Sholl analysis, which quantifies total branch length and cell area radius. Statistical significance: **p=0.0027, *p=0.0143, ***p=0.0007, and ****p<0.0001 were by one-way ANOVA with Tukey's post hoc multiple comparisons. The analysis includes data from 12 cells across 4 slices in each group. (C-E) Microglial response to perfusion with the spike protein. Immunostaining with Iba-1 illustrates microglial morphology in brain slices after a one-hour perfusion with the (B) vehicle or (C) spike protein (S1+S2, B.1.351, β variant, 167 ng/ml), and (D) spike protein following a 30-minute pretreatment with 50 μM Ticlopidine, a P2Y12R antagonist. The series showcases the microglial response to the spike protein, with additional magnified images highlighting the individual microglia and their morphological analysis using Sholl analysis, presented to the right of each panel. (F) Microglial activation results from (C-E) were compared using Sholl analysis, which quantifies total branch length and cell area radius. Statistical significance: ****p<0.0001 and ***p=0.0006 were by one-way ANOVA with Tukey's post hoc multiple comparisons. The analysis includes data from 30 cells across 4 slices in each group. (G) Quantification of ATP release. Brain slices were incubated in cold PBS with either vehicle or spike protein (167 ng/ml). Supernatants were collected at 10, 30, and 60 minutes post-incubation. The amount of ATP released into the supernatant was quantified. Each dot is an independent brain slice and represents the mean of 2 technical replicates. Statistical significance: *p=0.0374 and ****p<0.0001 were determined by two-way ANOVA. Data are presented as mean ± SEM.
Figure 7
Figure 7
Antiviral and inflammatory gene expression in the amygdala of SARS-CoV-2-infected mice. Amygdala brain slices from C57BL/6 mice intranasally infected with 104 PFU of SARS2-N501YMA30 were collected at the indicated dpi. Viral gene, antiviral, and inflammatory transcripts were measured by qRT-PCR analyzing total RNA extracted from the amygdala of mock-infected (0 dpi) and infected young C57BL/6 mice. Each amygdala was collected from one individual mouse. Mock (0 dpi), 2, 4, 6, 8, 14 dpi: n=4. The levels of transcripts were normalized to GAPDH and presented as 2^-ΔCT. Statistical significance: *p<0.05, **p<0.01, and ****p<0.0001 were determined by ordinary one-way ANOVA. Data are presented as mean ± SEM.

Similar articles

References

    1. Subramanian A, Nirantharakumar K, Hughes S, Myles P, Williams T, Gokhale KM. et al. Symptoms and risk factors for long COVID in non-hospitalized adults. Nat Med. 2022;28(8):1706–1714. - PMC - PubMed
    1. Bowe B, Xie Y, Al-Aly Z. Postacute sequelae of COVID-19 at 2 years. Nat Med. 2023;29:2347–57. - PMC - PubMed
    1. Sherif ZA, Gomez CR, Connors TJ, Henrich TJ, Reeves WB, Force RMPT. Pathogenic mechanisms of post-acute sequelae of SARS-CoV-2 infection (PASC) Elife. 2023;12:e86002. - PMC - PubMed
    1. DosSantos MF, Devalle S, Aran V, Capra D, Roque NR, Coelho-Aguiar JM. et al. Neuromechanisms of SARS-CoV-2: A Review. Front Neuroanat. 2020;14:37. - PMC - PubMed
    1. Stein SR, Ramelli SC, Grazioli A, Chung JY, Singh M, Yinda CK. et al. SARS-CoV-2 infection and persistence in the human body and brain at autopsy. Nature. 2022;612:758–63. - PMC - PubMed