. 2025 Apr 22;15(12):5801-5825.
doi: 10.7150/thno.112225. eCollection 2025.

Promotion of Cx26 mutants located in TM4 region for membrane translocation successfully rescued hearing loss

Affiliations

Promotion of Cx26 mutants located in TM4 region for membrane translocation successfully rescued hearing loss

Yan-Jun Zong et al. Theranostics. .

Abstract

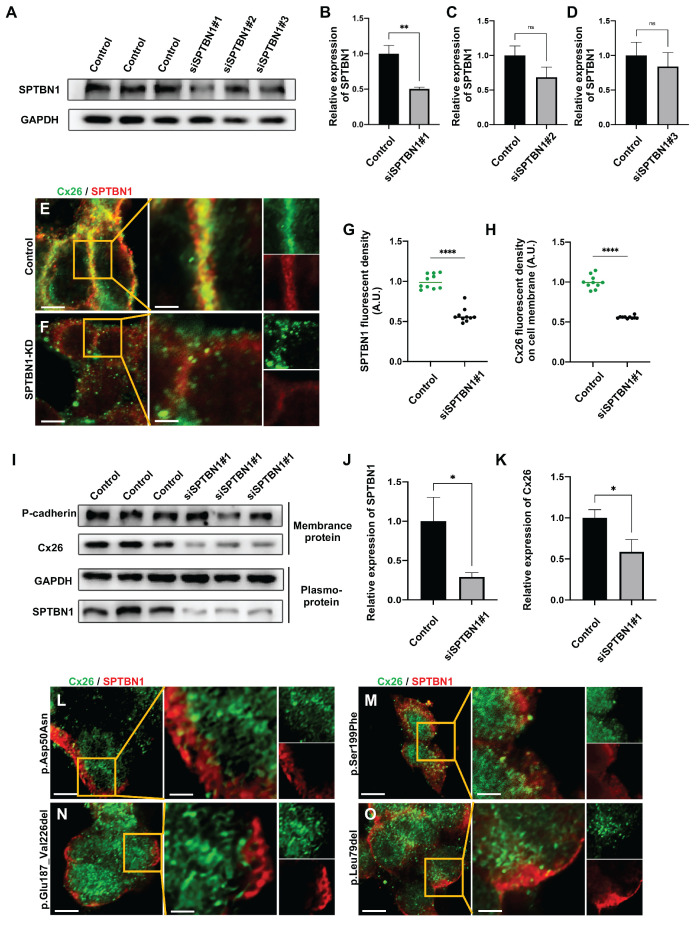
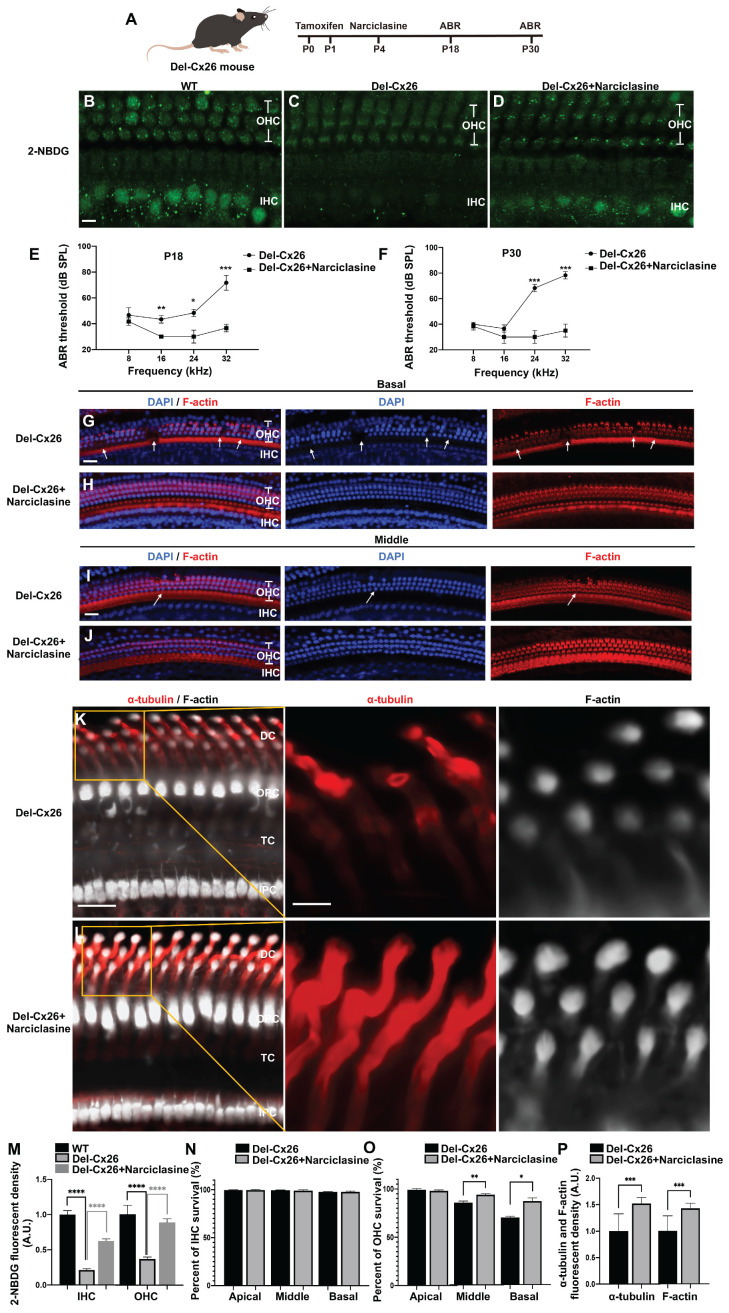
Rationale: The GJB2 gene, which encodes connexin 26 (Cx26), is recognized as the leading cause of non-syndromic hereditary hearing loss. In clinical settings, a total of 131 Cx26 mutations have been identified in association with hearing loss. Certain Cx26 mutants display normal structural and functional properties but fail to translocate to the plasma membrane. Enhancing the membrane localization of these mutants may provide a promising strategy for rescuing hearing loss and hair cell degeneration. Methods: This study investigated the membrane localization of Cx26 using in vitro cell lines, cultured cochlear explants, and in vivo murine models. Key proteins involved in the membrane localization of Cx26 were identified and validated through immunoprecipitation-mass spectrometry (IP-MS) and co-immunoprecipitation (Co-IP). Additionally, cell lines and murine models harboring Cx26 mutants were developed to evaluate the effects of Narciclasine on enhancing the membrane localization of these mutants, as well as its potential to rescue hearing loss. Results: The membrane localization of Cx26 was dependent on the integrity of the intracellular transport network consisting of microtubules, actin microfilaments, and the Golgi apparatus. Additionally, SPTBN1 played a significant role in this process. The transmembrane domain 4 (TM4) region exhibited a strong association with the membrane localization of Cx26, and Cx26 mutants located in TM4 region retained in the cytoplasm. Narciclasine promoted cytoskeletal development, thereby enhancing the membrane localization of Cx26 mutants retained in the cytoplasm. This process helped to reconstruct the inner ear gap junction network and rescue hearing loss and hair cell degeneration. Conclusion: These findings present that enhancing the membrane localization of Cx26 mutants can significantly improve auditory function. This strategy offers a potential therapeutic approach for addressing hereditary sensorineural hearing loss associated with GJB2 mutations.

Keywords: Cx26; SPTBN1; cytoskeleton; hearing loss; mutants; treatment.


Conflict of interest statement

Competing Interests: The authors have declared that no competing interest exists.

Figures

Figure 1
Figure 1
The normal membrane localization of Cx26 is dependent on microtubules, actin microfilaments, and the Golgi apparatus in vitro. (A-B) Immunofluorescent staining of Cx26 (green) and α-tubulin (K40 acetylated) (red) in the control group (A) and in the nocodazole-treated group (B) in vitro. (C-D) Immunofluorescent staining of Cx26 (green) and F-actin (red) in the control group (C) and in the Cytochalasin B-treated group (D) in vitro. (E-F) Immunofluorescent staining of Cx26 (green) and GM130 (red) in the control group (E) and in the BFA-treated group (F) in vitro. (G-I) Quantification of the Cx26 fluorescent density on plasma membrane from the control group and the treatment group in vitro. (J-K) Western blot and histogram showing Cx26 protein levels on the plasma membrane in the control group and in the nocodazole-treated group in vitro. (L-M) Western blot and histogram showing Cx26 protein levels on the plasma membrane in the control group and in the Cytochalasin B-treated group in vitro. (N-O) Western blot and histogram showing Cx26 protein levels on the plasma membrane in the control group and in the BFA-treated group in vitro. Scale bars: 10 μm (panels A-F), and 3 μm (partial enlargement in panels A-F). *P < 0.05, **P < 0.005, ***P < 0.001, ****P < 0.0001.
Figure 2
Figure 2
The normal plasma membrane localization of Cx26 is dependent on microtubules, actin microfilaments, and the Golgi apparatus in the cochlear explants. (A-D) Immunofluorescent staining of Cx26 (green) and F-actin (red) in the control group (A-B) and in the nocodazole-treated group (C-D) in DCs (A, C) and ISCs (B, D) in the cochlear explants. (E-H) Immunofluorescent staining of Cx26 (green) and F-actin (red) in the control group (E-F) and in the Cytochalasin B-treated group (G-H) in DCs (E, G) and ISCs (F, H) in the cochlear explants. (I-L) Immunofluorescent staining of Cx26 (green) and F-actin (red) in the control group (I-J) and in the BFA-treated group (K-L) in DCs (I, K) and ISCs (J, L) in the cochlear explants. (M-R) Quantification of the length of GJPs on DCs (M-O) and ISCs (P-R) from the control group and the treatment group in the cochlear explants. Scale bars: 20 μm (panels A-L), and 7 μm (partial enlargement in panels A-L). *P < 0.05, **P < 0.005, ***P < 0.001, ****P < 0.0001.
Figure 3
Figure 3
The normal plasma membrane localization of Cx26 is dependent on microtubules, actin microfilaments, and the Golgi apparatus in vivo. (A-B) Immunofluorescent staining of Cx26 (green) and F-actin (red) in the control group (A) and in the nocodazole-treated group (B) in ISCs in vivo. (C-D) Immunofluorescent staining of Cx26 (green) and F-actin (red) in the control group (C) and in the Cytochalasin B-treated group (D) in ISCs in vivo. (E-F) Immunofluorescent staining of Cx26 (green) and F-actin (red) in the control group (E) and in the BFA-treated group (F) in ISCs in vivo. (G-I) Quantification of the length of GJPs on ISCs from the control group and the treatment group in vivo. (J-O) Western blot and histogram showing Cx26 protein levels on the plasma membrane in the control group and in the treatment group. Scale bars: 20 μm (panels A-F), and 7 μm (partial enlargement in panels A-F). *P < 0.05, **P < 0.005, ***P < 0.001, ****P < 0.0001.
Figure 4
Figure 4
SPTBN1 participates in the membrane localization of Cx26 in vitro and in vivo. (A) Volcano plots highlights differentially abundant proteins shown in red identified by IP-MS from the anti-Cx26 immunoprecipitation group and the anti-IgG immunoprecipitation group. (B) Venn diagram of IP-MS result indicates that seven proteins may be associated with the plasma membrane localization of Cx26. (C) Immunofluorescent staining of Cx26 (green) and SPTBN1 (red) in vitro. (D) CO-IP results of Cx26 with SPTBN1 in vitro. (E-G) Immunofluorescent staining of Cx26 (green) and SPTBN1 (red) in DCs (E), PCs (F), and ISCs (G) in vivo. (H) CO-IP results of Cx26 with SPTBN1 in vivo. Scale bars: 10 μm (panel C), 3 μm (partial enlargement in panel C), 20 μm (panels E-G), and 7 μm (partial enlargement in panels E-G).
Figure 5
Figure 5
The knockdown of SPTBN1 leads to a significant decrease in Cx26 on the plasma membrane in vitro. (A-D) Western blot and histogram showing SPTBN1 protein levels in the control groups and in the SPTBN1 knockdown groups in vitro. (E-F) Immunofluorescent staining of Cx26 (green) and SPTBN1 (red) in the control group (E) and in the SPTBN1 knockdown group (F) in vitro. (G-H) Quantification of the SPTBN1 fluorescence intensity (G) and Cx26 fluorescence intensity on plasma membrane (H) from the control group and the SPTBN1 knockdown group in vitro. (I-K) Western blot and histogram showing SPTBN1 protein levels and Cx26 protein levels on the plasma membrane in the control groups and in the SPTBN1 knockdown groups in vitro. (L-O) Immunofluorescent staining of Mut-Cx26 (p.Asp50Asn (L), p.Ser199Phe (M), p.Glu187_Val226del (N), and p.Leu79del (O)) (green) and SPTBN1 (red) in vitro. Scale bars: 10 μm (panels E-F, panels L-O), and 3 μm (partial enlargement in panels E-F, and panels L-O). *P < 0.05, **P < 0.005, ***P < 0.001, ****P < 0.0001.
Figure 6
Figure 6
Narciclasine promotes microtubules and actin microfilaments development and enhances the membrane localization of WT-Cx26 in vitro and in vivo. (A) Schematic representation of the Cx26 structure and the Cx26 mutants retained in the cytoplasm. (B) Schematic representation of the three-dimensional structure of WT-Cx26 and Mut-Cx26s (p.Ser199Phe, p.Glu187_Val226del, and p.Leu79del). (C-F) Immunofluorescent staining of Cx26 (green), F-actin (white), and acetylated α-tubulin (red) in the control group (C, E) and in the Narciclasine-treated group (D, F) in vitro. (G-L) Immunofluorescent staining of Cx26 (green), F-actin (white), and acetylated α-tubulin (red) in the control group (G, I, K) and in the Narciclasine-treated group (H, J, L) in vivo. Scale bars: 10 μm (panels C-F), 3 μm (partial enlargement in panels C-F), 27 μm (panels G-H), 9 μm (partial enlargement in panels G-H), 20 μm (panels I-L), and 7 μm (partial enlargement in panels I-L).
Figure 7
Figure 7
Narciclasine promotes the development of cytoskeleton, and enhances the membrane localization of Mut-Cx26s in vitro. (A-H) Immunofluorescent staining of Mut-Cx26s (green) and F-actin (red) in the Mut-Cx26 groups (A, C, E, G) and in the Narciclasine-treated groups (B, D, F, H) in vitro. (I-P) Immunofluorescent staining of Mut-Cx26s (green) and acetylated α-tubulin (red) in the Mut-Cx26 groups (I, K, M, O) and in the Narciclasine-treated groups (J, L, N, P) in vitro. (Q-AB) Quantification of the Cx26 fluorescent density on plasma membrane (Q-T), F-actin fluorescent density (U-X), and acetylated α-tubulin fluorescent density (Y-AB) from the Mut-Cx26 groups and the Narciclasine-treated groups in vitro. Scale bars: 10 μm (panels A-P), and 3 μm (partial enlargement in panels A-P). *P < 0.05, **P < 0.005, ***P < 0.001, ****P < 0.0001.
Figure 8
Figure 8
Narciclasine increases permeability of cells to ions and glucose in vitro. (A-I) Lucifer yellow diffusion images in scrape-loading dye transfer of WT-Cx26 (I) and Mut-Cx26s p.Asp50Asn (A-B), p.Ser199Phe (C-D), p.Glu187_Val226del (E-F), and p.Leu79del (G-H). (J) Quantification of the diffusion distance from the Mut-Cx26s and the Mut-Cx26s treated with Narciclasine. (K-S) 2-NBDG uptake in WT-Cx26 (S) and Mut-Cx26s p.Asp50Asn (K-L), p.Ser199Phe (M-N), p.Glu187_Val226del (O-P), and p.Leu79del (Q-R). (T) Quantification of the fluorescence intensity of 2-NBDG uptake from the Mut-Cx26s and the Mut-Cx26s treated with Narciclasine. *P < 0.05, **P < 0.005, ***P < 0.001, ****P < 0.0001.
Figure 9
Figure 9
Narciclasine rescues hearing loss and hair cell degeneration in the Gjb2p.Asp50Asn/- heterozygous mice. (A) Sanger sequencing result of murine model. It confirms that the Het mouse harbors the p.Asp50Asn point mutation (B) Schematic diagram of the mouse operation process. (C) Changes in mRNA expression levels of Gjb2 in the WT mice and Gjb2 mutant in the Het mice. (D-E) Western blot and histogram showing the Cx26 protein levels in the WT mice and the Cx26 mutant protein levels in the Het mice. (F) Changes in ABR thresholds at different frequencies in the Het mice and in the Het mice treated with Narciclasine at P30 (N=5). (G-H) 2-NBDG uptake in the Het mice (G) and in the Het mice treated with Narciclasine (H) at P30. (I-L) Representative images of IHCs and OHCs of different turns in the Het mice (I, K) and in the Het mice treated with Narciclasine (J, L) at P30. (M-N) Immunofluorescent staining of Mut-Cx26 (green) and Cx30 (red) in the Het mice (M) and in the Het mice treated with Narciclasine (N) at P30. White arrows show Mut-Cx26 or Cx30 retained in the cytoplasm. (O) Quantification of the 2-NBDG relative fluorescence intensity from the Het mice and the Het mice treated with Narciclasine at P30. (P-Q) Percent of IHCs (P) and OHCs (Q) survival in the Het mice and in the Het mice treated with Narciclasine at P30. (R) Quantification of the length of GJPs on the plasma membrane of ISCs from the Het mice and the Het mice treated with Narciclasine at P30. Scale bars: 10 μm (panels G-H), 20 μm (panels I-L), 27 μm (panels M-N), and 9 μm (partial enlargement in panels M-N). *P < 0.05, **P < 0.005, ***P < 0.001, ****P < 0.0001.
Figure 10
Figure 10
Narciclasine rescues hearing loss and hair cell degeneration in the Del-Cx26 mice. (A) Schematic diagram of mouse operation process. (B-D) 2-NBDG uptake in the WT mice (B), in the Del-Cx26 mice (C) and in the Del-Cx26 mice treated with Narciclasine (D) at P30. (E-F) Changes in ABR thresholds at different frequencies in the Del-Cx26 mice and in the Del-Cx26 mice treated with Narciclasine at P18 (E) and P30 (F) (N=10). (G-J) Representative images of IHCs and OHCs of different turns in the Del-Cx26 mice (G, I) and in the Del-Cx26 mice treated with Narciclasine (H, J) at P30. (K-L) Immunofluorescent staining of acetylated α-tubulin (red) and F-actin (white) in the Del-Cx26 mice (K) and in the Del-Cx26 mice treated with Narciclasine (L) at P30. (M) Quantification of the 2-NBDG relative fluorescence intensity from the Del-Cx26 mice and the Del-Cx26 mice treated with Narciclasine at P30. (N-O) Percent of IHCs (N) and OHCs (O) survival in the Del-Cx26 mice and in the Del-Cx26 mice treated with Narciclasine at P30. (P) Quantification of the acetylated α-tubulin and F-actin relative fluorescence intensity from the Del-Cx26 mice and the Del-Cx26 mice treated with Narciclasine at P30. Scale bars: 10 μm (panels B-D), 20 μm (panels G-J), 27 μm (panels K-L), and 9 μm (partial enlargement in panels K-L). *P < 0.05, **P < 0.005, ***P < 0.001, ****P < 0.0001.
Figure 11
Figure 11
Narciclasine enhances the membrane localization of Mut-Cx26 retained in the cytoplasm by facilitating the cytoskeleton development, thus restoring the permeability of cells to ions and glucose. The membrane localization of WT-Cx26 relies on an intracellular protein transport network consisting of microtubules, actin microfilaments, and the Golgi apparatus. SPTBN1 is involved in the membrane localization of WT-Cx26. Tricellular adherens junctions serve as a platform for the delivery of Cx26 and N-cadherin facilitates the anchoring of microtubules to lipid rafts. Mut-Cx26 p.Glu187_Val226del retains in the perinuclear nucleus, while p.Asp50Asn, p.Ser199Phe and p.Leu79del retain in the ER. Narciclasine promotes the development of the cytoskeleton, thus enhancing the membrane localization of Mut-Cx26s retained in the cytoplasm. Black arrows represent WT-Cx26 membrane transport processes. Red arrows represent a diagram of the potential mechanism of Narciclasine enhancing the membrane localization of Mut-Cx26s to rescue hearing loss.

References

    1. Korver AM, Smith RJ, Van Camp G, Schleiss MR, Bitner-Glindzicz MA, Lustig LR. et al. Congenital hearing loss. Nat Rev Dis Primers. 2017;3:16094. - PMC - PubMed
    1. Ji H, Shu YL, Li HW. Unveiling a novel GJB2 dominant K22T mutation in a Chinese family with hearing loss. Acta Biochim Biophys Sin (Shanghai) 2024;56:945–951. - PMC - PubMed
    1. Dai P, Yu F, Han B, Liu XZ, Wang GJ, Li Q. et al. GJB2 mutation spectrum in 2,063 Chinese patients with nonsyndromic hearing impairment. J Transl Med. 2009;7:26. - PMC - PubMed
    1. Norouzi V, Azizi H, Fattahi Z, Esteghamat F, Bazazzadegan N, Nishimura C. et al. Did the GJB2 35delG mutation originate in Iran? Am J Med Genet A. 2011;155a:2453–8. - PMC - PubMed
    1. Snoeckx RL, Huygen PL, Feldmann D, Marlin S, Denoyelle F, Waligora J. et al. GJB2 mutations and degree of hearing loss: a multicenter study. Am J Hum Genet. 2005;77:945–57. - PMC - PubMed

LinkOut - more resources