

Proton pump inhibitors use and risk of type 2 diabetes mellitus: correlation analysis, prediction model construction, and key genes identification
- PMID: 40365304
- PMCID: PMC12069289
- DOI: 10.3389/fphar.2025.1580090
Proton pump inhibitors use and risk of type 2 diabetes mellitus: correlation analysis, prediction model construction, and key genes identification
Abstract
Introduction: Prior cohort studies reported paradoxical results between proton pump inhibitor (PPI) usage and the risk of type 2 diabetes mellitus (T2DM). We investigated the correlation between the use of PPIs and T2DM risk, constructed predictive models, and identified the key genes involved.
Methods: In the correlation analysis, we extracted and analyzed the data from the National Health and Nutrition Examination Survey (NHANES) database and the FDA Adverse Event Reporting System (FAERS) database to examine the relationship between the use of PPIs and T2DM risk. Then, a nomogram was constructed to estimate the T2DM risk probability in patients treated with PPIs by using the optimal predictors identified by the least absolute shrinkage and selection operator and logistic regression methods. Finally, we investigated the key genes modulated by PPI usage in patients with T2DM by combining various bioinformatics techniques such as network pharmacology, difference analysis, and weighted gene co-expression network analysis.
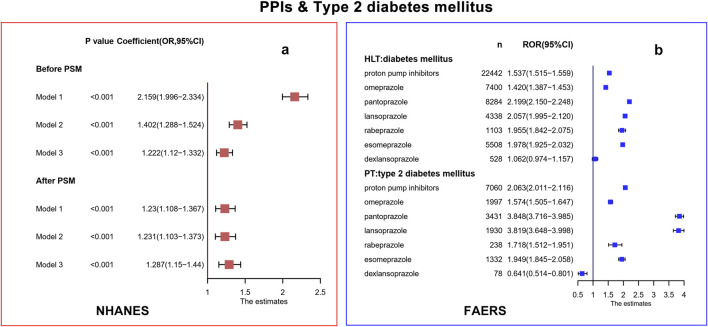
Results: In the NHANES database, regardless of whether PPI usage was merely included or used to adjust for covariates, the binomial regression models indicated a positive correlation between PPI usage and T2DM risk (all p < 0.001). In the FAERS database, the T2DM signal for patients using PPIs was significant (lower limit of the reporting odds ratio was greater than 1). Sex, race, age, educational level, obesity, hypertension, and high cholesterol were included in the nomogram to predict the probability of PPI usage-induced T2DM risk (all p < 0.05). By intersecting the key cluster and the intersection of PPI usage-related genes and T2DM-related genes, we finally identified two crucial genes, AGT and JAK2, that may be involved in PPI usage-induced T2DM risk.
Discussion: Our findings revealed that PPI treatment can increase the risk of T2DM. Additionally, we were successful in constructing a new nomogram to identify individuals at high risk of developing T2DM among patients using PPIs and completed a preliminary exploration of possible gene targets and mechanisms. Our study will be useful in alerting clinicians to the T2DM risk involved in PPI treatment and allowing them to take early prevention and intervention measures.
Keywords: correlation analysis; gene identification; prediction model; proton pump inhibitors; type 2 diabetes mellitus.
Copyright © 2025 Liang and Zhang.
Conflict of interest statement
The authors declare that the research was conducted in the absence of any commercial or financial relationships that could be construed as a potential conflict of interest.
Figures


Similar articles
-
Association and Mechanisms of Proton Pump Inhibitors Use with Type-2Diabetes Mellitus Incidence in Adults: A Systemic Review andMeta-Analysis.Curr Diabetes Rev. 2024;20(10):e120124225581. doi: 10.2174/0115733998254869231101095222. Curr Diabetes Rev. 2024. PMID: 38243950
-
Vonoprazan-associated Clostridioides difficile infection: an analysis of the Japanese Adverse Drug Event Report and the FDA Adverse Event Reporting System.Ther Adv Drug Saf. 2024 Jul 31;15:20420986241260211. doi: 10.1177/20420986241260211. eCollection 2024. Ther Adv Drug Saf. 2024. PMID: 39091466 Free PMC article.
-
A pharmacovigilance study of the association between proton pump inhibitors and tumor adverse events based on the FDA adverse event reporting system database.Front Pharmacol. 2024 Dec 19;15:1524903. doi: 10.3389/fphar.2024.1524903. eCollection 2024. Front Pharmacol. 2024. PMID: 39749203 Free PMC article.
-
Dose-Dependent Proton Pump Inhibitor Exposure and Risk of Type 2 Diabetes: A Nationwide Nested Case-Control Study.Int J Environ Res Public Health. 2022 Jul 18;19(14):8739. doi: 10.3390/ijerph19148739. Int J Environ Res Public Health. 2022. PMID: 35886592 Free PMC article.
-
Proton pump inhibitor-associated hypomagnesemia: what do FDA data tell us?Ann Pharmacother. 2013 Jun;47(6):773-80. doi: 10.1345/aph.1R556. Epub 2013 Apr 30. Ann Pharmacother. 2013. PMID: 23632281 Review.
References
-
- Arai M., Tsuno T., Konishi H., Nishiyama K., Terauchi Y., Inoue R., et al. (2023). A disproportionality analysis of the adverse effect profiles of methimazole and propylthiouracil in patients with hyperthyroidism using the Japanese adverse drug event report database. Thyroid 33 (7), 804–816. 10.1089/thy.2023.0030 - DOI - PubMed
LinkOut - more resources
Full Text Sources
Miscellaneous