

Impact of vitamin C deficiency on imaging patterns and ventilatory function in pulmonary tuberculosis
- PMID: 40365493
- PMCID: PMC12069067
- DOI: 10.3389/fmed.2025.1554723
Impact of vitamin C deficiency on imaging patterns and ventilatory function in pulmonary tuberculosis
Abstract
Background: Studies have shown that vitamin C is essential for the immune response to tuberculosis (TB), and that its deficiency may elevate the risk of TB and related complications. This prospective study investigated the association between disease severity, imaging findings and vitamin C levels.
Methods: This study enrolled 109 patients with confirmed pulmonary tuberculosis based on Mycobacterium tuberculosis culture. Patients were divided into two groups based on serum vitamin C levels: 59 patients (54.13%) with normal levels and 50 (45.87%) with low levels.
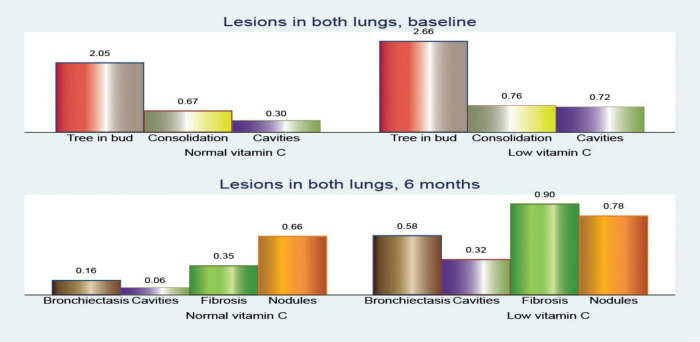
Results: At baseline, patients in the low vitamin C group showed significantly higher bacillar loads, with 86.00% presenting loads of 2+ or higher compared with 59.32% in the normal group (p < 0.001). After 2 months of treatment, 83.05% of the normal vitamin C group achieved culture conversion, while only 28.00% of the low vitamin C group reached the same milestone (p < 0.001). CT imaging at baseline revealed that the low vitamin C group had a significantly higher mean frequency of the tree-in-bud pattern (2.66 vs. 2.05; p < 0.001). Cavitary lesions were more prevalent in the low vitamin C group, in the superior right lobe (0.34 vs. 0.13; p = 0.011) and superior left lobe (0.34 vs. 0.14; p = 0.012). After 6 months of treatment, the low vitamin C group exhibited a higher prevalence of bronchiectasis (mean involvement in both lungs: 0.58 vs. 0.16; p < 0.001), cavitary lesions (0.32 vs. 0.00; p = 0.002), and fibrosis (0.90 vs. 0.36; p < 0.001). Pulmonary function tests showed greater impairment in the low vitamin C group. The forced expiratory volume decreased by 5.77% compared to 3.59% in the normal group (p < 0.001), the forced vital capacity (FVC) decreased by 12.00% vs. 6.67% (p < 0.001), and the Tiffeneau index by 3.34 vs. 2.13 (p = 0.002). Receiver operating characteristic (ROC) analysis indicated that FVC (AUC = 0.826) and forced expiratory flow (AUC = 0.745) were stronger predictors of treatment success in patients with normal vitamin C levels.
Conclusion: Vitamin C deficiency is correlated with increased disease severity, delayed bacterial clearance, and persistent pulmonary damage in patients with tuberculosis. Vitamin C supplementation can enhance treatment outcomes in tuberculosis therapy.
Keywords: CT scan; chest imaging; pulmonary tuberculosis; spirometry; vitamin C.
Copyright © 2025 Cioboata, Balteanu, Zlatian, Vlasceanu, Driga, Mitroi, Catana, Buciu, Camen and Mirea.
Conflict of interest statement
The authors declare that the research was conducted in the absence of any commercial or financial relationships that could be construed as a potential conflict of interest.
Figures


Similar articles
-
[Standard technical specifications for methacholine chloride (Methacholine) bronchial challenge test (2023)].Zhonghua Jie He He Hu Xi Za Zhi. 2024 Feb 12;47(2):101-119. doi: 10.3760/cma.j.cn112147-20231019-00247. Zhonghua Jie He He Hu Xi Za Zhi. 2024. PMID: 38309959 Chinese.
-
Clinical, Radiological, and Lung Function Characteristics of Post-tuberculosis Bronchiectasis: An Experience From a Tertiary Care Center in India.Cureus. 2023 Feb 7;15(2):e34747. doi: 10.7759/cureus.34747. eCollection 2023 Feb. Cureus. 2023. PMID: 36909094 Free PMC article.
-
Response to treatment and low serum vitamin D levels in North Indian patients with treatment-naive category I and multi-drug resistant pulmonary tuberculosis.Ann Med. 2024 Dec;56(1):2407066. doi: 10.1080/07853890.2024.2407066. Epub 2024 Sep 23. Ann Med. 2024. PMID: 39311013 Free PMC article.
-
Antioxidant supplementation for lung disease in cystic fibrosis.Cochrane Database Syst Rev. 2019 Oct 3;10(10):CD007020. doi: 10.1002/14651858.CD007020.pub4. Cochrane Database Syst Rev. 2019. PMID: 31580490 Free PMC article. Review.
-
Vitamin D status and risk of incident tuberculosis disease: A nested case-control study, systematic review, and individual-participant data meta-analysis.PLoS Med. 2019 Sep 11;16(9):e1002907. doi: 10.1371/journal.pmed.1002907. eCollection 2019 Sep. PLoS Med. 2019. PMID: 31509529 Free PMC article.
Cited by
-
The Role of Rehabilitation Program in Managing the Triad of Sarcopenia, Obesity, and Chronic Pain.Life (Basel). 2025 Jul 24;15(8):1174. doi: 10.3390/life15081174. Life (Basel). 2025. PMID: 40868822 Free PMC article.
-
Nutritional Deficiencies and Management in Tuberculosis: Pharmacotherapeutic and Clinical Implications.Nutrients. 2025 May 30;17(11):1878. doi: 10.3390/nu17111878. Nutrients. 2025. PMID: 40507146 Free PMC article. Review.
References
-
- World Health Organization [WHO. Global Tuberculosis Report 2024. Geneva: World Health Organization; (2024).
-
- World Health Organization [WHO. Global Tuberculosis Report 2023. Geneva: World Health Organization; (2023).
LinkOut - more resources
Full Text Sources