. 2025 Apr 29:15:1587166.
doi: 10.3389/fcimb.2025.1587166. eCollection 2025.

Egg-driven immunosuppression and granuloma zonation in Peyer's patches of mice with Schistosoma japonicum infection

Affiliations

Egg-driven immunosuppression and granuloma zonation in Peyer's patches of mice with Schistosoma japonicum infection

Linzhu Li et al. Front Cell Infect Microbiol. .

Abstract

Egg granulomas caused by Schistosoma japonicum (S. japonicum) are important causes of morbidity and mortality in schistosomiasis. The intestine plays a crucial role in the complete life cycle of S. japonicum; eggs are transported through the intestine and excreted with feces. During this process, the interaction between the eggs and the intestine can trigger a strong intestinal immune system response and cause inflammation. Eggs in the intestine preferentially accumulate in Peyer's patches (PPs). However, the cellular composition of intestinal granulomas and the impacts of egg deposition on the immune function of PPs remain poorly understood. Using a mouse model of S. japonicum infection, we revealed that the deposition of eggs disrupted the structure of PPs, resulting in immunosuppression. We further characterized the cellular composition of intestinal granulomas, revealing a layered distribution of neutrophils, macrophages, T cells, and B cells, with marked neutrophil accumulation. Single-cell RNA sequencing revealed that egg deposition drives B-cell apoptosis, T-cell exhaustion, and activation of fibrotic pathways in myeloid cells, collectively impairing PP function. In conclusion, the layered cellular architecture of intestinal granulomas in PPs suggests a unique immune microenvironment of egg-driven immunosuppression and fibrotic remodeling, and the identification of fibrotic pathways in myeloid cells provides a potential therapeutic target to alleviate fibrosis in patients with S. japonicum infection.

Keywords: Peyer’s patch; Schistosoma japonicum; fibrosis; granuloma; immunosuppression.


Conflict of interest statement

The authors declare that the research was conducted in the absence of any commercial or financial relationships that could be construed as potential conflicts of interest.

Figures

Figure 1
Figure 1
Eggs destroy the immune balance in PPs. (A) Egg deposition in PPs. (B) Hematoxylin and eosin (H&E) staining of PP sections. (C) RNA-seq heatmap of inflammation and fibrosis molecules. (D) qPCR analysis of inflammatory and fibrosis-related molecules. (E) Masson staining and immunohistochemistry of PPs. All data; n = 3–5, *P<0.05, **P<0.01, ***P <0.001.
Figure 2
Figure 2
The components of granulomas in PPs. (A) Multiplex immunofluorescence image showing the distribution of immune cells in HC PPs and infected PPs: CD19 (yellow), CD3 (red), F4/80 (green), and Ly6G (purple). (B) Comparison of immune cell ratios. (C, D) Comparison of the immune cell ratio in B-cell follicles (C) and areas without B-cell follicles (D). (E) Multiplex immunofluorescence illustrating the distribution of immune cells in granulomas. Arrows point to egg CD19 (yellow), CD3 (red), F4/80 (green), and Ly6G (purple). (F) Distinctive ratios of immune cells at different distances from eggs.
Figure 3
Figure 3
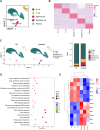
Overview of single-cell transcriptional profiling of PPs and RNA-seq of PPs revealing cell survival status. (A) UMAP visualization of B cells, T cells, myeloid cells, and plasma. (B) Heatmap visualization of the top 50 genes in five cell types. (C) Distribution of different cells in HCs and infected mice. (D) KEGG enrichment analysis was conducted on the RNA-seq data of Peyer’s patches (PPs) from healthy controls (HCs) and infected mice. The PI3K-AKT signaling pathway was found to be significantly enriched in the infected mice. (E) Heatmap visualization of apoptosis genes based on the RNA-seq data of PPs.
Figure 4
Figure 4
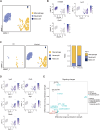
Single-cell RNA-seq analysis reveals B-cell inhibition and apoptosis. (A) UMAP visualization of three B-cell subclusters: naïve B cells and memory B cells (Bnm), germinal center B cells (GCB), and plasma cells (PCs). (B) Distributions of Bnm, GCB, and PCs. (C) UMAP visualization of the expression of marker genes. (D) Violin plot of SHM and CSR genes in GCB. These genes were down-regulated in infected mice. (E) Analysis of B-cell interactions. The interaction of CD22-PTPCR was enhanced in infected mice. (F) Circle plot of apoptosis genes in B cells. Decreased expression of inhibitors of apoptosis genes was observed in infected mice.
Figure 5
Figure 5
Single-cell RNA-seq analysis reveals T-cell exhaustion. (A) UMAP visualization of seven T-cell subclusters: naïve T cells (Tn), T helper 17 (Th17), T helper 1 (Th1), T helper 2 (Th2), follicular helper T (Tfh), effective T (Teff), and NK-like T (TNK) cells. (B) Distributions of Tn, Th17, Th1, Th2, Tfh, Teff, and TNK cells. (C) UMAP visualization of the expression of CD4+ and CD8+ marker genes. (D) UMAP visualization of the expression of T-cell marker genes. (E) Analysis of T-cell interactions. The interaction between T-cell and B-cell was attenuated.
Figure 6
Figure 6
Cell interaction reveals a decline in T–B-cell interplay. (A) The number of interactions in the cell–cell communication network. T-cell–B-cell (B–T) interactions were the most severely affected, 24 interactions in healthy controls but only 7 in the infected mice. (B) Analysis of B-cell interactions. The interaction between MHC molecules on B cells and the CD4 or CD8 complexes on T cells was completely abolished.
Figure 7
Figure 7
Single-cell RNA-seq analysis reveals that myeloid cells activate fibrosis signaling. (A) UMAP visualization of three myeloid cell subclusters: macrophages, neutrophils, and mast cells. (B) Expression of marker genes via UMAP visualization. (C) Distributions of macrophages, neutrophils, and mast cells. (D) UMAP visualization of the expression of M2 marker genes. (E) Analysis of signaling changes in myeloid cell interactions.
Figure 8
Figure 8
Pattern diagram for egg deposition in PPs. Worm eggs disrupt the lymphoid follicle structure in PPs and recruit neutrophils, macrophages, T cells, and B cells to form granulomatous structures. Within these structures, neutrophils and macrophages are located in the inner layer, whereas B cells and T cells occupy the outer layer.

References

    1. Ashwell J. D., D’Oro U. (1999). CD45 and Src-family kinases: and now for something completely different. Immunol. Today 20, 412–416. doi: 10.1016/S0167-5699(99)01505-4 - DOI - PubMed
    1. Barnett R. (2018). Schistosomiasis. Lancet 392, 2431. doi: 10.1016/S0140-6736(18)33008-3 - DOI - PubMed
    1. Buechler M. B., Fu W., Turley S. J. (2021). Fibroblast-macrophage reciprocal interactions in health, fibrosis, and cancer. Immunity 54, 903–915. doi: 10.1016/j.immuni.2021.04.021 - DOI - PubMed
    1. Burke M. L., McManus D. P., Ramm G. A., Duke M., Li Y., Jones M. K., et al. . (2010). Temporal expression of chemokines dictates the hepatic inflammatory infiltrate in a murine model of schistosomiasis. PloS Neglected Trop. Dis. 4, e598. doi: 10.1371/journal.pntd.0000598 - DOI - PMC - PubMed
    1. Cerutti A., Rescigno M. (2008). The biology of intestinal immunoglobulin A responses. Immunity 28, 740–750. doi: 10.1016/j.immuni.2008.05.001 - DOI - PMC - PubMed

MeSH terms

LinkOut - more resources