Global Decline in the Size of Sea Turtles
- PMID: 40365694
- PMCID: PMC12076184
- DOI: 10.1111/gcb.70225
Global Decline in the Size of Sea Turtles
Abstract
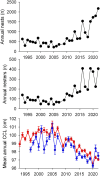
Changes in mean adult body size may be a universal response to global warming and sometimes lead to conservation concerns. We show that size reductions in sea turtles are now the norm and have another explanation. From 18,707 measurements of nester size (curve carapace length) for sea turtles spanning 30 years from Redang Island (Malaysia), where nearly all nesting individuals have been tagged, we show that the mean size was initially fairly stable and then decreased by 4.0 cm from 100.8 cm in 2005 to 96.8 cm in 2022, which likely translates to a change in mean mass from 120 to 105 kg. At the same time, nesting increased from around 300 to 2000 nests per year. Consistent with this finding of a size reduction in an expanding population, at 27 of 31 sites across the globe where changes in the mean size of nesting sea turtles have been assessed, mean size is decreasing, and the most marked decreases are at sites where population size is increasing most dramatically. Taken together, these focal and global findings suggest that an important driver of size reductions in sea turtles is an influx of small first-time nesters (neophytes) in expanding populations, and hence, size reductions are partially a consequence of successful sea turtle conservation measures and population recoveries. At the same time, the focal observations in Malaysia show that the mean size of neophytes has also been getting smaller over time: from 99.6 to 96.8 cm between 2005 and 2022, likely because of a change in foraging environments. While smaller turtles have lower reproductive output, this negative consequence of decreases in nester size will often be more than offset by increases in nesting numbers that are occurring widely.
Keywords: Chelonia mydas; Bergmann's rule; body size reduction; ectotherm; food availability; macroevolution; responses to climate change.
Global Change Biology© 2025 The Author(s). Global Change Biology published by John Wiley & Sons Ltd.
Conflict of interest statement
The authors declare no conflicts of interest.
Figures


References
-
- Balazs, G. H. , Van Houtan K. S., Hargrove S. A., Brunson S. M., and Murakawa S. K.. 2015. “A Review of the Demographic Features of Hawaiian Green Turtles (Chelonia mydas).” Chelonian Conservation and Biology 14: 119–129. 10.2744/CCB-1172.1. - DOI
-
- Bell, I. P. , Freeman A. B., McKenzie L. J., et al. 2025. “The Apparent Change in Population Structure of Green Turtles (Chelonia mydas) at a Northern Great Barrier Reef Foraging Site Over Three Decades and an Evaluation of Potential Cause.” Aquatic Conservation: Marine and Freshwater Ecosystems 35: e70078. 10.1002/aqc.70078. - DOI
-
- Bell, I. P. , Meager J. J., Eguchi T., Dobbs K. A., Miller J. D., and Hof C. M.. 2020. “Twenty‐Eight Years of Decline: Nesting Population Demographics and Trajectory of the North‐East Queensland Endangered Hawksbill Turtle (Eretmochelys imbricata).” Biological Conservation 241: 108376. 10.1016/j.biocon.2019.108376. - DOI
-
- Bellini, C. , Santos A. J., Grossman A., Marcovaldi M. A., and Barata P. C.. 2013. “Green Turtle (Chelonia mydas) Nesting on Atol das Rocas, North‐Eastern Brazil, 1990–2008.” Journal of the Marine Biological Association of the United Kingdom 93: 1117–1132. 10.1017/S002531541200046X. - DOI
-
- Bjorndal, K. A. , Carr A., Meylan A. B., and Mortimer J. A.. 1985. “Reproductive Biology of the Hawksbill Eretmochelys imbricata at Tortuguero, Costa Rica, With Notes on the Ecology of the Species in the Caribbean.” Biological Conservation 34: 353–368. 10.1016/0006-3207(85)90040-0. - DOI
MeSH terms
Grants and funding
LinkOut - more resources
Full Text Sources
Other Literature Sources

