. 2025 May;169(5):e70079.
doi: 10.1111/jnc.70079.

Proteomics Analysis of the TDP-43 Interactome in Cellular Models of ALS Pathogenesis

Affiliations

Proteomics Analysis of the TDP-43 Interactome in Cellular Models of ALS Pathogenesis

Flora Cheng et al. J Neurochem. 2025 May.

Abstract

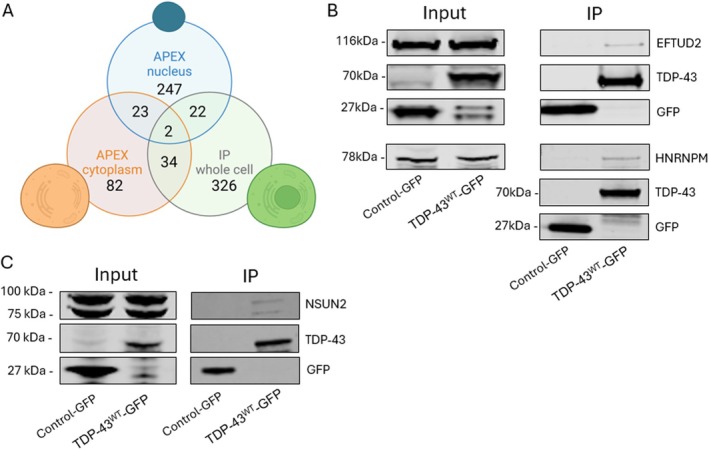
Cytoplasmic aggregation and nuclear depletion of TAR DNA-binding protein 43 (TDP-43) is a hallmark pathology of several neurodegenerative diseases including amyotrophic lateral sclerosis (ALS), frontotemporal lobar degeneration (FTLD) and limbic-predominant age-related TDP-43 encephalopathy (LATE). However, the protein interactome of TDP-43 remains incompletely defined. In this study, we aimed to identify putative TDP-43 protein partners within the nucleus and the cytoplasm and with different disease models of TDP-43 by comparing TDP-43 interaction partners in three different cell lines. We verified the levels of interaction of protein partners under stress conditions as well as after introducing TDP-43 variants containing ALS missense mutations (G294V and A315T). Overall, we identified 58 putative wild-type TDP-43 interactors, including novel binding partners responsible for RNA metabolism and splicing. Oxidative stress exposure broadly led to changes in TDP-43WT interactions with proteins involved in mRNA metabolism, suggesting a dysregulation of the transcriptional machinery early in disease. Conversely, although G294V and A315T mutations are both located in the C-terminal domain of TDP-43, both mutants presented different interactome profiles with most interaction partners involved in translational and transcriptional machinery. Overall, by correlating different cell lines and disease-simulating interventions, we provide a list of high-confidence TDP-43 interaction partners, including novel and previously reported proteins. Understanding pathological changes to TDP-43 and its specific interaction partners in different models of stress is critical to better understand TDP-43 proteinopathies and provide novel potential therapeutic targets and biomarkers.

Keywords: ALS; APEX; MND; TDP‐43; interactomics; proteomics.


Conflict of interest statement

The authors declare no conflicts of interest.

Figures

FIGURE 1
FIGURE 1
Schematic illustrating the workflow used in this study. Traditional immunoprecipitation coupled with LC–MS/MS was performed in T‐Rex cells stably expressing human TDP‐43WT to identify its in vitro interactome. Interactors were validated in neuro2A cells using Biotin–APEX‐proximity labeling coupled with LC–MS/MS.
FIGURE 2
FIGURE 2
(A) Venn diagram showing the number of proteins found and common interactors between mouse neuro2A (n = 4) and human T‐Rex cells (n = 3) expressing TDP‐43WT and control in the cytoplasmic and nuclear compartments. (B) Western blot analysis representing the IP eluted proteins from T‐Rex cells expressing TDP‐43WT‐GFP and control GFP. This shows EFTUD2 and HNRNPM as binding partners of TDP‐43, which do not immunoprecipitate with the GFP control. (C) Western blot representing the IP eluted proteins from neuro2A cell expressing TDP‐43WT‐GFP and control GFP. We show the binding of NSUN2 with TDP‐43, which does not immunoprecipitate with the GFP control.
FIGURE 3
FIGURE 3
Gene Oncology annotation of the 58 putative interactors of TDP‐43 found in both T‐Rex and neuro2A cells using two different methods (IP and biotin–APEX labeling). Proteins annotated by protein class (left), molecular function (top right) and pathway (bottom right). Novel putative TDP‐43 interactors found in this study are highlighted in red. Proteins with no PANTHER category assigned are excluded.
FIGURE 4
FIGURE 4
(A) Immunofluorescence images of neuro2A cells expressing TDP‐43WT‐GFP or GFP control stained with DAPI (blue) and NSUN2 to assess colocalisation with TDP‐43WT‐GFP or GFP control. UNT represents vehicle control and SA represents 0.5 mM NaAsO2 treatment for 1 h to induce TDP‐43 aggregation in the nucleus. All images were acquired through confocal microscopy at 100× magnification. (B) Western blot representing the initial lysates of neuro2A cells expressing a vector control or TDP‐43WT‐Flag‐APEX untreated or treated with 0.5 mM NaAsO2 (SA). Immunoblotted with anti‐Lamin B1 (nuclear marker), anti‐Flag for TDP‐43WT‐Flag‐APEX and anti‐Tubulin (cytoplasmic marker) antibodies. (C) Western blot probed with streptavidin antibody showing the biotinylation profile of the cytoplasmic and nuclear fractions from neuro2A cells expressing TDP‐43WT‐APEX untreated (UNT) or treated with 0.5 mM NaAsO2 (SA). (C—cytoplasmic fraction, N—nuclear fraction, SP—streptavidin pulled down proteins). (D) Mean ± standard deviation of thresholded Manders coefficient over neuro2A cells untreated (UNT) or treated with 0.5 mM NaAsO2 for 1 h (SA), in the presence of GFP control or TDP‐43WT‐GFP. Statistical analysis: Kolmogorov–Smirnov t‐test, n = 3, D‐statistic = 0.5, ****p < 0.0001.
FIGURE 5
FIGURE 5
Ingenuity pathway analysis of the label‐free global proteomics on neuro2A cells expressing TDP‐43WT‐APEX treated with 0.5 mM NaAsO2 for 1 h revealed activation of the intrinsic pathway of apoptosis and ROS accumulation.
FIGURE 6
FIGURE 6
Venn diagram showing mutant TDP‐43A315T and TDP‐43G294V interactomes in primary mouse neurons (n = 3) and neuro2A (n = 4). Proteins in red or green present weaker or stronger affinity to TDP‐43. Underlined are proteins that were consistently altered for both mutations in either primary mouse neurons or Neuro2A cells.
FIGURE 7
FIGURE 7
(A) Immunofluorescence of primary cortical neurons transduced with TDP‐43 WT–Flag‐APEX and stained with Flag to detect TDP‐43 WT–Flag‐APEX, Streptavidin for biotin detection and DAPI (blue) for nuclei visualisation (B) Western blot showing the biotinylation profile of the cytosolic extract from primary neuronal culture transduced with TDP‐43WT‐Flag‐APEX or GFP as control (C) Immunofluorescence of mouse primary neuronal cells transduced with TDP‐43WT‐ and G294V‐APEX and stained with MAP2‐594 for neuron‐specific cytoskeletal visualisation, Flag to detect TDP‐43 –Flag‐APEX and DAPI (Blue) for nuclei visualisation.

References

    1. Agra Almeida Quadros, A. R. , Li Z., Wang X., et al. 2024. “Cryptic Splicing of Stathmin‐2 and UNC13A mRNAs Is a Pathological Hallmark of TDP‐43‐Associated Alzheimer's Disease.” Acta Neuropathologica 147, no. 1: 9. 10.1007/s00401-023-02655-0. - DOI - PMC - PubMed
    1. Ansar, M. , Ullah F., Paracha S. A., et al. 2019. “Bi‐Allelic Variants in DYNC1I2 Cause Syndromic Microcephaly With Intellectual Disability, Cerebral Malformations, and Dysmorphic Facial Features.” American Journal of Human Genetics 104, no. 6: 1073–1087. 10.1016/j.ajhg.2019.04.002. - DOI - PMC - PubMed
    1. Arai, T. , Hasegawa M., Akiyama H., et al. 2006. “TDP‐43 Is a Component of Ubiquitin‐Positive Tau‐Negative Inclusions in Frontotemporal Lobar Degeneration and Amyotrophic Lateral Sclerosis.” Biochemical and Biophysical Research Communications 351, no. 3: 602–611. 10.1016/j.bbrc.2006.10.093. - DOI - PubMed
    1. Arai, T. , Hasegawa M., Nonoka T., et al. 2010. “Phosphorylated and Cleaved TDP‐43 in ALS, FTLD and Other Neurodegenerative Disorders and in Cellular Models of TDP‐43 Proteinopathy.” Neuropathology 30, no. 2: 170–181. 10.1111/j.1440-1789.2009.01089.x. - DOI - PubMed
    1. Ayala, Y. M. , Pantano S., D'Ambrogio A., et al. 2005. “Human, Drosophila, and C.Elegans TDP43: Nucleic Acid Binding Properties and Splicing Regulatory Function.” Journal of Molecular Biology 348, no. 3: 575–588. 10.1016/j.jmb.2005.02.038. - DOI - PubMed

MeSH terms