. 2025 Jun;12(23):e2416419.
doi: 10.1002/advs.202416419. Epub 2025 May 14.

MTFR2-Mediated Fission Drives Fatty Acid and Mitochondrial Co-Transfer from Hepatic Stellate Cells to Tumor Cells Fueling Oncogenesis

Affiliations

MTFR2-Mediated Fission Drives Fatty Acid and Mitochondrial Co-Transfer from Hepatic Stellate Cells to Tumor Cells Fueling Oncogenesis

La Zhang et al. Adv Sci (Weinh). 2025 Jun.

Abstract

The tumor margin of hepatocellular carcinoma (HCC) is a critical zone where cancer cells invade the surrounding stroma, exhibiting unique and more invasive metabolic and migratory features compared to the tumor center, driving tumor expansion beyond the primary lesion. Studies have shown that at this critical interface, HCC cells primarily rely on fatty acid oxidation to meet their energy demands, although the underlying mechanisms remain unclear. This study demonstrates that activated hepatic stellate cells (HSCs) at the tumor margin play a pivotal role in sustaining the metabolic needs of HCC cells. Specifically, it is discovered that mitochondrial fission regulator 2 (MTFR2) in HSCs interacts with dynamin-related protein 1 (DRP1, a known mitochondrial fission machinery), preventing its lysosomal degradation, which in turn promotes mitochondrial fission. This MTFR2-driven mitochondrial fission enhances the transfer of both fatty acids and mitochondria to HCC cells, supplying essential metabolic substrates and reinforcing the mitochondrial machinery critical for tumor growth. The findings suggest that targeting MTFR2-driven mitochondrial fission may offer a novel therapeutic avenue for interfering with the metabolic crosstalk between tumor cells and the stromal niche.

Keywords: fatty acid transfer; hepatic stellate cell; hepatocellular carcinoma; mitochondrial dynamics; mitochondrial transfer.


Conflict of interest statement

The authors declare no conflict of interest.

Figures
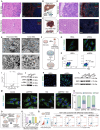
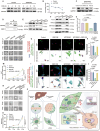
Figure 1
Figure 1
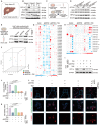
MTFR2‐mediated mitochondrial fission in aHSCs enhances HCC progression. A–D) Histological analysis of para‐tumor and tumor margin regions from HCC patient and mouse orthotopic HCC model. A) Hematoxylin and eosin (H&E) staining and immunofluorescence (IF) for COL1 (green), α‐SMA (red), and GFAP (purple, indicating HSC) in the margin area and para‐tumor tissue from an HCC patient. B) Schematic illustration indicating tissue collection sites for (A)—the margin area and para‐tumor tissue. C) Schematic for the tissue collection shown in (D), representing areas in a mouse orthotopic HCC model. D) H&E and IF staining of liver tissues to compare tumor margin and para‐tumor regions. Scale bars: 100 µm. E) Immunoelectron microscopy of GFAP indicating HSC from para‐tumor and tumor‐associated regions. Cyan arrow points to the gold particle bonded to GFAP. Scale bars: 1 µm. F) Diagram illustrating the experimental setup for activating HSCs. HSCs were treated with tumor‐conditioned media (TCM) for 72 h to induce activation. G,H) Confocal imaging and flow cytometry analysis of mitochondrial morphology of HSCs and aHSCs. G) IF staining of mitochondria using TOMM20 (green) in HSCs and aHSCs, indicating changes in mitochondrial distribution and morphology. Scale bars: 25 µm. H) Flow cytometry scatter plots showing side scatter (SSC) and forward scatter (FSC) for mitochondria of HSCs and aHSCs, highlighting mitochondrial size and granularity. The proportion of larger mitochondria (indicative of fused states) was quantified, with aHSCs showing a significant decrease compared to quiescent HSCs (n = 3). I) Volcano plot displaying the differential expression of mitochondrial dynamics‐related genes in quiescent HSCs and aHSCs. J) Western blot analysis of MTFR2, DRP1, and α‐SMA expression in HSCs and aHSCs. K) IF staining of MTFR2 (green) in HSCs and aHSCs, demonstrating increased MTFR2 expression in activated cells. Scale bars: 20 µm. L) Western blot results showing the effects of MTFR2 silencing (siMTFR2), the mitochondrial division inducer TA9, and the combination treatment on MTFR2 and DRP1 protein levels. GAPDH was used as the loading control. M,N) Confocal imaging and quantification of mitochondrial morphology under different conditions. Scale bars: 25 µm. Data are represented as mean ± SD (n = 10). O) Schematic of coculture experiments to assess the influence of aHSCs with different treatments to Huh7 cells. aHSCs treated with siMTFR2, TA9, or control conditions were cocultured with CellTrace green‐labeled Huh7 cells for 24 h, Huh7 was sorted out using flow cytometry. P) Cell viability of Huh7 sorted according to (O) (Data are represented as mean ± SD, n = 5, one‐way ANOVA was performed). Q) Flow cytometry apoptosis analysis of CellTrace green‐labeled Huh7 cells cocultured with differently treated aHSCs.
Figure 2
Figure 2
MTFR2‐mediated mitochondrial fission in aHSCs promotes fatty acid oxidation (FAO) in HCC cells and enhancing HCC progression. A) Schematic diagram of tumor tissue sampling. B) Western blot analysis of key mitochondrial metabolic enzymes in tumor (T) and tumor margin (M) areas as (A) suggesting from three HCC patients. C) Experimental design comparing Huh7 cells cultured alone versus cocultured with HSCs for 24 h. D) The protein level of key mitochondrial metabolic enzymes between Huh7 alone and Huh7 cocultured with aHSCs showing by western blot. E) CPT1A and CPT2 expression level in Huh7 cells cocultured with different treated aHSCs. F) Principal Component Analysis (PCA) plot showing metabolic profiles of three experimental groups. G) Heatmap shows differential FA contents. H) Heatmap shows relative difference in carnitine. I) Western blot analysis of CPT1A expression in Huh7 cells cocultured with aHSCs under different treatment conditions. J) Quantification of ATP production in Huh7 cells cocultured with aHSCs under different treatment conditions (Data are represented as mean ± SD, n = 3, one‐way ANOVA was performed). K) CCK‐8 cell proliferation assay in Huh7 cells cocultured with aHSCs under different treatment conditions (Data are represented as mean ± SD, n = 4, one‐way ANOVA was performed). L) Immunofluorescence staining of P‐H2AX (suggesting the damaged DNA, red). CellTrace green‐labeled Huh7 (green) cocultured with aHSCs under different treatment conditions. Scale bars: 100 µm.
Figure 3
Figure 3
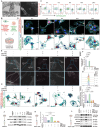
Activated HSCs enhance fatty acid (FA) synthesis and transfer to cancer cells, promoting proliferation. A) Western blot showing the ACC1 and CPT1A level of Huh7 cells and Huh7 cells cocultured with aHSCs (n = 3). B) Schematic of the experimental setup for FA chase pulse assay. HSCs were incubated in complete media (CM) with red fluorescent FA (Red C12) for 16 h (“pulse”). Following this, HSCs were cultured for an additional 72 h in CM or tumor‐conditioned media (TCM) without the labeled FA (“chase”). Mitochondria and lipid drops (LDs) were stained before imaging. C,D) FA localization was assayed as described in (A) and chased in CM or TCM. C) LDs were labeled using BODIPY 493/503 (gray) and mitochondria were labeled using MitoTracker Far Red (green). Scale bar = 25 µm. D) Relative cellular localization of Red C12 was quantified by Pearson's coefficient analysis (Data are represented as mean ± SD, n = 3, at least 50 cells analyzed per replicate, two‐way ANOVA was performed). E) Schematic representation of the coculture system used to track FA transfer from HSCs to Huh7 cells over various time points. BODIPY 558/568‐C12 labeled FA in HSCs and CellTrace green‐labeled Huh7 cells were used for tracking. F) Flow cytometry analysis showing the progressive transfer of FA from HSCs to Huh7 cells at different time points (0, 4, 8, 16, and 24 h). G) Western blot showing increased expression of ACC1 (Acetyl‐CoA carboxylase 1) in aHSCs, indicative of enhanced FA synthesis. H) Immunofluorescence (IF) images of FA pulse‐chase assay under different treatments. Scale bars: 25 µm. I,J) Flow cytometry analysis and its quantification further confirm the FA transfer to Huh7 cells when HSCs were treated with siMTFR2 or TA9 and Huh7 were treated with NTL (Data are represented as mean ± SD, n = 3, one‐way ANOVA was performed). K,L) IF 3D images reconstructed by Imaris and quantifications showing cocultured HSCs (Red C12‐labeled FA) and Huh7 cells (CellTrace green‐labeled) with differential treatment (Data are represented as mean ± SD, n = 6, at least 50 recipient cells analyzed per replicate, one‐way ANOVA was performed). Scale bar: 50 µm.
Figure 4
Figure 4
MTFR2‐driven mitochondrial fission in aHSCs facilitates mitochondrial transfer to Huh7 cells, boosting tumor progression. A) Transmission electron microscopy (TEM) (left panel, scale bar: 200 nm) and scanning electron microscopy (SEM) (right panel, scale bar: 10 µm) images showing direct contact between aHSCs and Huh7 cells. B–D) Mitochondrial transfer from aHSCs to Huh7 cells in various coculture times. Illustrate representation of the coculture system used to track mitochondrial transfer from HSCs (MitoTracker Far Red‐labeled) to Huh7 cells (CellTrace green‐labeled) at various time points (B). Flow cytometry of mitochondrial transfer efficiency (C). Spatiotemporal visualization of mitochondrial transfer (D). Upper panels: Maximum intensity projections (MIPs) of confocal Z‐stacks showing time‐dependent accumulation of aHSC‐derived mitochondria (red) in Huh7 cells (green). Lower panels: 3D surface rendering (Imaris) of recipient Huh7 cells. Orange arrow points to the mitochondria from aHSCs in TNTs toward to Huh7 cells. Scale bars: 10 µm. E–L) Coculture of Huh7 cells with aHSCs with different treatments. E) Scanning electron microscopy (SEM) images showing nanotubes between Huh7 cells and aHSCs (scale bar: 10 µm). F) Graphs showing the numbers of nanotubes connecting the Huh7 and HSCs, as calculated from the SEM images (Data are represented as mean ± SD, n = 7, one‐way ANOVA was performed). G) Histograms of fluorescence in Huh7 cells (CellTrace green‐labeled) showing the uptake of mitochondria from cocultured aHSCs. H) Representative 3D confocal image showing nanotube formation and MitoTracker‐labeled mitochondrial transfer (orange arrows) from aHSCs and the quantification (I) (Data are represented as mean ± SD, n = 6, at least 50 recipient cells analyzed per replicate, one‐way ANOVA was performed). Scale bar: 10 µm. J) Western blot analyzing the protein expression levels of MIRO1, WNT5A/B, and RAC1 in aHSCs with different treatments. K) Cell viability of Huh7 cells sorted by flow cytometry (Data are represented as mean ± SD, n = 4, one‐way ANOVA was performed). L) Analysis of the main protein levels of mitochondrial respiratory chain in Huh7 coculturing with various treatments of aHSCs.
Figure 5
Figure 5
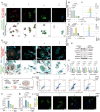
Complementary roles of FAs transfer and mitochondrial transport in supporting tumor cell survival. A) Representative confocal images of Huh7 cells cocultured with aHSCs under L‐778123 and NTL treatment. Maximum intensity projections (MIP) of confocal Z‐stacks showing Huh7 cells (CellTrace green, green) cocultured with aHSCs pre‐labeled with Red C12 fluorescent FA (red) (Upper panels). Corresponding 3D surface renderings (Imaris) of the boxed regions (Lower panels). Scale bars: 15 µm. B) Graph showing the fluorescence intensity of FAs in CellTrace green labeled Huh7 cells (Data are represented as mean ± SD, n = 6, at least 50 recipient cells analyzed per replicate, one‐way ANOVA was performed). C) Flow cytometry analysis of fluorescence intensity of FAs in FITC‐positive Huh7 cells. D) Confocal images showing the transportation of mitochondria from aHSCs to Huh7 cells. (Upper panels) MIP: Confocal Z‐stacks of cocultured MitoTracker‐labeled mitochondria in aHSCs (red) and CellTrace green‐labeled Huh7 cells (green), with ActinTracker (cyan) highlighting tunneling nanotubes (TNTs). (Lower panels) 3D surface reconstruction (Imaris). Scale bars: 15 µm. E) Quantification of fluorescence intensity from Figure D, showing the uptake of HSC‐derived mitochondria by Huh7 cells (Data are represented as mean ± SD, n = 6, at least 50 recipient cells analyzed per replicate, one‐way ANOVA was performed). F) Fluorescence histograms of Huh7 cells (labeled with CellTrace green) illustrating the mitochondria uptake from cocultured HSCs. G,H) Western blot analysis showing the expression of mitochondrial respiratory chain proteins in Huh7 cells following coculture with aHSCs and quantification (H) (Data are represented as mean ± SD, n = 3, two‐way ANOVA was performed). I) Schematic illustration of the experimental setup for coculturing aHSCs and Huh7 cells under different conditions, including L‐778123 to inhibit TNT formation and NTL to block Huh7 cell FA uptake. J,K) Flow cytometry analysis of apoptosis in Huh7 cells after coculture with HSCs under different treatments. Representative dual staining density plots (J) and quantification of total apoptotic cells (K) (Data are represented as mean ± SD, n = 3, one‐way ANOVA was performed). L,M) DNA damage assessment in Huh7 cells under differential treatments. Representative immunofluorescence images of P‐H2AX foci (red) in CellTrace green‐labeled Huh7 cells (green) with DAPI nuclear counterstain (blue) (L). Quantification of P‐H2AX mean fluorescence intensity in Huh7 cell nucleus (M) (Data are represented as mean ± SD, n = 3, at least 50 Huh7 cells analyzed per replicate, one‐way ANOVA was performed).
Figure 6
Figure 6
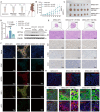
MTFR2 in HSCs drives tumor progression in vivo. A) Schematic illustration showing the experimental setup for tumor induction with MHCC‐97H cells and different HSC conditions. B) Graph depicting tumor volume over time for MHCC‐97H, MHCC‐97H + WT HSC, and MHCC‐97H + KD HSC groups (Data are represented as mean ± SD, n = 6, two‐way ANOVA was performed). C) Images of tumor nodules formed from MHCC‐97H cells co‐cultured with either wild‐type (WT) HSCs or knockdown (KD) HSCs. D) Analysis of the final tumor body weight ratio (%) (Data are represented as mean ± SD, n = 6, one‐way ANOVA was performed). E) Histological assessment via hematoxylin and eosin (H&E) staining, and immunohistochemical analysis of Ki67, α‐SMA, and COL1 in tumor sections. Scale bars: 100 µm. F) Immunofluorescence staining of various proteins (GFAP, MTFR2, DRP1, ACC1) in tumor sections, indicating expression patterns. Scale bars: 100 µm. G) Western blot analysis of CPT1A and CPT2 expression. H) IF staining of CPT1A in tumor tissues of different groups. GFP‐HSC was shown to distinguish HSCs. Scale bars: 50 µm. I) Fluorescent images showing the mito‐mcherry labeled mitochondria from HSCs in GPC3 positive MHCC‐97H cells (white arrows). Scale bars: 30 µm.
Figure 7
Figure 7
MTFR2‐dependent proliferation via DRP1. A,B) Cycloheximide (CHX) chase assay (n = 3), DRP1 levels were normalized to initial and shown in the graph (B). C) The expression level of DRP1 after different treatment: chloroquine (CQ, 50 × 10−6 m, 10 h) and MG132 (10 × 10−6 m, 10 h). D) Co‐immunoprecipitation (Co‐IP) assay to detect the interaction between MTFR2 and DRP1. E) Western blot analysis of the expression of MTFR2 and DRP1. F) Western blot analysis. G,H) Confocal images (upper panels: MIP; lower panels: 3D reconstruction, scale bar: 20 µm) showing the transportation of FAs from aHSCs with MTFR2 knocking down, DRP1 overexpression to Huh7 cells and quantification of the FA intensity in Huh7 cells (Data are represented as mean ± SD, n = 6, at least 50 recipient cells analyzed per replicate, one‐way ANOVA was performed). I,J) Mitochondrial transfer from aHSCs with different genetic manipulations to Huh7 cells. I) MIP images (upper panels) of confocal Z‐stacks and 3D surface rendering (Imaris) iamges (scale bar: 10 µm) showing aHSC‐derived mitochondria (mitoTracker, red) transferred to Huh7 cells (cellTrace green, green). J) Quantification of mean fluorescent intensity of mitoTracker in Huh7 cells (Data are represented as mean ± SD, n = 6, at least 50 recipient cells analyzed per replicate, one‐way ANOVA was performed). K) Cell viability of Huh7 cells cocultured with aHSCs under various conditions (Data are represented as mean ± SD, n = 4, one‐way ANOVA was performed). L,M) Representative images of tumor spheroid of Huh7 cells combined with aHSCs over times (Data are represented as mean ± SD, n = 6, two‐way ANOVA was performed) and calculation of the spheroid volume over times (M, Data are represented as mean ± SD, n = 6, one‐way ANOVA was performed). N,O) Dynamics of 3D tumor spheroid growth in MHCC‐97H/aHSC cocultures. N) Representative bright‐field images of spheroids in 6–9 d culture period (scale bars: 100 µm). O) Quantification of spheroid volume progression (Data are represented as mean ± SD, n = 6, two‐way ANOVA was performed) and calculation of the spheroid volume over times (O, Data are represented as mean ± SD, n = 6, one‐way ANOVA was performed). P) Simplified model depicting the role of MTFR2 in regulation of HCC progression. Within the tumor microenvironment, aHSCs exploit MTFR2 to coordinate a dual metabolic cascade that fuels HCC progression. MTFR2 upregulation in aHSCs triggers DRP1‐dependent mitochondrial fission. Subsequently, upregulating ACC1 facilitates FA synthesis and restoring FAs into LDs for transferring to HCC cells. At the same time, mitochondrial fission accelerates RAC1‐mediated remodeling of the actin cytoskeleton supports the structure and function of TNTs, and MIRO1 facilitating transporting mitochondria toward the forming TNTs. Consequently, HCC cells utilize the transferred FAs and mitochondria to enhance FAO, leading to increased ATP production.

References

    1. a) Yang X., Yang C., Zhang S., Geng H., Zhu A. X., Bernards R., Qin W., Fan J., Wang C., Gao Q., Cancer Cell 2024, 42, 180; - PubMed
    2. b) Faubert B., Solmonson A., DeBerardinis R. J., Science 2020, 368, 6487; - PMC - PubMed
    3. c) Ji A. L., Rubin A. J., Thrane K., Jiang S., Reynolds D. L., Meyers R. M., Guo M. G., George B. M., Mollbrink A., Bergenstråhle J., Larsson L., Bai Y., Zhu B., Bhaduri A., Meyers J. M., Rovira‐Clavé X., Hollmig S. T., Aasi S. Z., Nolan G. P., Lundeberg J., Khavari P. A., Cell 2020, 182, 497; - PMC - PubMed
    4. d) Yang M., Song X., Zhang F., Li M., Chang W., Wang Z., Li M., Shan H., Li D., Hepatology 2024, 81, 1452. - PubMed
    1. Wu L., Yan J., Bai Y., Chen F., Zou X., Xu J., Huang A., Hou L., Zhong Y., Jing Z., Yu Q., Zhou X., Jiang Z., Wang C., Cheng M., Ji Y., Hou Y., Luo R., Li Q., Wu L., Cheng J., Wang P., Guo D., Huang W., Lei J., Liu S., Yan Y., Chen Y., Liao S., Li Y., et al., Cell Res. 2023, 33, 585. - PMC - PubMed
    1. Sun Y., Wu P., Zhang Z., Wang Z., Zhou K., Song M., Ji Y., Zang F., Lou L., Rao K., Wang P., Gu Y., Gu J., Lu B., Chen L., Pan X., Zhao X., Peng L., Liu D., Chen X., Wu K., Lin P., Wu L., Su Y., Du M., Hou Y., Yang X., Qiu S., Shi Y., Sun H., et al., Cancer Cell 2024, 42, 135. - PubMed
    1. Sung J. Y., Cheong J. H., Cells 2022, 11, 2373.
    1. a) Saha T., Dash C., Jayabalan R., Khiste S., Kulkarni A., Kurmi K., Mondal J., Majumder P. K., Bardia A., Jang H. L., Sengupta S., Nat. Nanotechnol. 2022, 17, 98; - PMC - PubMed
    2. b) Borcherding N., Brestoff J. R., Nature 2023, 623, 283; - PMC - PubMed
    3. c) Melwani P. K., Pandey B. N., Biochim. Biophys, Acta, Rev. Cancer 2023, 1878, 189028. - PubMed

MeSH terms

LinkOut - more resources