. 2025 Aug;23(8):3094-3112.
doi: 10.1111/pbi.70102. Epub 2025 May 14.

GmFER1, a soybean ferritin, enhances tolerance to salt stress and root rot disease and improves soybean yield

Affiliations

GmFER1, a soybean ferritin, enhances tolerance to salt stress and root rot disease and improves soybean yield

Yanzheng Zhang et al. Plant Biotechnol J. 2025 Aug.

Abstract

The plant stress response mechanism is activated by biotic and abiotic stresses, but its continuous activation typically affects growth. The role of ferritin in regulating biomass accumulation has been extensively characterized in diverse plant species; however, the underlying mechanisms through which it contributes to salt stress tolerance and Fusarium resistance remain poorly understood. Here, we confirm that overexpression of ferritin leads to iron accumulation and Fe3+ sequestration in both aboveground and roots, activating the iron uptake and transport system. More importantly, GmFER1 enhances salt stress tolerance and Fusarium resistance. First, GmFER1 is localized in chloroplasts and significantly induced by salt stress and Fusarium infection. Overexpression of GmFER1 increases soybean yield per plant by enhancing net photosynthetic rate and Rubisco enzyme activity, without activating the reactive oxygen scavenging mechanism. Under salt stress, GmFER1 enhances resistance by improving the activities of SOD and CAT enzymes, as well as Na+ efflux capacity. Under Fusarium infection, GmFER1 enhances resistance to the pathogen by boosting antioxidant capacity. Moreover, iron-deficiency tests revealed that increased CAT and SOD activities under salt stress are linked to iron ions accumulation. Lastly, we analysed the effects of GmFER1 gene variation on salt tolerance, disease resistance and 23 agronomic traits related to yield and quality. Further analysis of GmFER1 gene variation revealed that the Hap2 haplotypes could potentially enhance salt resistance, disease resistance, pod number and oil content in soybean. Our research offers a new way to reduce growth penalties while boosting plant resistance to salt stress and Fusarium infection.

Keywords: Fe; NMT (non‐invasive micro‐test technology); ROS (reactive oxygen species); salt stress; soybean ferritin.


Conflict of interest statement

The authors declare that they have no conflict of interest.

Figures

Figure 1
Figure 1
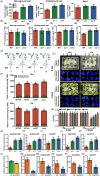
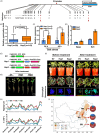
Analysis of the expression pattern and subcellular localization of GmFER1. (A–G) Expression patterns of the GmFER1 gene analysed under 50, 100 and 150 mM NaCl, 100 mM ABA, Fusarium, 1 mM Fe3+‐EDTA and 50 μmol methyl violet (MV) by qRT‐PCR. Three‐week‐old wild‐type (WT) soybeans were transferred to different treatments. The expression level shows the comparison between the treated group and the non‐treated group. The gene expression in 0 days is set as 1, and the others are adjusted accordingly for each gene. (H) GmFER1 tissue specificity analysis in soybean pod, root, leaf, stem and seed by qRT‐PCR. The gene expression in the pod is set as 1, and the others are adjusted accordingly for each gene. (A‐H) GmACTIN4 was used as an internal reference gene. The data shown are presented as the mean ± standard error (n = 3). (I–K) The GmFER1 gene promoter expression pattern analysed by GUS staining in proGmFER1:GUS transgenic Arabidopsis. (I) Tissue specificity analysis of the GmFER1 gene promoter in different growth stages: (a) two‐leaf stage, (b) four‐leaf stage, (c) seedling stage, (d) breaking period, (e) pod and (f) seed. (J) Expression pattern of the GmFER1 gene promoter analysed under water, 150 mM NaCl and 100 mM ABA. Three‐week‐old proGmFER1:GUS transgenic Arabidopsis was transferred to different treatment conditions under long‐day, and samples were taken for GUS staining at 2 and 24 h after treatment. (K) Measurement of GUS activity in (J) for 24 h. The data shown are presented as the mean ± standard error (n = 3). (L) Subcellular localization of the GmFER1 protein in Arabidopsis protoplasts, bar = 10 μm. Bright represents a brightfield signal; YFP represents yellow fluorescence signal; Chl represents chloroplast self‐luminescence; Merge represents an overlay signal. Asterisks indicate a significant difference compared with the corresponding controls (Student's t‐test: **P < 0.01, 0.01 < *P < 0.05).
Figure 2
Figure 2
Overexpression of GmFER1 increases Fe3+ accumulation in soybeans. (A) Iron content in aboveground, underground parts and seeds of GmFER1‐ox and WT plants. Four‐week‐old GmFER1‐ox and WT plants and mature seeds were used to measure iron content, n = 3. (B) Fe2+ and Fe3+ content in aboveground and underground in GmFER1‐ox and WT plants. Four ‐week‐old GmFER1‐ox and WT plants were used to measure iron content, n = 3. (C) Schematic diagram of grafting combinations. 1:WT (aboveground)/WT (underground); 2: WT (aboveground)/GmFER1‐ox (ox, underground); 3: GmFER1‐ox (ox, aboveground)/WT (underground); 4: GmFER1‐ox (ox, aboveground)/GmFER1‐ox (ox, underground). (D) The phenotype of the grafted plants under iron and iron‐deficiency conditions was observed. Twenty‐day‐old grafted plants were transferred to iron‐deficient and normal Hoagland solution. Photographs were taken at 0 and 4 days after treatment. (E) Fv/Fm is measured in (D) under iron and iron‐deficiency conditions for 4 days, n = 5. (F) The total iron content in the aboveground and belowground parts of the grafted plants was measured under iron and iron‐deficiency conditions for 7 days, n = 3. Lowercase letters indicate significant differences (one‐way ANOVA test). (G‐K) The expression levels of GmbHLH300, GmbHLH57, GmIRT1, GmFRO2 and GmVIT1 were measured in the roots of overexpressing and wild‐type plants using qRT‐PCR. GmACTIN4 was used as an internal reference gene. The data shown are presented as the mean ± standard error (n = 3). (L) The total iron content was measured in the hairy roots of GmFER1‐i and EV transgenic plants. Four‐week‐old GmFER1‐i and EV transgenic hairy roots were used to measure iron content with iron conditions. (M–Q) The expression levels of GmbHLH300, GmbHLH57, GmIRT1, GmFRO2 and GmVIT1 were measured in the transgenic hairy roots of GmFER1‐i and EV through qRT‐PCR. GmACTIN4 was used as an internal reference gene. The data shown are presented as the mean ± standard error (n = 6). Values represent the means of three biological replicates. Asterisks indicate significant differences compared with the WT (Student's t‐test: 0.01 < *P < 0.05, **P < 0.01).
Figure 3
Figure 3
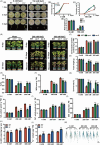
GmFER1 overexpression increases soybean yield. (A) The ecotypes of GmFER1‐ox and WT plant. Plants that were 4 weeks old under long‐day conditions were used for phenotypic observation. (B) Light response curves of WT and GmFER1‐ox plants. The CO2 concentration is 400 μmol. Data are presented as the mean ± standard error (n = 3). (C) CO2 response curves of WT and GmFER1‐ox plants. The light intensity is 1500 μmol mol−1. Data are presented as the mean ± standard error (n = 3). (D) The Rubisco enzyme activity was measured in the leaves of WT and GmFER1‐ox plants. Data are presented as the mean ± standard error (n = 6). (E) The mature phenotypes of WT and GmFER1‐ox plants. (F) Plant height. (G) Number of nodes. (H) Pod number per plant. (I) Seed number per plant. (J) Branch number. (K) 100‐seed weight. (L) Yield per plant. (M) Protein content. (N) Oil content. (O) Daidzein content, glycitein content, genistein content and isoflavone content. Data are presented as the mean ± standard error (n = 10). Values represent the means of three biological replicates. Asterisks indicate significant differences compared with the WT (Student's t‐test: 0.01 < *P < 0.05, **P < 0.01).
Figure 4
Figure 4
GmFER1 enhances salt stress resistance in soybean by improving the ROS scavenging ability. (A) Germination of GmFER1‐ox and WT soybean under 0 and 150 mM NaCl. (a) germination phenotypes of GmFER1‐ox and WT soybean seeds after 1, 2 and 3 days under 0 and 150 mM NaCl. (b, c) Statistics of seed germination rate in (a). Data are presented as the mean ± standard error (n = 50). (d) Statistical analysis of root length after 3 days of 0 and 150 mM NaCl treatment in (a). Data are presented as the mean ± standard error (n = 10). (B) Phenotypes of GmFER1‐ox and WT plants observed after exposure to 0, 200, and 300 mM NaCl for 0, 15 and 22 days. (C–F) Protein carbonyl content, fresh weight, Fv/Fm, and MDA content measured in the leaves of WT and GmFER1‐ox seedlings in (B) for 7 or 15 days, n = 10. (G) The survival rates of WT and GmFER1‐ox plants were recorded, n = 12. (H–J) The H2O2 content, CAT, and SOD enzyme activity were measured in the roots of WT and GmFER1‐ox seedlings in (B) for 7 days, n = 10. (K) The Fe‐SOD enzyme content was measured in the roots of WT and GmFER1‐ox seedlings in (B) for 7 days. (L) The Fe3+ content was measured in the roots of WT and GmFER1‐ox seedlings in (B) for 7 days, n = 3. (M) Prussian blue stain of roots in WT and GmFER1‐ox seedlings in (B) for 7 days. Data are presented as the mean ± standard error. Asterisks indicate a significant difference compared with the WT (Student's t test: **P < 0.01).
Figure 5
Figure 5
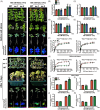
Iron ion is essential for CAT and SOD enzyme activity in GmFER1‐ox plants under salt stress. (A) Phenotypes of GmFER1‐ox and WT plants observed at 0 and 200 mM NaCl for 0, 3 and 7 days under iron and iron‐deficiency conditions. The red box shows the chlorosis of GmFER1‐ox and WT plants under iron‐deficiency conditions. (B–E) fresh weight and root length measured in WT and GmFER1‐ox seedlings in (A) for 5 and 7 days. Data are presented as the mean ± standard error (n = 10). (F, G) Light response curve measured in the leaves of WT and GmFER1‐ox seedlings in (A) for 0 and 5 days. Data are presented as the mean ± standard error (n = 3). (H–K) CAT and SOD enzyme activity were measured in the roots of WT and GmFER1‐ox seedlings in (A) for 0 and 5 days. Data are presented as the mean ± standard error (n = 3). Asterisks indicate a significant difference compared with the corresponding controls (Student's t‐test: **P < 0.01, 0.01 < *P < 0.05).
Figure 6
Figure 6
Phenotypes of EV and GmFER1‐i hairy roots under salt stress with iron. (A) Phenotypes of GmFER1‐i and EV plants observed at 0 and 100 mM NaCl for 0 and 5 days. (B–G) Fv/Fm, fresh weight, chlorophyll content, H2O2 content, carbonylation protein levels, and CAT enzyme activity measured in EV and GmFER1‐i seedlings in (A) for 0 and 3 or 5 days under salt stress. Data are presented as the mean ± standard error (n = 10). Asterisks indicate a significant difference compared with the corresponding controls (Student's t‐test: **P < 0.01).
Figure 7
Figure 7
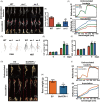
GmFER1 enhances resistance to Fusarium. (A) Typical infection phenotypes of GmFER1‐ox and WT soybean for 7 days after inoculation with Fusarium under iron condition. (B) Lesion size in the roots of the GmFER1ox and WT lines for 7 days after inoculation with Fusarium under iron conditions. Data are presented as the mean ± standard error (n = 10). (C) The spectral values of the roots of GmFER‐ox and WT plants were measured by spectrometer for 7 days after inoculation with Fusarium under iron conditions. Data are presented as the mean ± standard error (n = 5). (D) DAB and NBT staining of soybean root from WT and GmFER1‐ox seedlings in (A) for 5 days. (E, F) The CAT and SOD enzyme activity was measured in the leaves of WT and GmFER1‐ox seedling roots in (K) for 5 days. The data shown are presented as mean ± standard errors (n = 10). (G) The phenotypes of GmFER1‐i and EV plants were transferred to diseased soil for 7 days under iron conditions. (H, I) The root weight and reflectivity value were measured in EV and GmFER1‐i seedlings in (G) for 7 days under iron conditions. The data shown are presented as mean ± standard errors (n = 10). Asterisks indicate a significant difference compared with the corresponding controls (Student's t‐test: **P < 0.01).
Figure 8
Figure 8
GmFER1 enhances resistance to salt stress by increasing Na+ efflux. (A) Na+ content in WT and GmFER1‐ox plants measured, (B) or EV and GmFER1‐i hairy root compound plants measured with 0 and 200 mM NaCl treatment for 3 days. Data are presented as the mean ± standard error (n = 5). (C) Measurement of Na+ efflux under salt stress by NMT. (C) Na+ efflux detected in the root elongation zones of WT and GmFER1‐ox plants. (D) Na+ efflux detected in the root elongation zones of EV and GmFER1‐i plants. Data are presented as the mean ± standard error (n = 3). (E) Expression level analysis of GmSOS1 in soybean roots of GmFER1‐ox and WT plants, (F) or in soybean roots of EV and GmFER‐i plants under 0 and 200 mM NaCl for 3 days. Data are presented as the mean ± standard error (n = 3). Asterisks indicate a significant difference compared with the corresponding controls (Student's t‐test: **P < 0.01).
Figure 9
Figure 9
Natural variation of the GmFER1 gene promoter affects the salt tolerance in soybean. (A) Haplotype of the GmFER1 gene promoter in cultivated soybean. (B) Comparison of the box chart results for ST‐GR of the Hap1 and Haap2 haplotypes. (C) Comparison of the relative expression of GmFER1 between the Hap1 and Hap2 haplotypes. (D) Promoter activity of GmFER1 haplotypes by transient expression in tobacco leaves. The LUC reporter gene was driven by each haplotype, and the luminescence intensity was examined. ‘Salt’ indicates 200 mM NaCl treatment for 16 h. Bars indicate the SD (n = 5), and asterisks indicate a significant difference compared with the corresponding control (*P < 0.05; **P < 0.01). (E) Schematic diagram of the carrier EV, GmFER1 Hap1 :GmFER1‐Flag‐35S:GFP (Hap1) and GmFER1Hap2:GmFER1‐Flag‐35S:GFP (Hap2) vector. (F, G) Phenotype of EV, GmFER1Hap1:GmFER1‐Flag‐35S:GFP (Hap1), and GmFER1Hap2:GmFER1‐Flag‐35S:GFP (Hap2) soybean hairy roots under 200 mM NaCl. (H) Analysis of nucleotide diversity within the GmFER1 gene locus in the soybean genome. (I) The evolution of GmFER1 gene haplotypes is related to the geographical distribution of soybean accessions.

References

    1. Aoki, T. , O'Donnell, K. and Scandiani, M.M. (2005) Sudden death syndrome of soybean in South America is caused by four species of Fusarium: Fusarium brasiliense sp. nov., F. cuneirostrum sp. nov., F. tucumaniae, and F. virguliforme . Mycoscience 46, 162–183.
    1. Begara‐Morales, J.C. , Sánchez‐Calvo, B. , Chaki, M. , Mata‐Pérez, C. , Valderrama, R. , Padilla, M.N. , López‐Jaramillo, J. et al. (2015) Differential molecular response of monodehy droascorbate reductase and glutathione reductase by nitration and S‐nitrosylation. J. Exp. Bot. 66, 5983–5996. - PMC - PubMed
    1. Bradbury, P.J. , Zhang, Z. , Kroon, D.E. , Casstevens, T.M. , Ramdoss, Y. and Buckler, E.S. (2007) TASSEL: software for association mapping of complex traits in diverse samples. Bioinformatics 23, 2633–2635. - PubMed
    1. Briat, J.‐F. and Lobréaux, S. (1997) Iron transport and storage in plants. Trends Plant Sci. 2, 187–193.
    1. Briat, J.‐F. , Dubos, C. and Gaymard, F. (2015a) Iron nutrition, biomass production, and plant product quality. Trends Plant Sci. 20, 33–40. - PubMed

MeSH terms

LinkOut - more resources