. 2025 Jun 24;207(6):e0007725.
doi: 10.1128/jb.00077-25. Epub 2025 May 14.

Calcium signaling controls early stage biofilm formation and dispersal in Vibrio fischeri

Affiliations

Calcium signaling controls early stage biofilm formation and dispersal in Vibrio fischeri

Jeremy J Esin et al. J Bacteriol. .

Abstract

Bacterial dispersal from a biofilm is presently the least-studied step of the biofilm life cycle. The symbiotic bacterial species Vibrio fischeri is a model organism for studying biofilms relevant to a eukaryotic host; however, methodology is lacking to readily study the dispersal of this microbe from biofilms formed in the lab. Here, we adapted a time-lapse assay to visualize biofilm dispersal by V. fischeri. We observed biofilm formation and dispersal for multiple V. fischeri isolates, which displayed a variety of biofilm architecture phenotypes and dispersal dynamics. We then investigated V. fischeri strain ES114 using genetic tools and mutants available for this strain. ES114 exhibited calcium-dependent biofilm formation followed by a rapid (less than 10 min) coordinated dispersal event that occurred approximately 5 h from the experimental start. Biofilm dispersal was largely independent of the dispersal-promoting protease encoded by lapG. Although we found no role under our conditions for either biofilm formation or dispersal for several other factors including polysaccharides and autoinducers, we determined that biofilm formation was enhanced, and dispersal was delayed, with increased concentrations of calcium. Furthermore, biofilm formation depended on the calcium-responsive diguanylate cyclase (DGC) CasA, and dispersal could be modulated by overexpressing CasA. Our work has thus developed a new tool for the V. fischeri field and uncovered a key role for calcium signaling and c-di-GMP in early biofilm formation and dispersal in V. fischeri.

Importance: Biofilm formation and dispersal are critical steps in both symbiotic and pathogenic colonization. Relative to biofilm formation, the process of dispersal in the model symbiont Vibrio fischeri, and other bacteria, is understudied. Here, we adapted an imaging assay to study early biofilm formation and the dispersal process in V. fischeri. We demonstrated that our assay can quantify biofilm formation and dispersal over time, can reveal phenotypic differences in diverse natural wild-type isolates, and is sensitive enough to investigate the impact of environmental factors. Our data confirm that calcium is a potent biofilm formation signal and identify the diguanylate cyclase CasA as a key regulator. This work leads the way for more in-depth research about unknown mechanisms of biofilm dispersal.

Keywords: Vibrio fischeri; biofilms; dispersal; quorum sensing; video microscopy.


Conflict of interest statement

The authors declare no conflict of interest.

Figures

Fig 1
Fig 1
Wild-type squid and fish isolates have diverse biofilm phenotypes. Representative differential interference contrast microscopy (DIC) images from 1–8 h of a 10-h experiment of various wild-type V. fischeri isolates. Experiment performed in tTBS containing 10 mM CaCl2 from the point of plate inoculation in room temperature chambers (25°C). Images displayed are 91 µm wide. The images are representative of n = 3 biological replicates. The low-contrast vertical banding in images is an artifact from the DS-Qi2 CMOS camera.
Fig 2
Fig 2
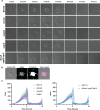
Early aggregation and attachment are independent of SYP, cellulose, and LapV. (A) Representative DIC images from 1–8 h of a 10-h experiment performed as in Fig. 1. (B) Schematic of steps taken in the ImageJ macro used to quantify biofilm area. See text for details. (C) Quantification of biofilm area as measured by time-lapse microscopy from a representative experiment for ES114 and mutants defective for SYP (∆sypQ), cellulose (∆bcsA), or LapV surface adhesin (∆lapV-1500), or a triple mutant deficient for all 3 (∆bcsA ΔsypQ ΔlapV-1500). Images displayed are 46 µm wide. The images are representative of n = 3 biological replicates, and the quantifications include n = 15–25 biofilms per condition, ± Standard deviation (SD) (Shaded).
Fig 3
Fig 3
V. fischeri dispersal from early biofilms is largely independent of lapG. (A) Representative DIC images of 1–8 h of a 10 h experiment, performed as in Fig. 1, comparing ES114 with a strain deficient for LapG (∆lapG). (B) Quantification from a representative experiment via ImageJ macro. Images displayed are 46 µm wide. The images are representative of n = 3 biological replicates, and the quantifications include n = 15–25 biofilms per condition, ± SD (Shaded).
Fig 4
Fig 4
Coordinated dispersal is independent of autoinducer signaling. (A) Representative DIC images of 1–8 h of a 10 h experiment, performed as in Fig. 1, comparing ES114 with a strain deficient for all three autoinducers (luxI-frameshift ∆ainS luxS). (B) Quantification from a representative experiment via ImageJ macro. Images displayed are 46 µm wide. The images are representative of n = 3 biological replicates, and the quantifications include n = 15–25 biofilms per condition, ± SD (Shaded).
Fig 5
Fig 5
Calcium is required for aggregate formation. Representative DIC images of 1–8 h of a 10 h experiment comparing ES114 in tTBS media with 10 mM added calcium to ES114 in tTBS without added calcium. Other than the inclusion of media that lacks added calcium, the experiment was performed as in Fig. 1. Images displayed are 46 µm wide. n = 3 biological replicates.
Fig 6
Fig 6
Calcium time of addition and concentration. (A) Representative DIC images of 1–8 h of a 10 h experiment comparing ES114 with 10 mM calcium added just prior to imaging and ES114 that was exposed to 10 mM calcium in the 1 h incubation period. (B) Quantification from a representative panel A experiment via ImageJ macro. (C) Representative DIC images of 1–8 h of a 10 h experiment comparing ES114 in three calcium concentrations (10 mM, 20 mM, and 40 mM). (D) Quantification of a representative experiment for panel C. Images displayed are 46 µm wide. The images are representative of n = 3 biological replicates, and the quantifications include n = 15–25 biofilms per condition, ± SD (Shaded). The low-contrast vertical banding in panel A is an artifact from the DS-Qi2 CMOS camera.
Fig 7
Fig 7
Chelation of free calcium induces dispersal. (A) Representative DIC images of 1–8 h of a 10 h experiment comparing ES114 in tTBS with 10 mM added calcium to ES114 in tTBS with 10 mM added calcium that was either given a vehicle control (VC) of 100 µL saltwater (340 mM NaCl) or 100 µL saltwater containing 10 mM EGTA. The EGTA was added immediately after the 3 h time point was captured. (B) A 6 h growth curve of ES114 in tTBS conditions with 10 mM added calcium and either no addition or 10 mM EGTA added at time zero. A non-linear regression was fitted to each condition using the exponential growth equation. The regression curves were compared to each other and found to not be significant. Images displayed are 46 µm wide. n = 3 biological replicates. The low-contrast vertical banding in panel A is an artifact from the DS-Qi2 CMOS camera.
Fig 8
Fig 8
Calcium sensing is required for biofilm attachment and formation. (A) Representative DIC images of 1–8 h of a 10 h experiment comparing ES114 with 10 mM calcium to a strain deleted for casA (∆casA) or a strain complemented for casA (∆casA IG casA). (B) Quantification from a representative panel A experiment via ImageJ macro. (C) Representative DIC images of 1–8 h of a 10 h experiment comparing a CasA overexpressing strain (IG casA) in tTBS media with increasing concentrations of calcium (10 mM, 20 mM, and 40 mM). (D) Quantification from a representative panel C experiment via ImageJ macro. (E) Representative DIC images of 1–8 h of a 10 h experiment comparing ES114 to a strain complemented for casA (∆casA IG casA) or a complemented point mutant of casA that cannot produce c-di-GMP (∆casA IG casA-G410A). (F) Quantification from a representative panel E experiment via ImageJ macro. Images displayed are 46 microns wide. The images are representative of n = 3 biological replicates, and the quantifications include n = 15–25 biofilms per condition, ± SD (Shaded).

Similar articles

References

    1. Hall-Stoodley L, Costerton JW, Stoodley P. 2004. Bacterial biofilms: from the natural environment to infectious diseases. Nat Rev Microbiol 2:95–108. doi: 10.1038/nrmicro821 - DOI - PubMed
    1. Flemming HC, Wingender J. 2010. The biofilm matrix. Nat Rev Microbiol 8:623–633. doi: 10.1038/nrmicro2415 - DOI - PubMed
    1. Tolker-Nielsen T. 2015. Biofilm development. Microbiol Spectr 3:MB–0001. doi: 10.1128/microbiolspec.MB-0001-2014 - DOI - PubMed
    1. Rumbaugh KP, Sauer K. 2020. Biofilm dispersion. Nat Rev Microbiol 18:571–586. doi: 10.1038/s41579-020-0385-0 - DOI - PMC - PubMed
    1. Fung BL, Esin JJ, Visick KL. 2024. Vibrio fischeri: a model for host-associated biofilm formation. J Bacteriol 206:e0037023. doi: 10.1128/jb.00370-23 - DOI - PMC - PubMed

MeSH terms

LinkOut - more resources