. 2025 Jun 17;99(6):e0230824.
doi: 10.1128/jvi.02308-24. Epub 2025 May 14.

Dissection of the global responses of mandarin fish pyloric cecum to an acute ranavirus (MRV) infection reveals the formation of serositis and then ascites

Affiliations

Dissection of the global responses of mandarin fish pyloric cecum to an acute ranavirus (MRV) infection reveals the formation of serositis and then ascites

Wenfeng Zhang et al. J Virol. .

Abstract

Mandarin fish ranavirus (MRV), a new member of the species Ranavirus micropterus1, sharing over 98% whole-genome nucleotide identity with the well-known largemouth bass virus (LMBV), is a distinct member of the genus Ranavirus within the family Iridoviridae. Our recent work showed that acute MRV infection predominantly affects the pyloric cecum, a critical visceral organ in mandarin fish, and was hypothesized to drive the characteristic external clinical sign of severe ascites. In this study, we reveal that acute MRV infection initially targets the serosal layer of the pyloric cecum of mandarin fish, leading to rapid progression into fibrinous serositis characterized by serosal hypertrophy, fibrosis, hyperemia, edema, and tissue adhesions. Using single-cell RNA sequencing, we dissect the cellular composition of epithelial, immune, and stromal populations, identifying significant enrichment of macrophages and granulocytes, alongside T and natural killer cells, as key mediators of acute cytokine and inflammatory responses. Then, robust experimental evidence demonstrates that MRV infects specific immune cell subsets of T and B cells and stromal cells of fibroblasts, myofibroblasts, endothelial cells, and pericytes, resulting in upregulation of genes and pathways associated with extracellular matrix (ECM) formation, collagen biosynthesis, and vascular remodeling in the hyperplastic serosal zone. Additionally, both host-derived type V collagens and MRV-encoded collagens are implicated in ECM formation in the hypertrophic serosa. Collectively, this study provides a comprehensive single-cell resolution analysis of the pyloric cecum's response to acute MRV infection and highlights virus-driven serositis as the underlying cause of severe ascites in mandarin fish.IMPORTANCEThe pyloric cecum is a vital digestive and immune organ in many bony fish species, including the mandarin fish, a carnivorous species with an exceptionally developed pyloric cecum comprising 207-326 ceca per individual. While MRV/LMBV infects various fish species, severe ascites is uniquely observed in infected mandarin fish. This study demonstrates that acute MRV infection induces fibrinous serositis in the pyloric cecum, characterized by hyperemia, edema, and hyperplasia, ultimately resulting in ascites and mortality. Leveraging single-cell RNA sequencing, we provide a detailed landscape of the cell types affected or involved in the inflammatory response, revealing their roles in the pathogenesis of serositis. These findings advance our understanding of MRV-induced pathology and its species-specific manifestations.

Keywords: ScRNA transcription; ascites syndrome; mandarin fish ranavirus (MRV); pyloric cecum; serositis.


Conflict of interest statement

The authors declare no conflict of interest.

Figures

Fig 1
Fig 1
The primary infection site of MRV in the pyloric caeca of mandarin fish. (A) The autopsy of MRV-infected mandarin fish. (A1) and (A3), the diseased fish was characterized by severe hemorrhage in pyloric ceca. (A2) Healthy fish with normal pyloric ceca (A4). (B) Tissue distributions of MRV in various tissues by absolute RT-qPCR (n = 3). The highest viral load was determined in infected pyloric ceca. Statistical significance between pyloric ceca and liver (the second highest viral load) groups is denoted by ****, where the P value was < 0.0001 using one-way ANOVA and Tukey’s post hoc test. n,s, no significant. (C) Localization of MRV detected by immunohistochemistry (IHC). The strongest MRV-positive signals were found in infected pyloric ceca. Scale bars, 200 µm. (D) Schematic drawing of the cross-section of mandarin fish pyloric ceca. MUC, mucosa; SER, serosa. (E) Histo-immunofluorescence (HIF) of mandarin fish pyloric ceca infected with MRV. Numerous red fluorescence signals indicate MRV-infected cells by anti-MRV mAb 1C4. The stars indicate the digestive cavity. Scale bars of healthy fish and infected fish (left), 200 µm. Scale bars of infected fish (right), 20 µm. (F) Immuno-histochemistry (IHC) staining of MRV-infected pyloric ceca. Arrows indicate the sites stained by anti-MRV mAb 1C4. The serosa layer was observed as the site with the highest viral load in the pyloric cecum. Scale bars of healthy and infected fish (left), 1 mm. Scale bars of infected fish (right), 50 µm.
Fig 2
Fig 2
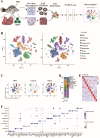
Cell sorting and categorization of cell types of mandarin fish pyloric ceca. (A) Overall strategy for cell sorting and single-cell sequencing data analysis. (B) The tSNE plot clustering of cells (left): different cell clusters are color-coded; The tSNE plot showed the expression of pan marker genes in distinct cell clusters (right), and the gene expression level is color-coded. (C) The tSNE plots align the clusters between control and MRV-infected mandarin fish. (D) Bar plots showing the proportion of each cluster in control and MRV-infected groups. (E and F) Average expression level and prevalence of selected major markers used to annotate the major cell types. Heatmap (E) and dot plot (F) of the expression of the marker genes in each cell type.
Fig 3
Fig 3
Subtypes of epithelial cells and stromal cells in the pyloric ceca. (A) Re-clustering 4,500 epithelial cells of pyloric cecum identified 12 subclusters, shown in the UMAP space. (B) Average expression levels and prevalence of major markers used to identify non-secretory epithelial cells and secretory cells of the 12 epithelial cell subtypes. (C) H&E staining and IHC staining of mucosa using anti-MRV mAb; The lower left image in Fig. 3C is a magnified region from the whole-slide IHC image of Fig. 1F (the center image), highlighting the absence of MRV signals in the digestive tract. (D) The UMAP plot shows the five stromal cell subtypes identified in pyloric ceca. Different stromal cell subtypes are color-coded. (E) Violin plots showing the average expression level and prevalence of selected major markers used to annotate the stromal cell types. (F) Bar plots showing the proportion of each cluster in the stromal cells from control and MRV-infected groups. (G) H&E and IHC of mandarin fish pyloric ceca infection with MRV. The arrows indicate the hypertrophic serosa filled with microvessels. Scale bars, 100 µm.
Fig 4
Fig 4
Immunological features of immune cell subsets upon MRV infection. (A) The tSNE plot shows the seven immune cell subtypes identified in pyloric ceca. Different immune cell subtypes are color-coded. (B and C) average expression level and prevalence of selected major markers used to annotate the immune cell types. Violin map (B) and dot plot (C) of the expressions of the marker genes in each immune cell type. (D) Bar plots showing the proportion of each immune cell cluster in control and MRV-infected groups. (E) Violin plot showing the expression of granulocytes (ALOXE3) and macrophage/monocyte (CSF1RB) marker across the seven immune cell clusters. (F) FISH images showing the expression of granulocytes subtype marker ALOXE3 (Up) and macrophage/monocytes subtype marker CSF1RB (Down), Scale bar, 100 µm. (G) Heatmap of cytokine expressions among seven immune cell subtypes. (H) Boxplots of cytokine expressions based on scRNA-seq and RT-qPCR profiling for healthy control and MRV-infected mandarin fish. Data are expressed as means ± SD (**P < 0.01 or ***P < 0.001).
Fig 5
Fig 5
Spatial location of infected pyloric ceca single cells. (A) UMAP plot displaying dimensionality reduction clustering analysis of MRV-infected pyloric ceca by spatial transcriptomics. (B) Spatial transcriptomics data showing the distribution of cell clusters in MRV-infected pyloric ceca in the pathological section (partial). The red circle outlines the individual pyloric ceca. (C) Histopathologic microscan of the section of MRV-infected pyloric caeca. The H&E image and the ST are derived from the same tissue section. The red box indicates the magnified area. (D) Expression of selected cell markers identified by scRNA-seq in hyperplastic serosa. The representative views indicated by the triangular arrows are shown in the enlarged image on the right. (E) IF staining of MRV (green) in an adjacent section, scale bar, 1 mm.
Fig 6
Fig 6
Colocalization of MRV signals and specific markers. Dual-color IF and FISH staining to validate the selected marker and MRV signal. (A) Expression levels of selected markers used to identify the selected cell subtypes. (B) Dual-color IF staining to validate colocalization of the the selected markers IgM, CD3, HSPb1, ACTA2 (green) and MRV (red). The nucleus was stained with DAPI (blue), Scale bar, 50 µm. (C) Dual-color FISH and IF staining to validate the colocalization of the selected markers CDH5, ALOXE3, CSF1RB, HBβ (pink), and MRV (green). Selected markers were identified by the corresponding probe and signal probe (CY5). MRV was identified by anti-MRV monoclonal antibody and secondary goat anti-mouse IgG antibody coupled with AlexaFluor 488 (green). The nucleus was stained by DAPI (blue), Scale bar, 50 µm. The arrows indicate the colocalization of cells. (D) Transmission electron micrograph of five kinds of target cells, BC: blood cell, EC: endothelial cell, BM: basement membrane, CF: collagenous fiber, N: nucleus, Mit: mitochondria, ER: endoplasmic reticulum. The arrows indicated the virions. The scale is shown in the figure.
Fig 7
Fig 7
Serosal fibrosis after MRV infection. (A) HE, IHC, IF, and MASSON staining observation of pyloric ceca serosa of MRV-infected mandarin fish at 1, 3, and 5 dpi, scale bar, 10 µm; black arrows indicate the microvessels; red arrows indicate the MRV virion signals. Scale bar, 20 µm. (B) Transmission electron micrograph of MRV-infected pyloric ceca; (B left) depicts a comprehensive cross-section of microvessels, exhibiting virion-infected endothelial cells and pericytes; scale bar, 2 µm; (B middle) shows a collagen-based vascular lumen devoid of endothelial cells, filled with blood cells, and scattered surrounded by virions; scale bar, 5 µm; (B right) showcases intact and distinct mucosal microvessels due to the absence of viral infection in the mucosal layer; scale bar, 5 µm. BC: blood cell, EC: endothelial cell, BM: basement membrane, CF: collagenous fiber, N: nucleus. Arrowheads indicated the virions. (C) FISH data showing the localization of virions (green) and CDH5-positive endothelial cells within the microvascular-like lumen. The arrows indicate the shed endothelial cells. Scale bar, 20 µm. (D) The relative mRNA levels of eleven host-encoded collagen (left) and four MRV-encoded collagen-like proteins (right) by RT-qPCR. (E) Colocalization of MRV (red) and collagen-like pORF011, pORF033, pORF067, and pORF068 (green) in infected pyloric cecum by IF. The nucleus was stained with DAPI (blue); scale bar, 10 µm. Data are expressed as means ± SD (**P < 0.01 or ***P < 0.001).
Fig 8
Fig 8
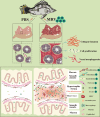
Diagram illustrating pyloric ceca lesions in mandarinfish upon acute MRV infection. The acute MRV infection results in severe fibrinous serositis characterized by severe congestion and edema in pyloric ceca, which is attributed to MRV primarily infecting mandarin fish serosa and resulting in pronounced serosal hyperplasia. Furthermore, MRV predominantly infected stromal components such as myofibroblasts, fibroblasts, endothelial cells, pericytes, and T and B lymphocytes within immune cells. This led to rapid ECM formation and recruitment of stromal and immune cells in the hypertrophic serosal zone, creating a favorable environment for viral replication. Simultaneously, due to the loose ECM structure, significant cell infiltration and interstitial fluid leakage resulted in severe ascites syndrome.

Similar articles

References

    1. Eaton HE, Ring BA, Brunetti CR. 2010. The genomic diversity and phylogenetic relationship in the family iridoviridae. Viruses 2:1458–1475. doi: 10.3390/v2071458 - DOI - PMC - PubMed
    1. Yu XD, Ke F, Zhang QY, Gui JF. 2023. Genome characteristics of two ranavirus isolates from mandarin fish and largemouth bass. Pathogens 12:730. doi: 10.3390/pathogens12050730 - DOI - PMC - PubMed
    1. Chinchar VG, Hick P, Ince IA, Jancovich JK, Marschang R, Qin Q, Subramaniam K, Waltzek TB, Whittington R, Williams T, Zhang Q-Y, Ictv Report Consortium . 2017. ICTV virus taxonomy profile: Iridoviridae. J Gen Virol 98:890–891. doi: 10.1099/jgv.0.000818 - DOI - PMC - PubMed
    1. Cheng K, Jones MEB, Jancovich JK, Burchell J, Schrenzel MD, Reavill DR, Imai DM, Urban A, Kirkendall M, Woods LW, Chinchar VG, Pessier AP. 2014. Isolation of a Bohle-like iridovirus from boreal toads housed within a cosmopolitan aquarium collection. Dis Aquat Organ 111:139–152. doi: 10.3354/dao02770 - DOI - PubMed
    1. Cunningham AA, Hyatt AD, Russell P, Bennett PM. 2007. Emerging epidemic diseases of frogs in Britain are dependent on the source of ranavirus agent and the route of exposure. Epidemiol Infect 135:1200–1212. doi: 10.1017/S0950268806007679 - DOI - PMC - PubMed

LinkOut - more resources