. 2025 May;29(9):e70608.
doi: 10.1111/jcmm.70608.

E-Cadherin Is a Structuring Component of Invadopodia in Pancreatic Cancer

Affiliations

E-Cadherin Is a Structuring Component of Invadopodia in Pancreatic Cancer

Aurélie Dobric et al. J Cell Mol Med. 2025 May.

Abstract

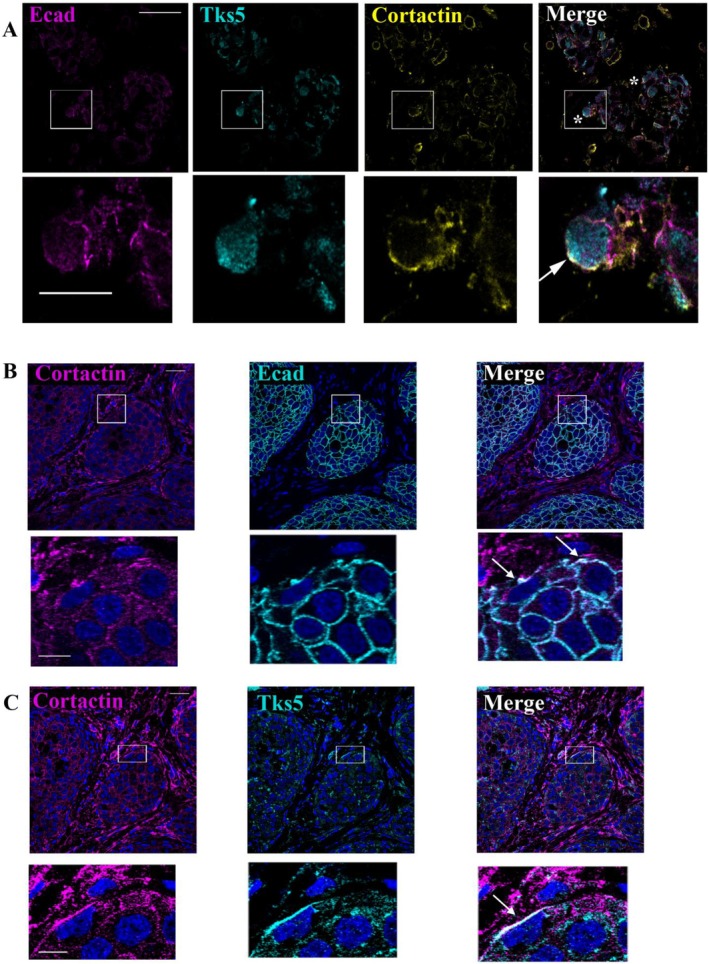
The appearance of hybrid epithelial-mesenchymal (E/M) cells expressing E-cadherin is favourable for the establishment of pro-invasive function. Although the potential role of E-cadherin in cancer invasion is now accepted, the molecular mechanisms involved in this process are not completely elucidated. To gain further insight, we focused our analysis on invadopodia formation, an early event in the invasion process. We used models of E/M hybrid cell lines, tissue sections and patient-derived xenografts from a multi-centre clinical trial. E-cadherin involvement in invadopodia formation was assessed using a gelatin-FITC degradation assay. Mechanistic studies were performed by using proteomic analysis, siRNA strategy and proximity ligation assay. We showed that E-cadherin is a critical component of invadopodia. This unexpected localization results from a synergistic trafficking of E-cadherin and MT1-MMP through a Rab vesicle-dependent pathway. Modulation of E-cadherin expression or activation impacted invadopodia formation. Moreover, colocalization of E-cadherin and Actin in "ring structures" as precursors of invadopodia reveals that E-cadherin is required for invadopodia structuration. E-cadherin, initially localised in the adherens junctions, could be recycled to nascent invadopodia where it will interact with several components enriched in invadopodia, such as Arp2/3, Cortactin or MT1-MMP. The trans-adhesive properties of E-cadherin are therefore essential for structuring invadopodia. This new localisation of E-cadherin and its unexpected role in cell invasion shine a new light on hybrid E/M transition features in tumoral invasion.

Keywords: EMT hybrid cells; adhesion molecules; cell invasion; matrix degradation.


Conflict of interest statement

The authors declare no conflicts of interest.

Figures

FIGURE 1
FIGURE 1
E‐cadherin localises within invadopodia. Pancreatic cancer BxPC‐3 cell line (A–C), pancreatic cancer primary culture PDAC001T (E) and breast cancer cells SUM‐149 cell line (F) were seeded on FITC‐labelled gelatin. Cells were stained for actin with phalloidin‐rhodamin (red) and E‐cadherin using an antibody raised against the cytoplasmic domain (blue) (A) or extracellular domain (B) or P‐cadherin (C). An actin spot localization with a degradation zone of the FITC‐labelled gelatin represents an active invadopodia. Top panel: Images represent Z‐stack confocal acquisitions. Scale bar = 10 μm (A, B) or 2 μm (C, E, F). Bottom panel: Fluorescence intensity quantification of the region of interest indicated by the yellow square on the top panel. The gelatin degradation area is identified in grey. For each condition, at least 50 cells were observed. (D) The BxPC‐3 cell body membrane and invadopodia membrane were enriched as described in Methods, subjected to SDS‐PAGE and transferred onto nitro‐cellulose membrane. TkS5, E‐cadherin, MT1‐MMP, P‐cadherin, Actin and Histone H1 were sequentially detected by western blot in the same membrane. Images in 2D view for (A) and (C) are available in Figure S3A. (A): A representative image of 7 experiments with 5 acquisitions for each (n = 7), (B, C): A representative image of 3 experiments with 5 acquisitions for each (n = 3), (D): One experiment representative of 3, (E, F): A representative image of 2 experiments with 5 acquisitions (5 cells per acquisition) for each (n = 2).
FIGURE 2
FIGURE 2
E‐cadherin localises in invadopodia‐like structures in vivo. (A) Triple E‐cadherin, Tks5, and Cortactin immunostaining in sections from patient tumours. White squares represent magnified views. White arrow indicates invadopodia containing E‐Cadherin. Scale bars represent 10 μm (top panel) or 2 μm (magnification panel). The triple Cortactin/Tks5/E‐cadherin colocalization was observed in 3 out of 6 patient tissues (n = 6). (B) E‐cadherin and Cortactin or (C) E‐cadherin and Tks5 double immunostaining in serial sections from subcutaneous tumours of BxPC3 cells implanted in mice. Nuclei were stained using DAPI. White squares represent magnified views. White arrows indicate spots of Cortactin, Tks5 and E‐cadherin colocalization. Scale bars represent 40 μm (top panels) or 10 μm (magnification panel).
FIGURE 3
FIGURE 3
E‐cadherin interacts with MT1‐MMP in invadopodia and is recycled through Rab7 and Rab11 pathways. (A) Cell–cell interactions inhibited invadopodia formation. The number of invadopodia per cell was measured as described in Methods section. The graph represents the distribution of invadopodia in isolated cells (1 cell), cell doublet (2 cells) or groups superior of 2 cells (> 2 cells). Raw data are shown with coloured dots. Mean from 2 independent experiments are indicated with coloured squares. Errors bars represent mean ± SEM. n = 2. (B) Equal amounts of BxPC‐3 cell lysate were immunoprecipitated using either anti‐MT1‐MMP or non‐specific (IgG) antibodies. After SDS‐PAGE and transfer onto PVDF membrane, protein complexes were detected using anti‐E‐cadherin or anti‐MT1‐MMP antibodies. Control was performed using BxPC‐3 lysates. A representative experiment of 3 (n = 3) (C) E‐cadherin and MT1‐MMP colocalize inside invadopodia. After E‐cadherin and MT1‐MMP immunostaining, E‐cadherin–MT1‐MMP complexes were detected using PLA. Z‐stack confocal acquisitions were performed. Top panel: The amplification spots (in red) localise in a gelatin‐degradation area. Scale bar = 2 μm. Bottom panel: Fluorescence intensity quantification of the region of interest indicated by the yellow square on the top panel. The gelatin degradation area is identified in grey. A representative image of 2 experiments in triplicates with 3 acquisitions for each (n = 2). (D, E) BxPC‐3 cells were treated for 48 h with siRNA control (siCTRL) or siRNA against (D) Rab7 (siRab7) or (E) Rab11 (siRab11) before invadopodia assay. (D, E) Left panel: Quantification of active invadopodia at the ventral surface of each cell. Right panel: Quantification of active invadopodia exhibiting E‐cadherin per cell. Means from 3 (D) or 4 (E) independent experiments indicated with coloured squares. Errors bars represent mean ± SEM. Bottom panels: Equal amounts of cell lysate (25 μg) were subjected to SDS‐PAGE, then transferred onto PVDF membrane. Graphs represent the mean ± SEM of Rab7 or Rab11 protein expression from 3 independent cell transfection. (F) E‐cadherin and Rab7; (G) E‐cadherin and Rab11; (H) MT1‐MMP and Rab7; (I) MT1‐MMP and Rab11. Z‐stack confocal acquisitions were performed on fixed cells. Left panels: The amplification spots (red) localise with a degradation spot of the fluorescent gelatin (green). Scale bars represent 2 μm. Right panels: Fluorescence intensity quantification of the regions of interest indicated by the yellow square on the left panel. Images in 2D view for (C) and (F–I) are available in Figure S3B and negative control (PLA probe PLUS/MINUS) is available in Figure S3D. (F–I): A representative image of 2 experiments in triplicates with 3 acquisitions for each (n = 2). ***:P < 0.001; *:P < 0.05.
FIGURE 4
FIGURE 4
E‐cadherin adhesive activity is required for invadopodia formation. (A‐C) Invadopodia assays were performed using BxPC‐3 control (shCTRL) and E‐cadherin depleted cells (shEcad) cell lines. (A) The number of cells exhibiting active invadopodia were quantified. Means from 3 independent experiments are indicated with coloured squares. Errors bars represent Mean ± SEM. n = 3 (B) The normalised gelatin degradation area at the ventral surface of the cells was evaluated. Means from 3 independent experiments are indicated with coloured squares. Errors bars represent mean ± SEM. n = 3. (C) The distribution of the number of invadopodia per cell was determined A representative graph of 3 experiments (n = 3). Images in 2D view for (A) are available in Figure S3C. (D‐E) Invadopodia assays were performed using PDAC021T Mock (no E‐cadherin expression) and PDAC021T Ecad, (E‐cadherin expression) cells. The E‐cadherin expression was assessed by western blot. The normalised gelatin degradation area at the ventral surface of the cells were evaluated. Representative results from 3 independent experiments. (F) E‐cadherin and β‐catenin interact within invadopodia. E‐cadherin–β‐catenin complexes were detected using a PLA. Z‐stack confocal acquisitions were performed. Top panel: The amplification spot (red) localises in a degradation spot of FITC‐labelled gelatin (green). Bottom panel: Fluorescence intensity quantification of the region of interest indicated by the yellow square on the top panel. Scale bar represents 2 μm. A representative image of 2 experiments in triplicates with 3 acquisitions for each (n = 2). Images in 2D view for (F) is available in Figure S3D. (G) E‐cadherin inhibition decreases invadopodia formation. Ratio of cells exhibiting active invadopodia in treated (AS9 or AS11) and untreated (DMSO) BxPC‐3 cells were evaluated. Means from 3 independent experiments are indicated with coloured squares. Raw data are shown with coloured dots. Errors bars represent mean ± SEM. n = 3. (H) Invadopodia assays were performed using BxPC‐3 shCTRL. Cells were seeded for 2 h on coverslips coated with FITC‐labelled gelatin, then treated for 16 h with DMSO or AS11. Cells were then washed and incubated in DMEM/10% fetal calf serum for an additional 24 h period. Invadopodia formation was analysed by videomicroscopy by capturing images every hour, 8 h after addition of the compounds. The number of gelatin degradation zones appearing just below the cell body is estimated for each hour. The graph is representative of an experiment carried out three times (n = 3). ***:P < 0.001.
FIGURE 5
FIGURE 5
An E‐cadherin/Arp3 complex is detected into invadopodia. (A) Most deregulated signalling pathways in BxPC‐3 shEcad compared with BxPC‐3 shCTRL cells as determined by IPA analysis of proteome data. The enrichment score on the graphic is represented by −log(p‐value). n = 3 (B, C) Protein–protein interactions in invadopodia revealed by PLA. (B) Arp3–Cortactin and (C) Arp3–E‐cadherin interactions. Z‐stack confocal acquisitions were performed on fixed cells. Top panels: The amplification spots (red) localise with a degradation spot of FITC‐labelled gelatin (green). Cell nuclei are shown in blue. Bottom panels: Fluorescence intensity quantification of the region of interest indicated by the yellow square on the left panel. Scale bar represents 2 μm. (B): A representative image of 2 experiments in triplicates with 3 acquisitions for each (n = 2). (C): A representative image of 2 experiments in triplicates with 3 acquisitions for each (n = 2). Images in 2D view for (C) are available in Figure S3D and negative control for (B, C) is available in Figure S3D. (D) BxPC‐3 cells were treated for 48 h with control siRNA (siCTRL) or siRNA against the Arp3 subunit (siArp3). Arp3 protein expression in BxPC‐3 cells treated by siCTRL or siArp3. Equal amounts of cell lysate (25 μg) were subjected to SDS‐PAGE, then transferred onto PVDF membrane. Arp3 and actin were detected using specific antibodies. The graph represents the mean ± SEM of Arp3 protein expression from 3 independent cell transfection. n = 3. (E) After a treatment during 48 h with control siRNA (siCTRL) or siRNA against the Arp3 subunit (siArp3) cells were plated for 16 h onto FITC‐labelled gelatin. The graph represents the quantification of active invadopodia formed per cell. Data corresponds to a mean from three independent experiments indicated with coloured squares. Errors bars represent mean ± SEM. n = 3.
FIGURE 6
FIGURE 6
E‐cadherin is a structuring component of invadopodia. Invadopodia assays were performed as previously described. (A, B) After confocal acquisition, analysis of structures evidence 3 kinds of invadopodia: Step 1 initiation: In the absence of FITC‐labelled gelatin degradation Actin ring overlays with E‐cadherin ring, step 2 maturation: Spot of associated with both Actin and E‐cadherin ring, step 3: FITC‐labelled gelatin degradation associated with Actin spot in the presence or absence of E‐cadherin. (B), Percentage of cells showing these kinds of structure (n = 2). (C–F) Images of Invadopodia assays were acquired using AiryScan module of Zeiss LSM 880 confocal microscope. Acquisitions were performed inside the gelatin sheet every 0.22 μm. Bottom indicated the bottom detection of gelatin. In (C), labelling of both Actin E‐cadherin are given for each section. Intensity quantifications were performed using FIJI software and the maximal intensity for Actin and E‐cadherin is mentioned by a black or red box, respectively. In (D) Z‐labelling ranges are positioned with bars and the section with the more intense labelling is mentioned by a dark line. Dark bars represent the average of A, B, C, D structures. (E) Actin (magenta) and E‐cadherin (cyan) staining detected 1.1 μm above the gelatin bottom using AiryScan module. Peaks represent labelling intensity of each molecule at this Z‐section.

Similar articles

References

    1. Siegel R. L., Miller K. D., Fuchs H. E., and Jemal A., “Cancer Statistics, 2022,” CA: A Cancer Journal for Clinicians 72 (2022): 7–33, 10.3322/caac.21708. - DOI - PubMed
    1. Beatty G. L., Werba G., Lyssiotis C. A., and Simeone D. M., “The Biological Underpinnings of Therapeutic Resistance in Pancreatic Cancer,” Genes & Development 35 (2021): 940–962, 10.1101/gad.348523.121. - DOI - PMC - PubMed
    1. Bhoopathi P., Mannangatti P., Das S. K., Fisher P. B., and Emdad L., “Chemoresistance in Pancreatic Ductal Adenocarcinoma: Overcoming Resistance to Therapy,” Advances in Cancer Research 159 (2023): 285–341, 10.1016/bs.acr.2023.02.010. - DOI - PubMed
    1. Dongre A. and Weinberg R. A., “New Insights Into the Mechanisms of Epithelial–Mesenchymal Transition and Implications for Cancer,” Nature Reviews Molecular Cell Biology 20 (2019): 69–84, 10.1038/s41580-018-0080-4. - DOI - PubMed
    1. Yang J., Antin P., Berx G., et al., “Guidelines and Definitions for Research on Epithelial–Mesenchymal Transition,” Nature Reviews Molecular Cell Biology 21 (2020): 1–12, 10.1038/s41580-020-0237-9. - DOI - PMC - PubMed