. 2025 Jun 6;24(6):3074-3087.
doi: 10.1021/acs.jproteome.5c00221. Epub 2025 May 14.

Technical Evaluation of Plasma Proteomics Technologies

Affiliations

Technical Evaluation of Plasma Proteomics Technologies

William F Beimers et al. J Proteome Res. .

Abstract

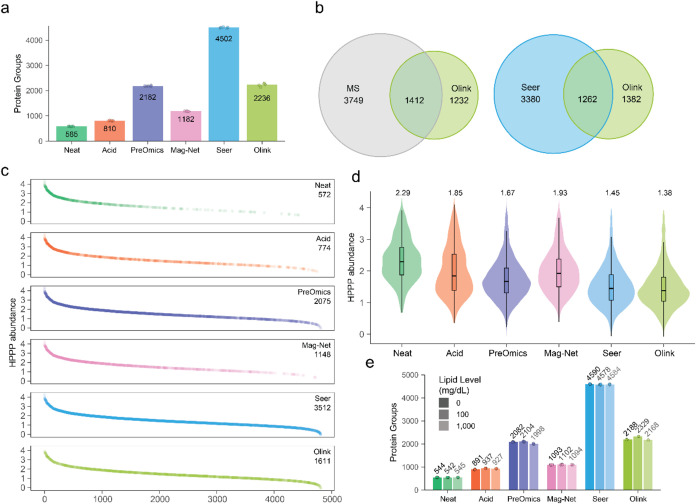
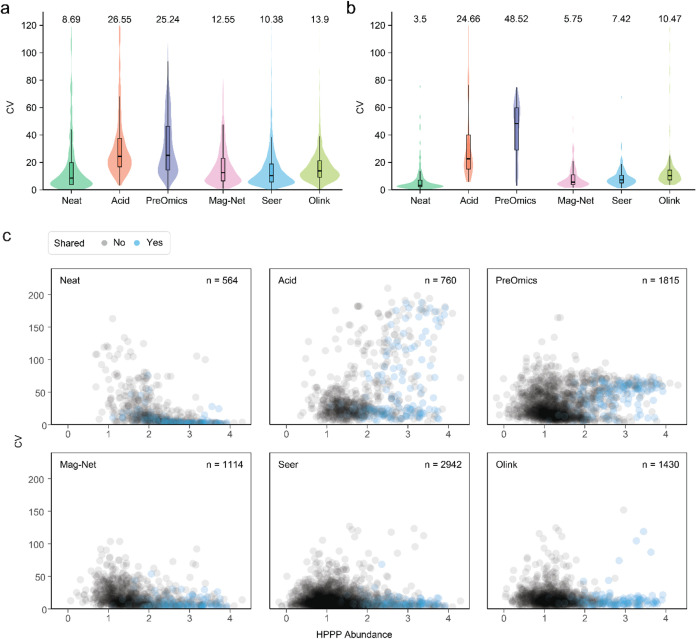
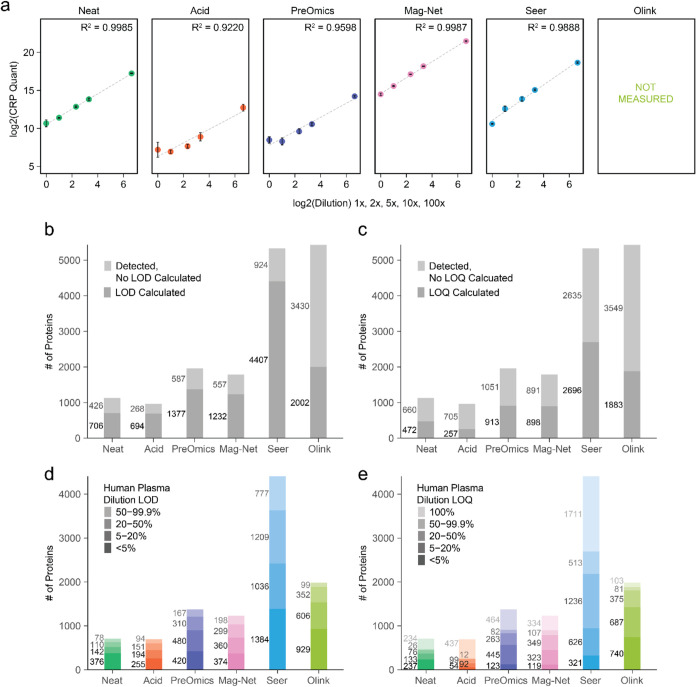
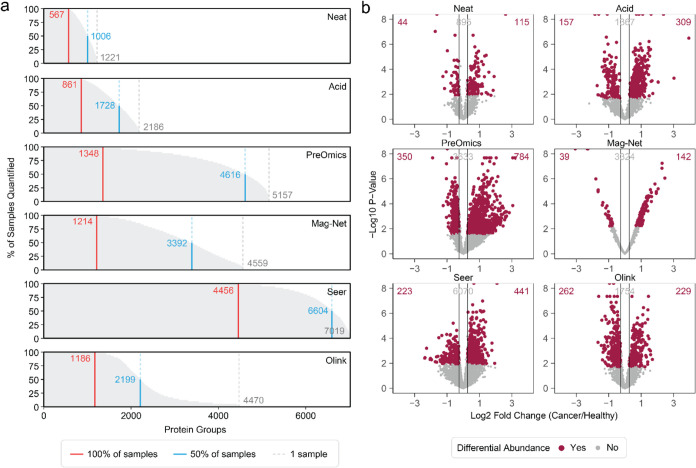
Plasma proteomics technologies are rapidly evolving and of critical importance to the field of biomedical research. Here, we report a technical evaluation of six notable plasma proteomics technologies─unenriched (Neat), acid depletion, PreOmics ENRICHplus, Mag-Net, Seer Proteograph XT, and Olink Explore HT. The methods were compared on proteomic depth, reproducibility, linearity, tolerance to lipid interference, and limit of detection/quantification. In total, we performed 618 LC-MS/MS experiments and 93 Olink Explore HT assays. The Seer method achieved the greatest proteomic depth (∼4500 proteins detected), while Olink detected ∼2600 proteins. Other MS-based methods ranged from ∼500-2200 proteins detected. In our analysis, Neat, Mag-Net, Seer, and Olink had good reproducibility, while PreOmics and Acid had higher variability (>20% median coefficient of variation). All MS methods showed good linearity with spiked-in C-reactive protein (CRP); CRP was surprisingly not in the Olink assay. None of the methods were affected by lipid interference. Seer produced the highest number of quantifiable proteins with a measurable LOD (4407) and LOQ (2696). Olink had the next highest number of quantifiable proteins, with 2002 having an LOD and 1883 having an LOQ. Finally, we tested the applicability of these methods for detecting differences between healthy and cancer groups in a nonsmall cell lung cancer (NSCLC) cohort. All six methods detected differentially abundant proteins between the cancer and healthy samples but disagreed on which proteins were significant, highlighting the contrast between each method.

Keywords: LC-MS; Mag-Net; Olink; PreOmics; Seer; mass spectrometry; method comparison; plasma; proteomics.


Figures

1
1
Depth of proteomic analysis for the tested methods. (a) Average number of protein groups identified across five technical replicates. For Olink, protein IDs were reported for assays that were above LOD. Points representing the number of identifications in each of the five replicates are plotted. (b) Venn diagrams showing the gene-level overlap in identifications between Olink and Seer, or Olink and proteins identified in at least one of the MS methods. (c) Proteins that were identified in common between the methods in this study and the Human Plasma Proteome Project data set (n = 5091) were mapped to HPPP abundance data. HPPP abundance is calculated from log 10 transformed PSM spectral counting of each protein. Ranking plots are shown with HPPP abundance on the y-axis and rank on the x-axis, revealing that some methods skew toward detection of high-abundance proteins while others are more evenly distributed across the abundance range. (d) Violin plots showing the density of where identifications fall in the abundance level by method. (e) Triglyceride-rich lipoproteins were spiked into plasma at three levels: control (0 mg/dL), low (100 mg/dL), and high (1000 mg/dL). Plasma samples were prepared once at each spike-in level with each method and measured in injection triplicates with LC-MS/MS. Olink samples were only measured once. The number of identified protein groups was plotted at each lipid level.
2
2
Measurement reproducibility. (a) Coefficient of variation (CV) for protein measurements across five technical replicates. For Olink, protein IDs were reported only for assays that were above the LOD. (b) Protein CV for shared protein groups (n = 137) across all six methods. (c) HPPP abundance vs CV for proteins overlapping with HPPP in each method. Shared proteins are shown in blue vs black dots. Since MS and Olink measurements are not directly comparable, HPPP abundance was used as a proxy for absolute abundance.
3
3
Evaluation of measurement linearity. Linearity was assessed using a protein spike-in and a matrix-matched calibration curve. (a) Following the measurement of endogenous CRP levels, a series of standard additions were made at 2×, 5×, 10×, and 100× the endogenous concentration. Plasma samples were prepared in triplicate at each spike-in level with each method, and the abundance of CRP was extracted after analysis using the same protocols and instrument methods as previously described. The measured abundance of CRP was plotted against the spike-in factor. (b–e) Human plasma was spiked into a chicken plasma matrix at various levels and the resultant samples processed with each of the methods. (b) Proportion of proteins for each method that could have a LOD calculated. (c) Proportion of proteins for each method that could have a LOQ calculated. (d) For each method, the number of proteins with an LOD calculated at each dilution level with <5% human plasma being the most sensitive. (e) Number of proteins with a LOQ calculated at each dilution level. Proteins with a defined LOD and infinite LOQ were assigned an LOQ of 100.
4
4
40-sample nonsmall cell lung cancer (NSCLC) cohort. (a) Summary of identifications and data completeness for each method across the 40 individual plasma samples. Vertical lines indicate the number of proteins identified in 100% of samples, 50% of samples, or at least one sample. (b) Volcano plots of differential abundance between cancer/control groups resulting from each plasma method. Protein abundances were log 2 transformed, filtered for 50% completeness in at least one study group, missing values imputed, and differential expression analysis performed. Differential expression was denoted by fold change > |1.2| and adjusted p-values (BH method) < 0.05.

Update of

Similar articles

Cited by

References

    1. Dhingra R., Vasan R. S.. Biomarkers in Cardiovascular Disease. Trends Cardiovas. Med. 2017;27(2):123–133. doi: 10.1016/j.tcm.2016.07.005. - DOI - PMC - PubMed
    1. Donatti A., Canto A. M., Godoi A. B., da Rosa D. C., Lopes-Cendes I.. Circulating Metabolites as Potential Biomarkers for Neurological DisordersMetabolites in Neurological Disorders. Metabolites. 2020;10(10):389. doi: 10.3390/metabo10100389. - DOI - PMC - PubMed
    1. Larkin J. R., Anthony S., Johanssen V. A., Yeo T., Sealey M., Yates A. G., Smith C. F., Claridge T. D. W., Nicholson B. D., Moreland J.-A., Gleeson F., Sibson N. R., Anthony D. C., Probert F.. Metabolomic Biomarkers in Blood Samples Identify Cancers in a Mixed Population of Patients with Nonspecific Symptoms. Clin. Cancer Res. 2022;28(8):1651–1661. doi: 10.1158/1078-0432.CCR-21-2855. - DOI - PMC - PubMed
    1. Schwarzenbach H., Hoon D. S. B., Pantel K.. Cell-Free Nucleic Acids as Biomarkers in Cancer Patients. Nat. Rev. Cancer. 2011;11(6):426–437. doi: 10.1038/nrc3066. - DOI - PubMed
    1. Anderson N. L., Anderson N. G.. The Human Plasma Proteome. Mol. Cell. Proteomics. 2002;1(11):845–867. doi: 10.1074/mcp.R200007-MCP200. - DOI - PubMed

Publication types