Review
. 2025 May 14;36(1):39.
doi: 10.1007/s10856-025-06887-2.

Advances in hydrogel research: a 25-year bibliometric overview

Affiliations
Review

Advances in hydrogel research: a 25-year bibliometric overview

Dongbin Zhang et al. J Mater Sci Mater Med. .

Abstract

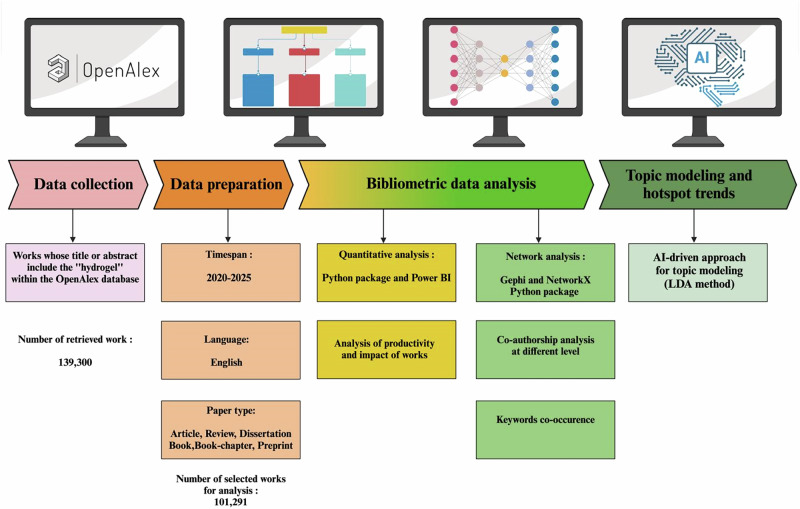
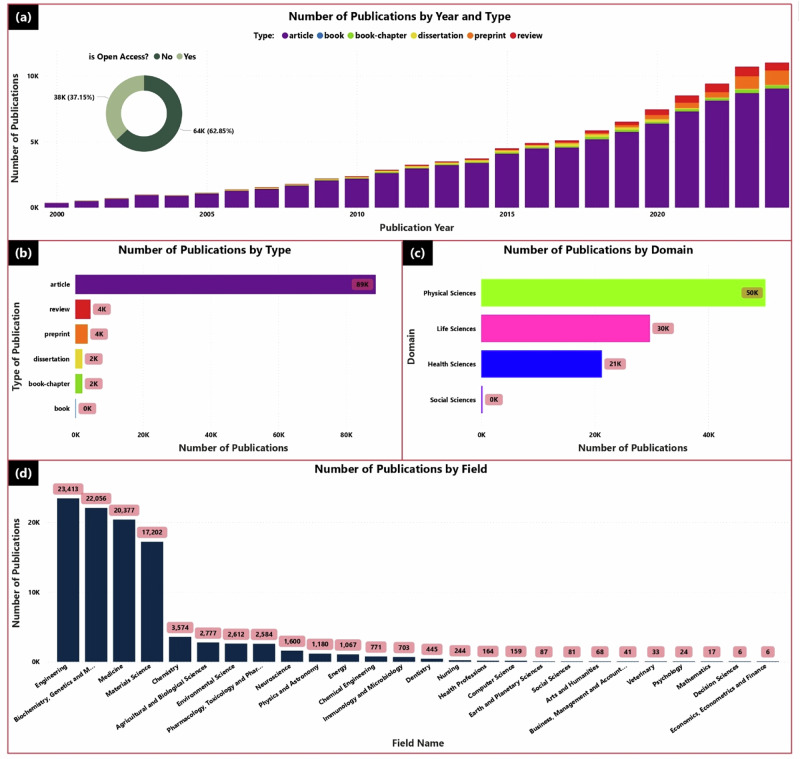
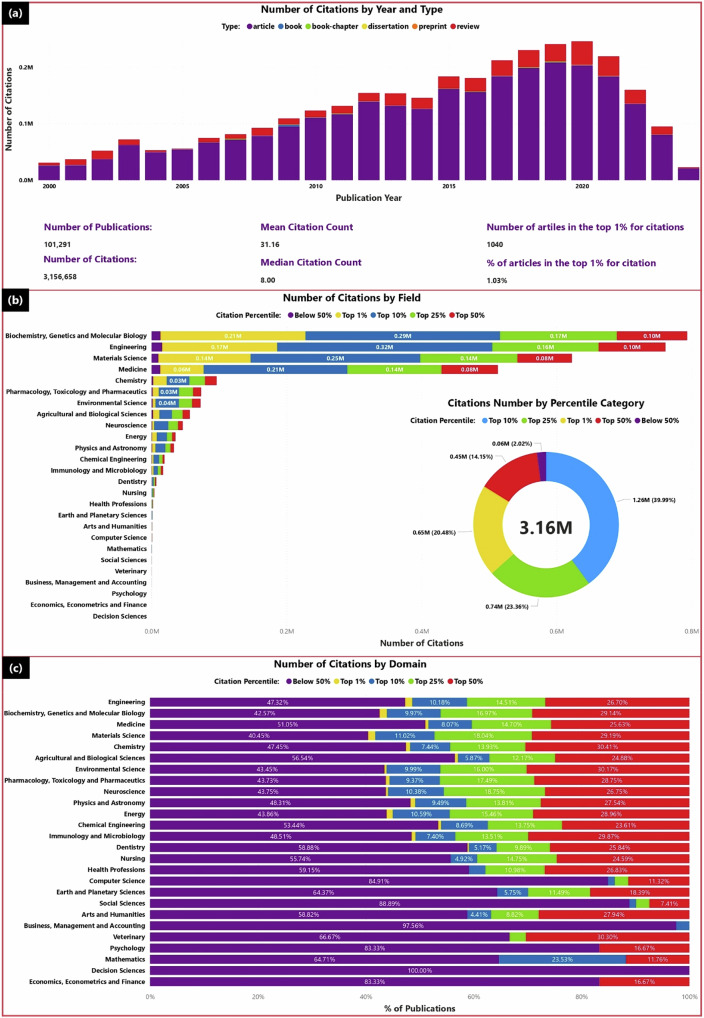
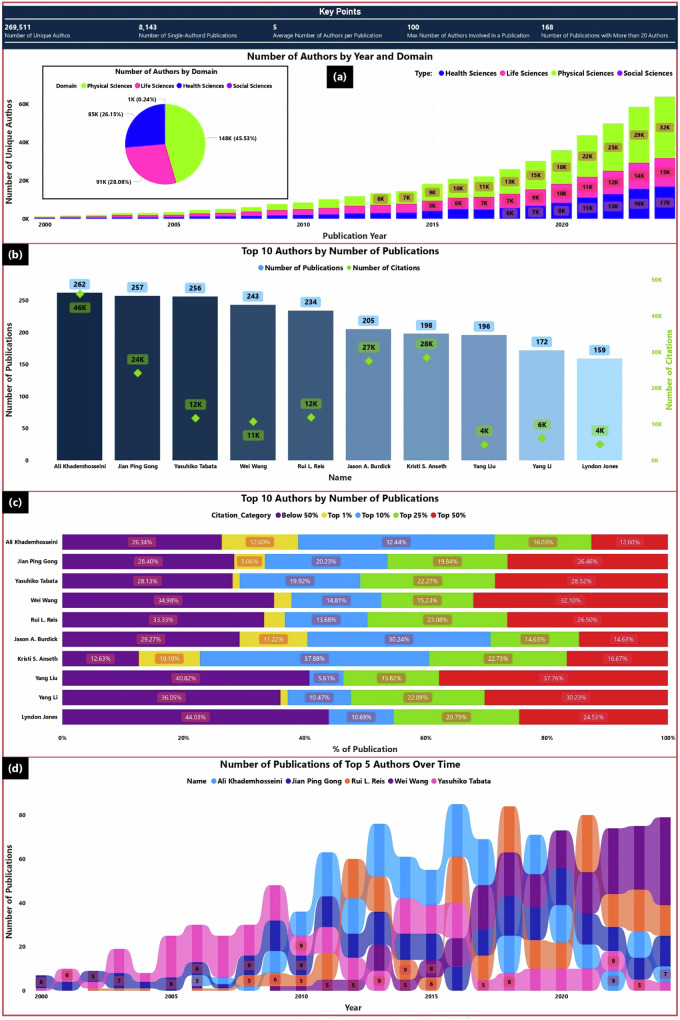
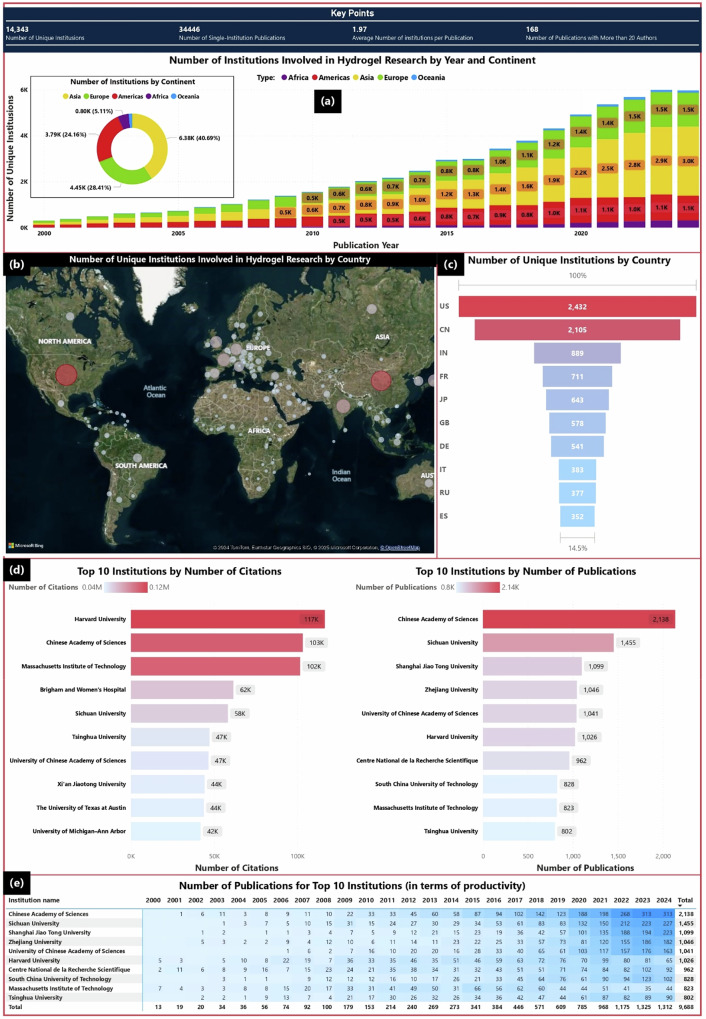
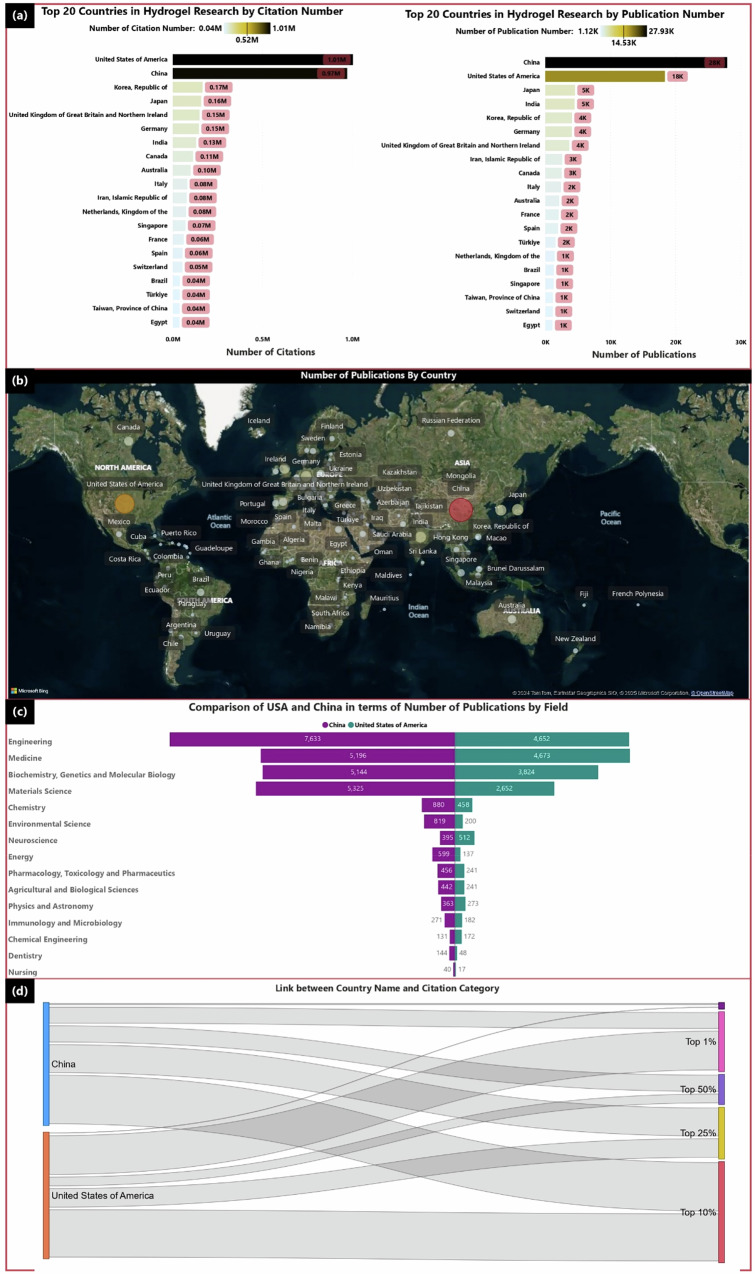
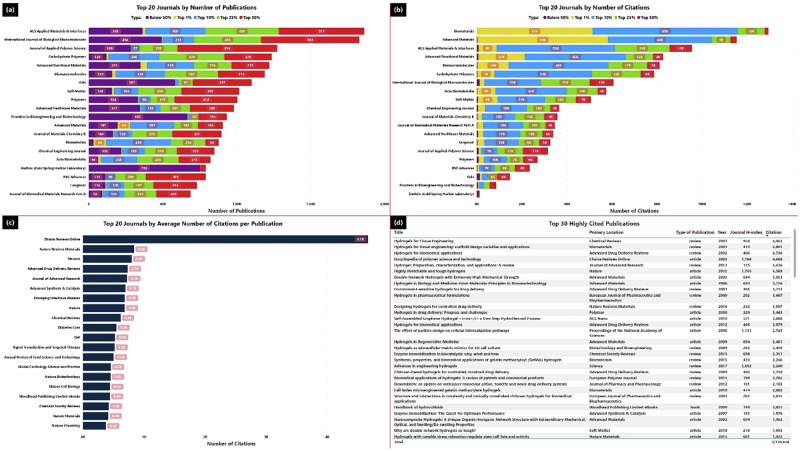
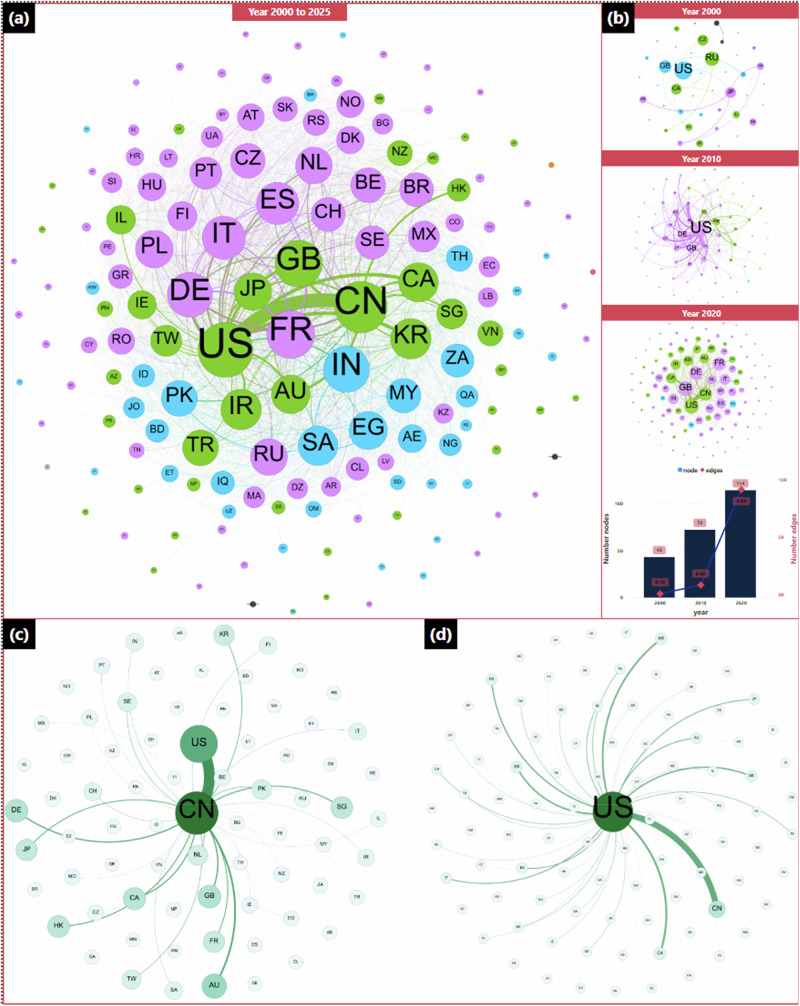
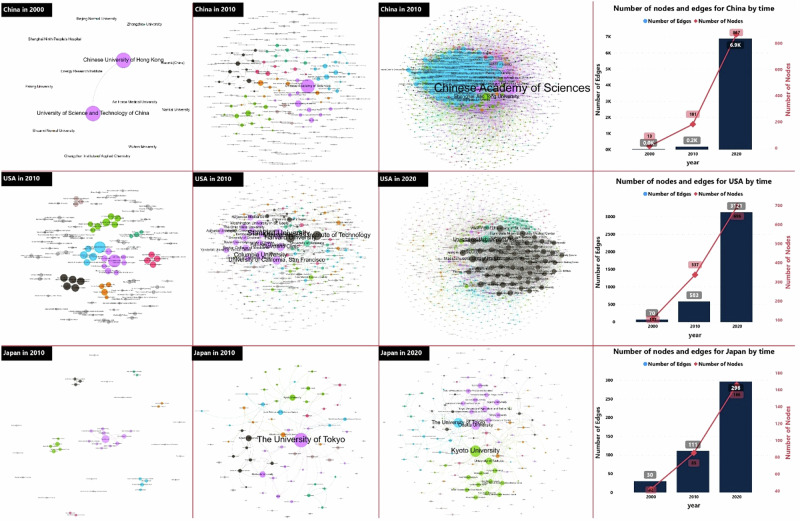
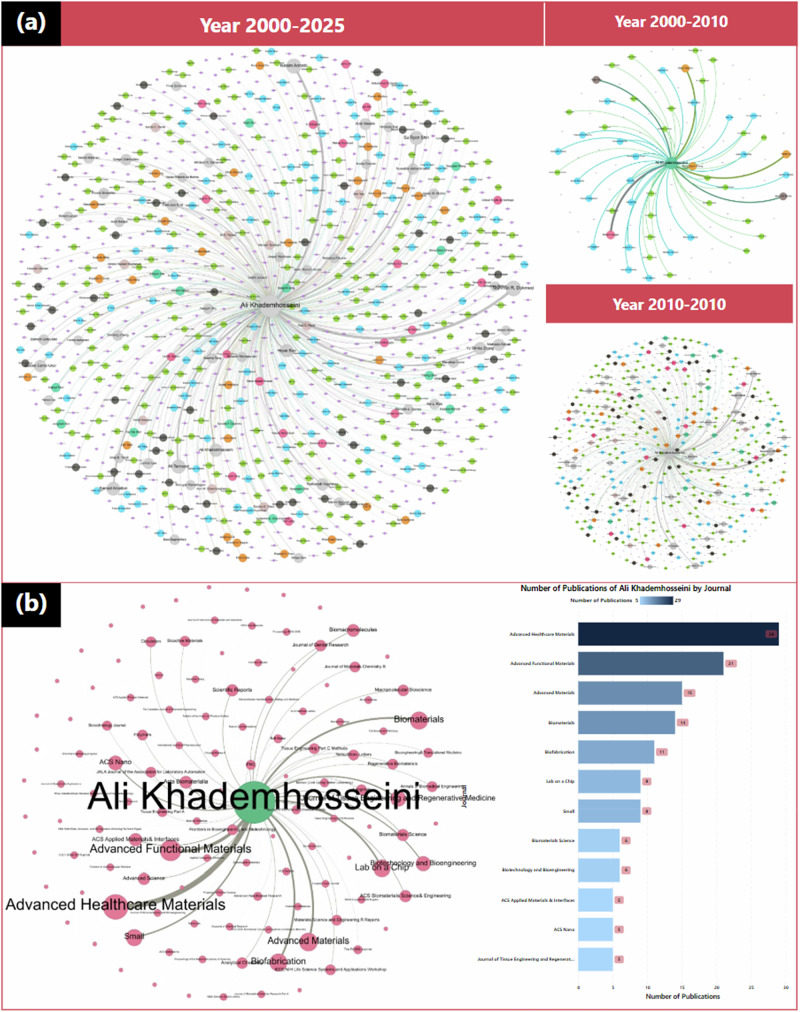
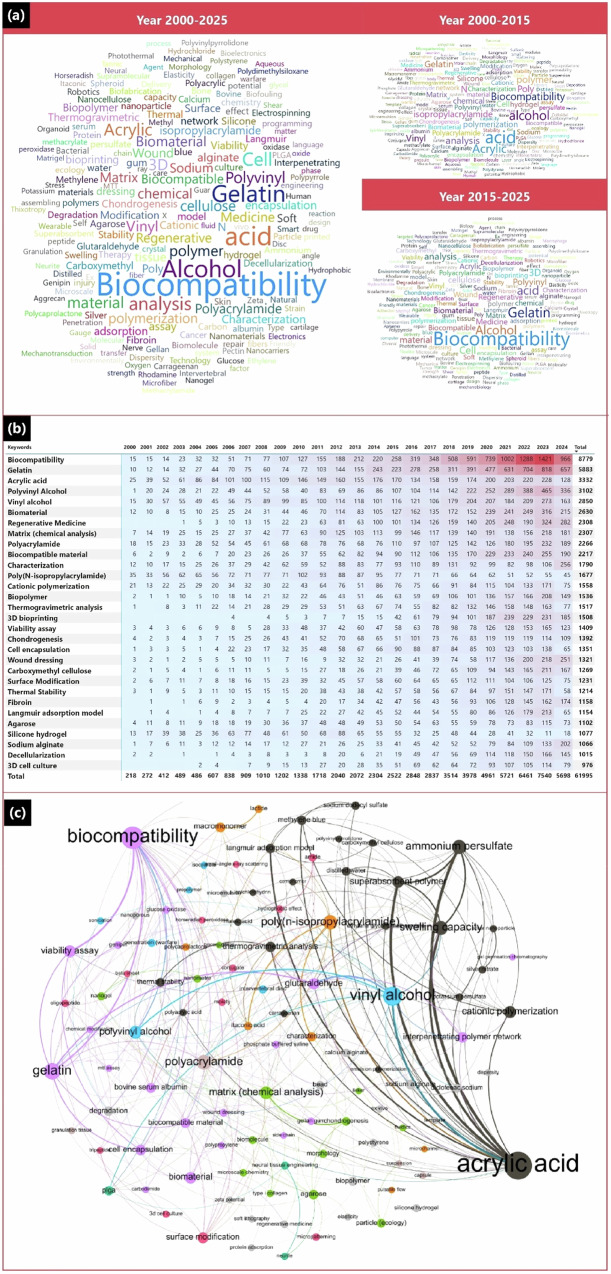
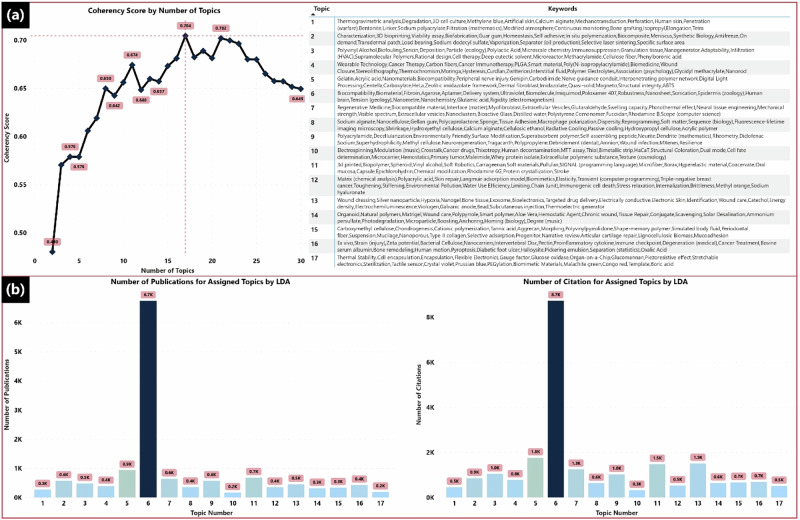
This study presents a comprehensive bibliometric analysis of hydrogel research from 2000 to 2025, examining 101,291 publications from the OpenAlex database to highlight the field's evolution, trends, and impact, providing a better landscape of the field. The analysis demonstrates significant growth in the research output, from ~350 publications in 2000 to nearly 11,000 in 2024, with 37% being open access. Publication patterns demonstrate Physical Sciences leading with about 50,000 publications, followed by Life Sciences (~30,000) and Health Sciences (~21,000). The citation analysis emphasizes that 20% of all citations result from the top 1% of papers, demonstrating the concentration of the research impact. The study identifies key research hubs, with China as a leader in the publication (27,931 publications), while the United States maintains the highest citation impact (>1 million citations). Network analysis reveals increasingly complicated international collaborations, particularly between the United States and China. Topic modeling using Latent Dirichlet Allocation identifies 17 distinct research themes, emphasizing the field's diversification from fundamental material features to advanced applications in the tissue engineering, drug delivery, and regenerative medicine. This analysis provides valuable insights into the dynamic landscape of hydrogel research, highlighting opportunities for future innovation and collaboration.


Conflict of interest statement

Compliance with ethical standards. Conflict of interest: The authors declare no competing interests.

Figures

Fig. 1
Fig. 1
Comprehensive bibliometric analysis of hydrogel research from 2000 to 2025. The left hemisphere (blue) illustrates the multidisciplinary applications of hydrogel across various disciplines such as medicine, engineering, health, chemistry, and manufacturing sectors. The right hemisphere (orange) represents the bibliometric analytical approaches used in this study, including global networks, co-authorship patterns, publication metrics, and keyword clustering
Fig. 2
Fig. 2
Schematic illustrations of steps involved in the bibliometric analysis workflow in this study
Fig. 3
Fig. 3
Trends and distribution of hydrogel-related publications from 2000 to 2025. a Annual growth in the number of publications, showing a steady increase from ~350 in 2000 to nearly 11,000 in 2024, with 37% of publications being open access (insert). b Distribution of publication types, highlighting journal articles as the dominant format (~85%). c Domain research area distribution, with the highest publication counts in Physical Sciences (~50,000), Life Sciences (~30,000), and Health Sciences (~21,000). d number of publications across different field of research: substantial outputs in Engineering and Biochemistry, Genetics, and Molecular Biology, each exceeding 20,000 publications
Fig. 4
Fig. 4
Citation analysis of hydrogel research publications from 2000 to 2025. a Time series analysis of citation number along with main key metrics on the citation statistics. b Distribution of citations across various scientific fields categorized by citation percentiles (top 1%, top 10%, top 25%, top 50%, and below 50%). Biochemistry, Genetics, and Molecular Biology surpass Engineering in total citations, with ~210,000 citations coming from top 1% papers. The inset highlights that 20% of total citations are from the top 1% of publications, while only 2% are from the bottom 50%. c MaterSciMaterMed Percentage distribution of publications within each citation percentile across different fields, illustrating that fields like Materials Science have a higher proportion of highly cited publications, whereas Business, Management, Accounting, and Computer Science have a larger share of lower-cited works
Fig. 5
Fig. 5
Author Contributions and Publication Trends in Hydrogel Research (2000–2025). a Growth in the number of unique authors across four scientific domains—Health Sciences, Life Sciences, Physical Sciences, and Social Sciences—highlighting a significant increase in research collaboration, with Health Sciences accounting for the largest proportion of authors (45.53%). b Top 10 most prolific authors ranked by publication output, showing variations in total citation counts and emphasizing that research impact extends beyond publication volume. c Distribution of the top authors’ publications across citation percentiles, illustrating diverse citation impacts where some authors have a higher share of highly cited work, while others have more publications in lower citation categories. d Ribbon chart tracking the annual publication trends of the top five authors, revealing fluctuations in research productivity over time and reflecting evolving research priorities and collaborative efforts
Fig. 6
Fig. 6
Global Institutional Participation and Impact in Hydrogel Research (2000–2025). a Growth in the number of institutions involved in hydrogel research across Africa, the Americas, Asia, and Europe, showing a consistent upward trend globally. The inset pie chart displays the distribution of institutions by continent, with Asia leading at 40.69%, followed by Europe (28.41%), the Americas (24.16%), Africa (5.11%), and Oceania (0.24%). b World map visualization highlighting the geographical distribution of research institutions, with the United States and China exhibiting the highest concentration of institutional participation. c Bar chart ranking the top 10 countries by the number of institutions engaged in hydrogel research, led by the United States (2432) and China (2105), followed by other major contributors such as India, France, and Japan. d Comparative bar charts of the top 10 institutions based on research impact (total citations) and productivity (total publications). Harvard University leads in citations (117,000), while the Chinese Academy of Sciences ranks highest in publication output (2137). e Number of publications for Top10 institutions
Fig. 7
Fig. 7
Global Comparative Analysis of Research Output and Impact in Hydrogel Research (2000–2025). a Bar charts comparing the top 20 countries by total citations and publication counts in hydrogel research. The United States leads in total citations (>1 million), indicating higher research impact, while China leads in publication output (27,931), reflecting greater research productivity. b World map visualization showing the global distribution of hydrogel research output, with larger representations for countries producing more publications. The United States, China, and several European nations (United Kingdom, Germany, France) demonstrate significant research activity. c Bar chart comparing the research output of the United States and China across scientific fields. China leads in Engineering and Materials Science, while the US excels in Medicine and Biochemistry, Genetics, and Molecular Biology. Both countries show competitive outputs in Chemistry, Environmental Science, and Energy. d Sankey diagram illustrating the distribution of citations from the United States and China across impact categories (Top 1%, Top 10%, Top 25%, Top 50%, and Below 50%). The US has a higher share of publications in the top 1% citation category, while China demonstrates broader citation distribution, reflecting differing research impact profiles
Fig. 8
Fig. 8
Analysis of the most influential journals and publications in hydrogel research. a Bar chart of the top 20 journals ranked by publication output, segmented by citation categories (Below 50%, Top 50%, Top 25%, Top 10%, Top 1%). ACS Applied Materials & Interfaces leads in publication volume, with a significant portion of highly cited papers. b Bar chart of the top 20 journals by total citation counts, highlighting Biomaterials as the most cited journal with a substantial share of citations in the Top 1% and Top 10% categories. c Bar chart of the top 20 journals ranked by average citations per publication, with Choice Reviews Online demonstrating the highest average impact. d Table of the top 30 most highly cited publications in hydrogel research, dominated by influential review articles and high-impact research papers from leading journals such as Chemical Reviews, Advanced Drug Delivery Reviews, Nature, and Science
Fig. 9
Fig. 9
Global co-authorship networks at country level in hydrogel research. a The global collaboration network illustrating international research partnerships, where nodes represent countries and edges indicate co-authored publications. Node size reflects the number of publications, with the United States and China emerging as major hubs, highlighted by a thick edge denoting strong collaboration between them. b Evolution of international research collaboration networks in 2000, 2010, and 2020. The diagrams show increasing global interconnectedness over time, with a significant expansion in collaborations and the growing prominence of China–US partnerships by 2020. The rising number of nodes and edges underscores the dynamic and expanding nature of global research collaboration in the hydrogel field. c China’s international collaboration network highlights strong connections with the US, Australia, and Great Britain. d The US collaboration network shows prominent partnerships with China, Canada, and South Korea
Fig. 10
Fig. 10
Evolution of institutional co-authorship networks in hydrogel research for China, the USA, and Japan in 2000, 2010, and 2020. The network diagrams illustrate the growth and structure of research collaborations within each country over two decades. In 2000, the USA exhibited a more interconnected network compared to China and Japan. By 2020, China experienced rapid expansion, with the Chinese Academy of Sciences emerging as a central hub, while the USA showed steady growth and Japan demonstrated moderate expansion centered around the University of Tokyo. These visualizations highlight the increasing importance of collaborative research and reveal distinct national patterns in network evolution
Fig. 11
Fig. 11
Research collaborations and publication strategy of Dr. Ali Khademhosseini, a leading figure in hydrogel research. a Network diagram illustrating the evolution of Dr. Khademhosseini’s research collaborations from 2000 to 2025, with nodes representing co-authors and edges indicating the frequency of collaboration. b Publication output across various journals, with nodes sized according to the number of publications. Advanced Healthcare Materials stands out as the most significant journal
Fig. 12
Fig. 12
Evolution and interconnectedness of keywords in hydrogel research from 2000 to 2025. a Word cloud illustrating the progression of key themes, highlighting the sustained importance of “Biocompatibility” and the growing prominence of biomedical applications such as “Regenerative Medicine” and “3D Bioprinting.” b Quantitative analysis of keyword frequency over time, showcasing trends in material diversification and technological integration. c Co-occurrence network of keywords in 2010, emphasizing central hubs like “Biocompatibility,” “Acrylic Acid,” and “Gelatin,” and early exploration of emerging fields such as “Nanoparticles” and “Drug Delivery.”
Fig. 13
Fig. 13
a Coherence score analysis determining the optimal number of topics for the LDA model, identifying 17 distinct and interpretable themes within hydrogel research. b Distribution of publications and citations across the 17 topics, highlighting the dominance of certain topics—particularly Topic 6—in research output and academic impact

Similar articles

References

    1. Brown TE, Anseth KS. Spatiotemporal hydrogel biomaterials for regenerative medicine. Chem Soc Rev. 2017;46:6532–52. - PMC - PubMed
    1. El-Sherbiny IM, Yacoub MH. Hydrogel scaffolds for tissue engineering: progress and challenges. Glob Cardiol Sci Pract. 2013;2013:38–42. - PMC - PubMed
    1. Erol O, Pantula A, Liu W, Gracias DH. Transformer hydrogels: a review. Adv Mater Technol. 2019;4:1900043.
    1. Lv Y, Xi X, Dai L, Tong S, Chen Z. Hydrogel as a superwetting surface design material for oil/water separation: a review. Adv Mater Interfaces. 2021;8:2002030.
    1. Lou J, Mooney DJ. Chemical strategies to engineer hydrogels for cell culture. Nat Rev Chem. 2022;6:726–44. - PubMed

LinkOut - more resources