. 2025 May;74(5):002010.
doi: 10.1099/jmm.0.002010.

Association of gut microbiota with overweight/obesity combined with gestational diabetes mellitus

Affiliations

Association of gut microbiota with overweight/obesity combined with gestational diabetes mellitus

Shanshan Mei et al. J Med Microbiol. 2025 May.

Abstract

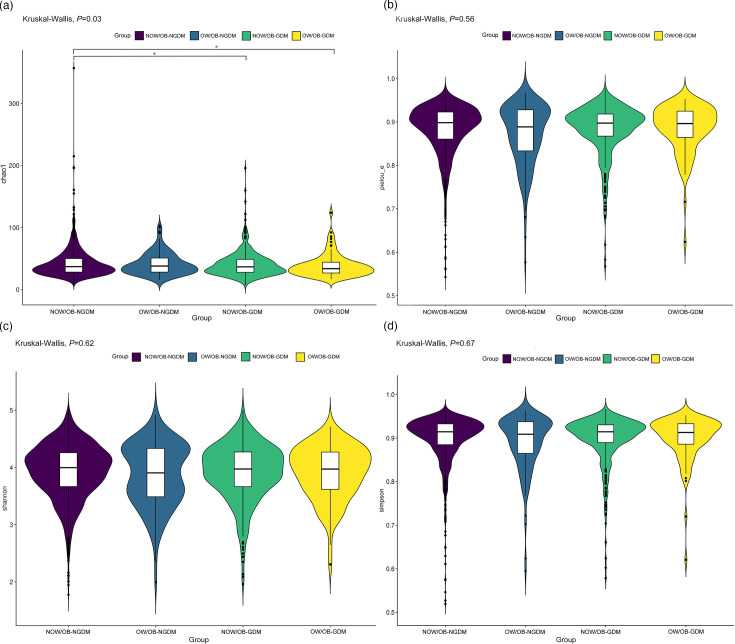
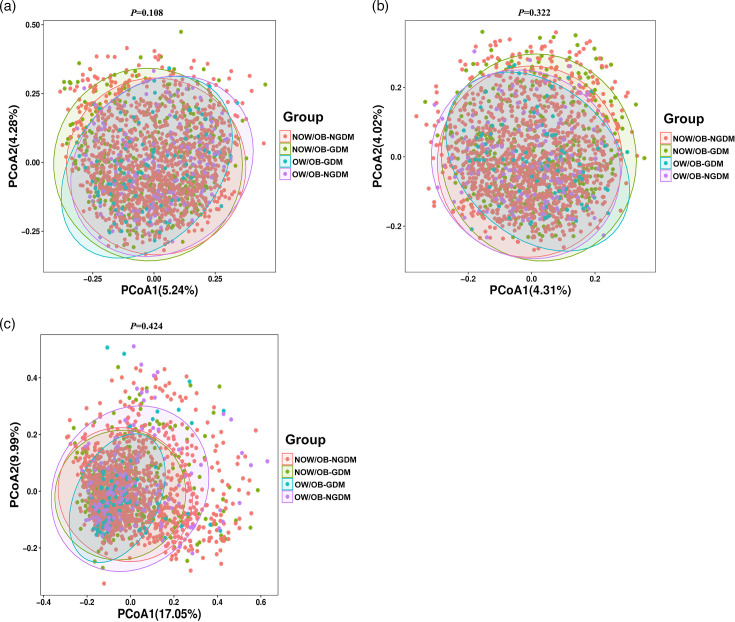
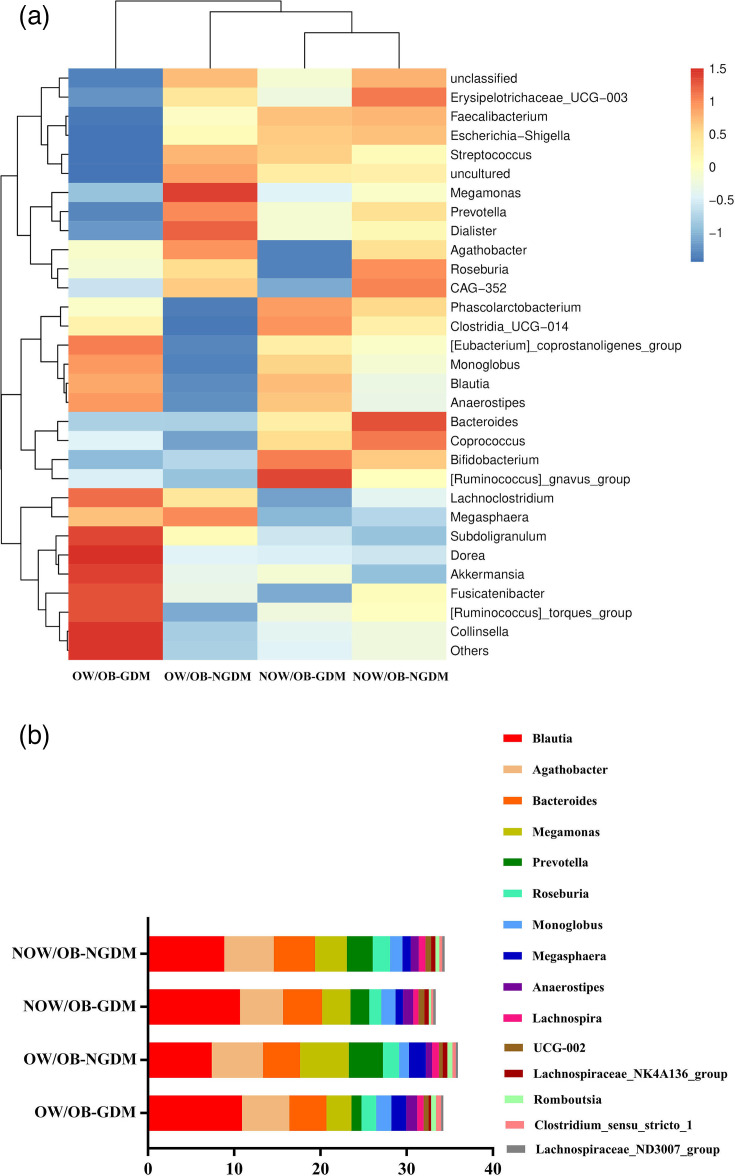
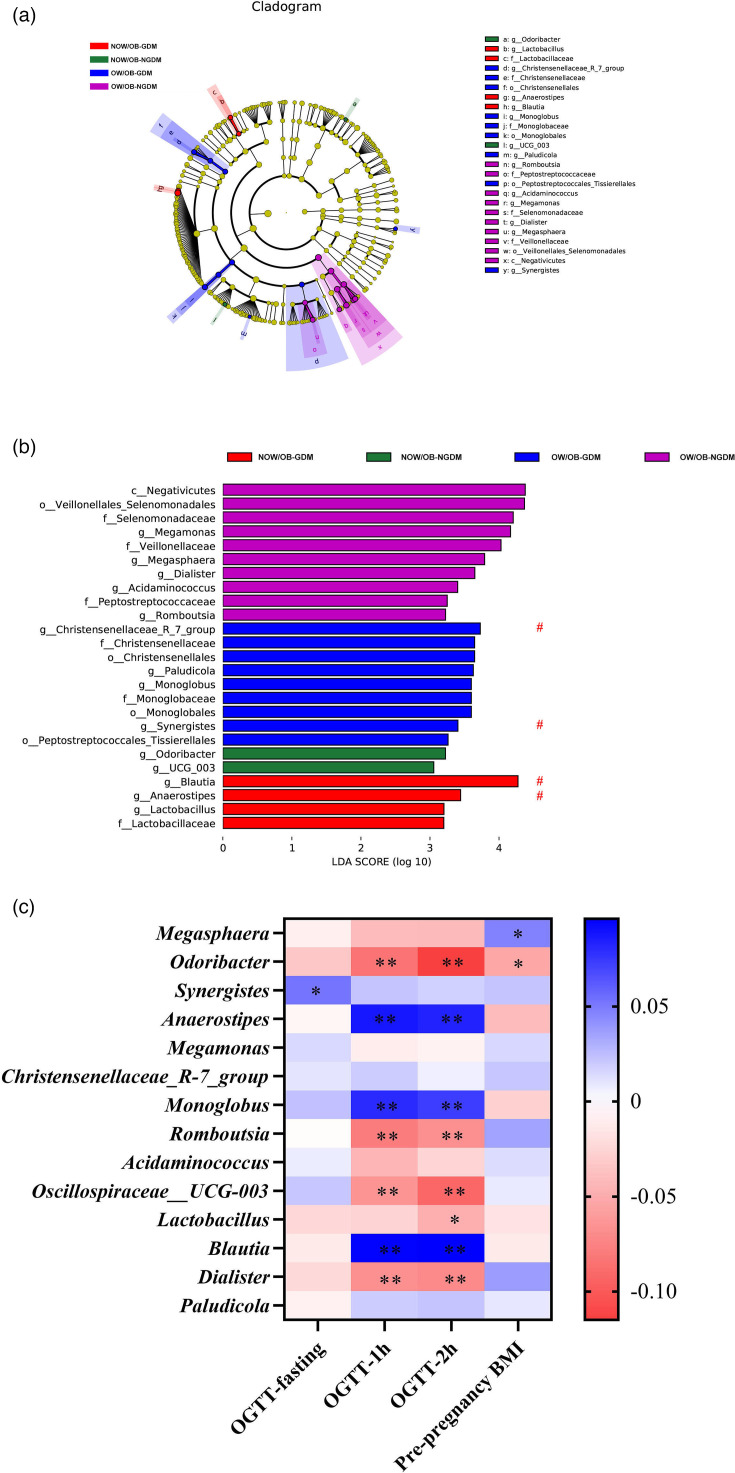
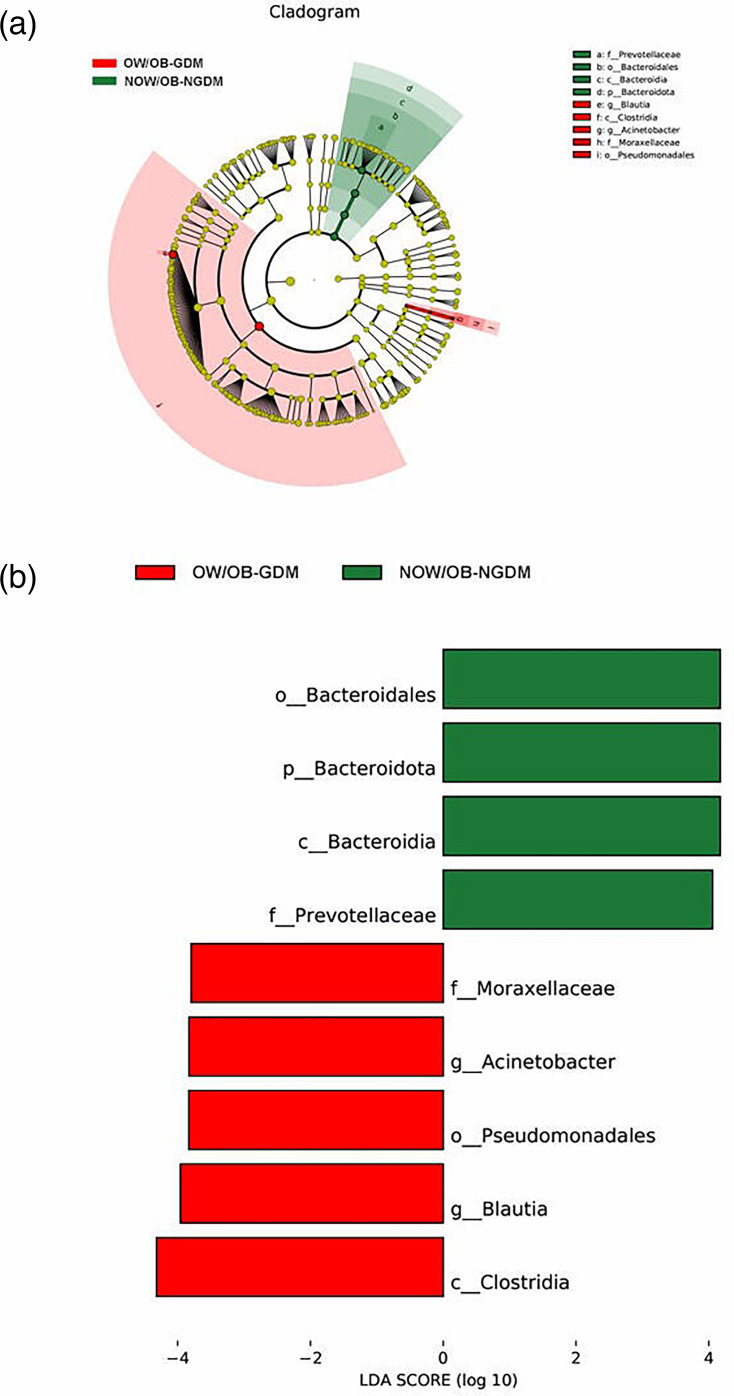
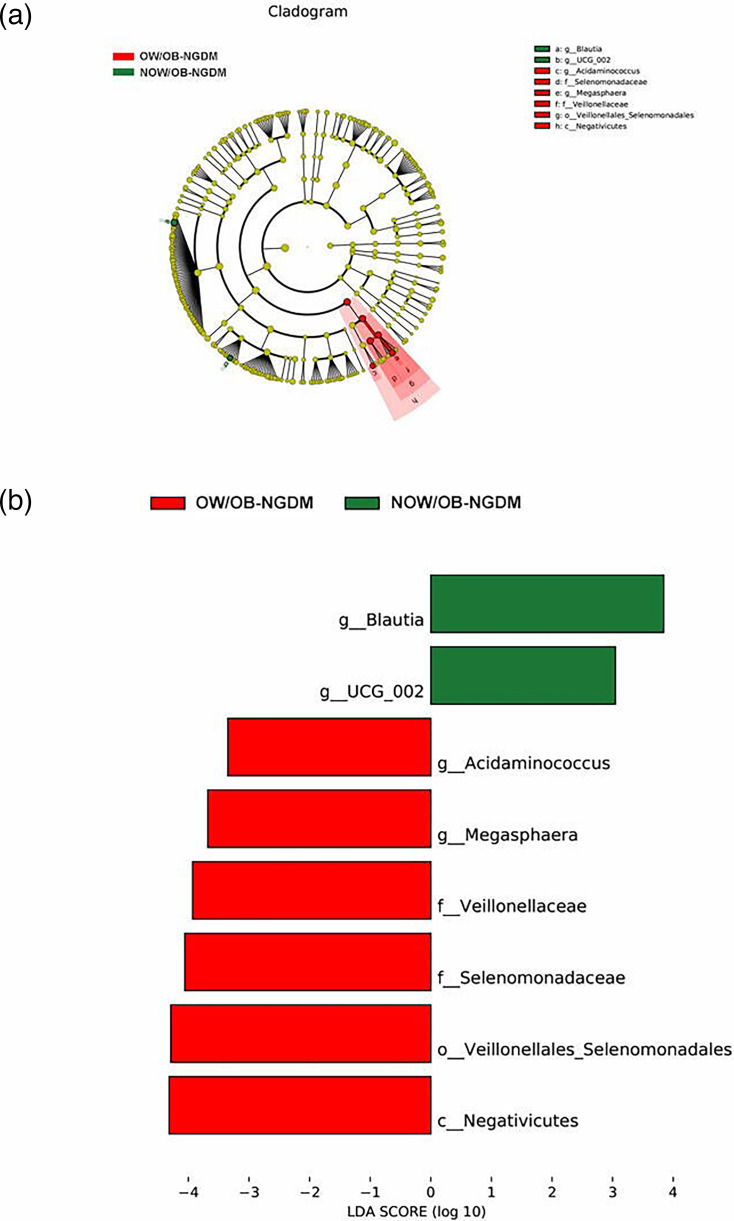
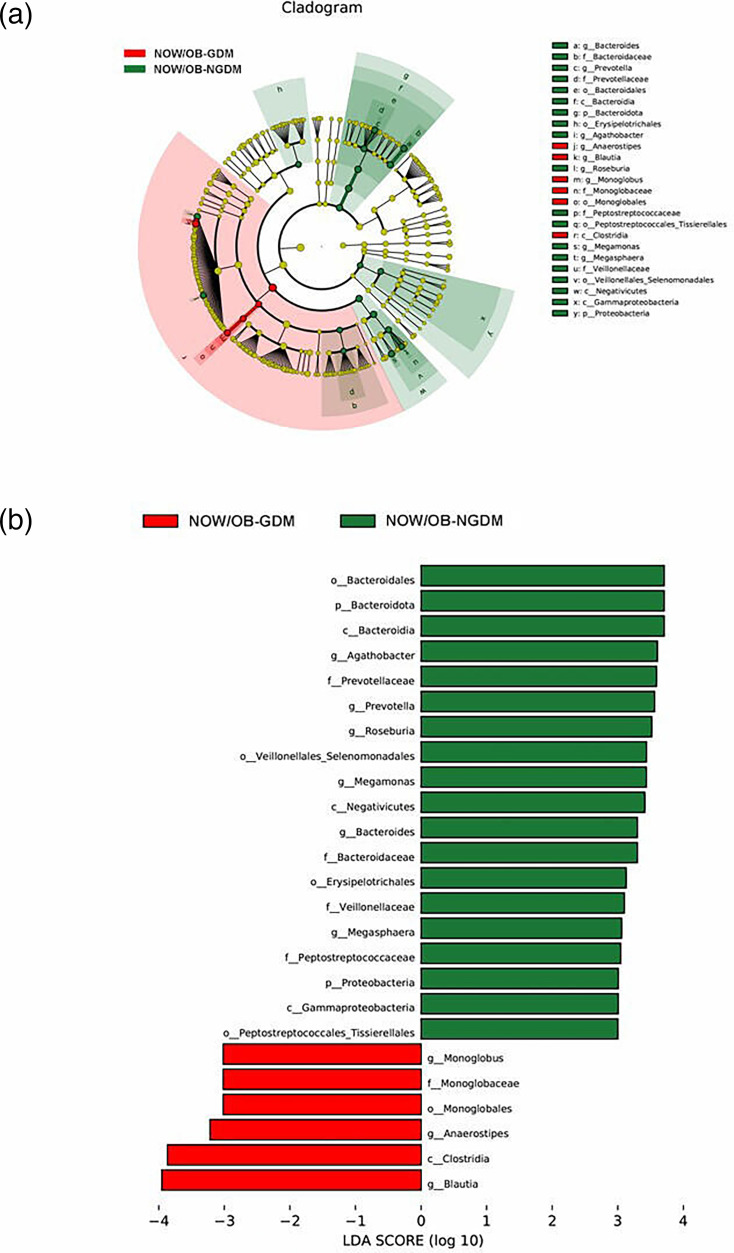
Introduction. Gestational diabetes mellitus (GDM) is one of the most common complications of pregnancy and negatively affects the health of mothers and infants. The aim of this study was to explore the associations between gut microbiota and the risk of GDM amongst overweight/obese women, and the interaction between gut microbiota dysbiosis and overweight/obesity in pregnant women with GDM.Hypothesis/Gap statement. Previous studies revealed that there may be a link between gut microbiota and GDM and obesity, but these studies have not reported the associations between gut microbiota and the risk of GDM amongst overweight/obese women, whilst the interaction between gut microbiota dysbiosis and overweight/obesity in pregnant women with GDM remains unknown.Aim. Based on a prospective cohort study, we explored the composition of gut microbiota in overweight/obese pregnant women and its association with GDM.Methodology.Participants (n=1820) were enrolled from the Pregnancy Metabolic Disease and Adverse Pregnancy Outcome cohort in Guangzhou, China, between 2019 and 2021. The participants' information and faecal samples were collected, and the relative abundance of faecal microbiota was profiled using 16S rRNA V4 region sequencing. Pregnant women were divided into four groups: non- overweight (NOW)/obese without GDM (OB- NGDM), overweight (OW)/OB- NGDM, NOW/obese with GDM (OB- GDM) and OW/OB- GDM. Linear discriminant analysis effect size (LEfSe) analysis, Spearman's correlation analysis and t- test were performed to estimate the association amongst microbiota, pre- pregnancy BMI and oral glucose tolerance test (OGTT) glucose levels.Results. Blautia, Anaerostipes, Synergistes (P<0.001) and Christensenellaceae_R_7_group (P=0.007) were significantly different between NOW/OB-GDM and OW/OB-GDM groups after adjusting for age. Odoribacter, Anaerostipes, Monoglobus, Romboutsia, Oscillospiraceae__UCG-003, Blautia and Dialisterwere significantly correlated with both OGTT 1 h (P<0.001) and 2 h (P<0.05) blood glucose levels, whilst Lactobacillus(P<0.001) were significantly correlated with OGTT 2 h blood glucose levels. Synergistes(P<0.001) were significantly correlated with OGTT fasting glucose levels, and Megasphaera and Odoribacter(P<0.05) were significantly correlated with pre-pregnancy BMI.Conclusions. GDM and OB/OW women was experiencing microbiota dysbiosis, especially the microbial communities related to glucose metabolism.

Keywords: gestational diabetes mellitus; gut microbiota; obesity; overweight.


Conflict of interest statement

The authors declare that there are no conflicts of interest.

Figures

Fig. 1.
Fig. 1.. Alpha-diversity index amongst pregnant women with GDM and OW/OB. (a) Chao1 indices evaluate the number of OTUs in the sample, (b) Pielou indices evaluate the species evenness, (c) Shannon indices assess the richness and evenness of the species composition and (d) Simpson indices assess the species diversity. *P<0.05.
Fig. 2.
Fig. 2.. Beta diversity index between the pregnant women with GDM and OW/OB. PCoA plots of the faecal microbiome based on Bray–Curtis distances (a), Jaccard distances (b) and weighted UniFrac distances (c). P-values were obtained by two-sided PERMANOVA.
Fig. 3.
Fig. 3.. Composition and difference of bacterial taxa amongst OW/OB-GDM, OW/OB-NGDM, NOW/OB-GDM and NOW/OB-NGDM groups. (a) Heat map demonstrated the differential comparisons of bacterial taxa amongst the four groups. (b) Stacked bar plot of the top 15 significantly different bacterial abundances amongst the four groups.
Fig. 4.
Fig. 4.. The shift of gut microbiota in OW/OB-GDM, OW/OB-NGDM, NOW/OB-GDM and NOW/OB-NGDM groups. (a) Cladogram and (b) scores of differential taxa showing the most differentially abundant taxa identified by LEfSe. Purple indicates clades enriched in the OW/OB-NGDM group, blue indicates clades enriched in the OW/OB-GDM group, green indicates clades enriched in the NOW/OB-NGDM group and red indicates clades enriched in the NOW/OB-GDM group. Only genera meeting an LDA score threshold >3 are shown. # means significant genus after adjusting for age using MaAsLin2. (c) Heat map of the correlation amongst the different taxa, OGTT and pre-pregnancy BMI. *P<0.05; **P<0.001. All microbiota data (n=1,820) were used.
Fig. 5.
Fig. 5.. Pairwise LEfSe analysis of gut microbiota in OW/OB-GDM and NOW/OB-NGDM groups. (a) Cladogram and (b) scores of differential taxa showing the most differentially abundant taxa identified by LEfSe. Red indicates clades enriched in the OW/OB-GDM group, and green indicates clades enriched in the NOW/OB-NGDM group. Only genera meeting an LDA score threshold >3 are shown.
Fig. 6.
Fig. 6.. Pairwise LEfSe analysis of gut microbiota in OW/OB-NGDM and NOW/OB-NGDM groups. (a) Cladogram and (b) scores of differential taxa showing the most differentially abundant taxa identified by LEfSe. Red indicates clades enriched in the OW/OB-NGDM group, and green indicates clades enriched in the NOW/OB-NGDM group. Only genera meeting an LDA score threshold >3 are shown.
Fig. 7.
Fig. 7.. Pairwise LEfSe analysis of gut microbiota in NOW/OB-GDM and NOW/OB-NGDM groups. (a) Cladogram and (b) scores of differential taxa showing the most differentially abundant taxa identified by LEfSe. Red indicates clades enriched in the NOW/OB-GDM group, and green indicates clades enriched in the NOW/OB-NGDM group. Only genera meeting an LDA score threshold >3 are shown.

Similar articles

References

    1. Ye W, Luo C, Huang J, Li C, Liu Z, et al. Gestational diabetes mellitus and adverse pregnancy outcomes: systematic review and meta-analysis. BMJ. 2022;377:e067946. doi: 10.1136/bmj-2021-067946. - DOI - PMC - PubMed
    1. Zhang T-N, Wang W, Huang X-M, Gao S-Y. Non-coding RNAs and extracellular vehicles: their role in the pathogenesis of gestational diabetes mellitus. Front Endocrinol. 2021;12:664287. doi: 10.3389/fendo.2021.664287. - DOI - PMC - PubMed
    1. Illsley NP. Glucose transporters in the human placenta. Placenta. 2000;21:14–22. doi: 10.1053/plac.1999.0448. - DOI - PubMed
    1. Hiden U, Lassance L, Tabrizi NG, Miedl H, Tam-Amersdorfer C, et al. Fetal insulin and IGF-II contribute to gestational diabetes mellitus (GDM)-associated up-regulation of membrane-type matrix metalloproteinase 1 (MT1-MMP) in the human feto-placental endothelium. J Clin Endocrinol Metab. 2012;97:3613–3621. doi: 10.1210/jc.2012-1212. - DOI - PubMed
    1. Sweeting A, Wong J, Murphy HR, Ross GP. A clinical update on gestational diabetes mellitus. Endocr Rev. 2022;43:763–793. doi: 10.1210/endrev/bnac003. - DOI - PMC - PubMed

Substances

LinkOut - more resources