. 2025 May 14:13:RP96868.
doi: 10.7554/eLife.96868.

Thymic dendritic cell-derived IL-27p28 promotes the establishment of functional bias against IFN-γ production in newly generated CD4+ T cells through STAT1-related epigenetic mechanisms

Affiliations

Thymic dendritic cell-derived IL-27p28 promotes the establishment of functional bias against IFN-γ production in newly generated CD4+ T cells through STAT1-related epigenetic mechanisms

Jie Zhang et al. Elife. .

Abstract

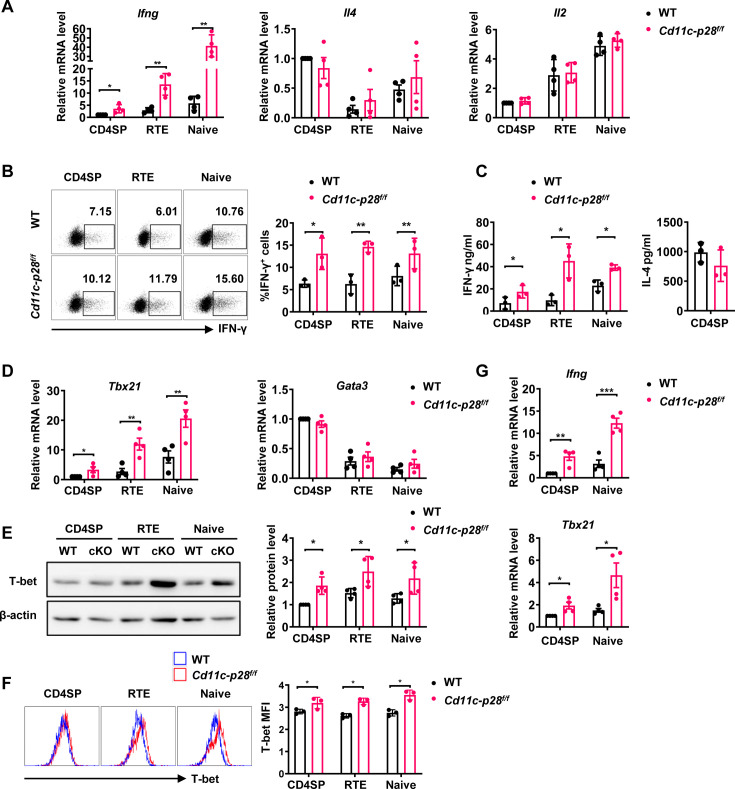
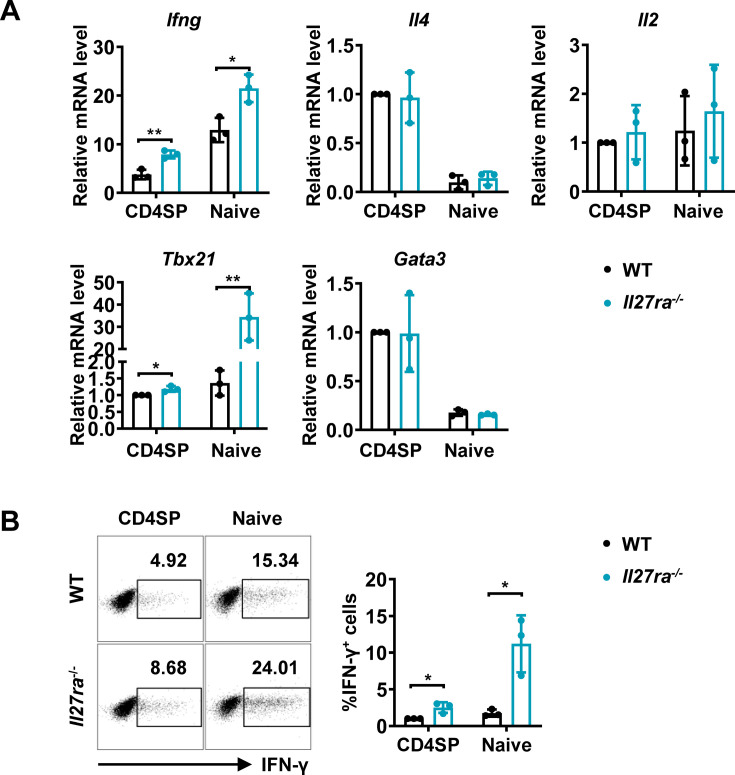
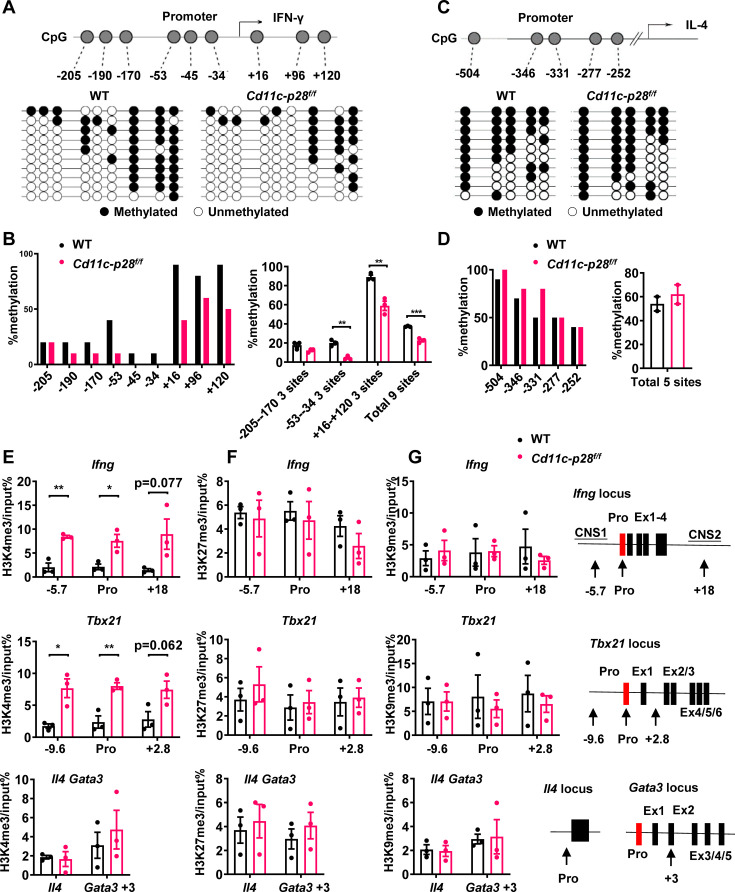
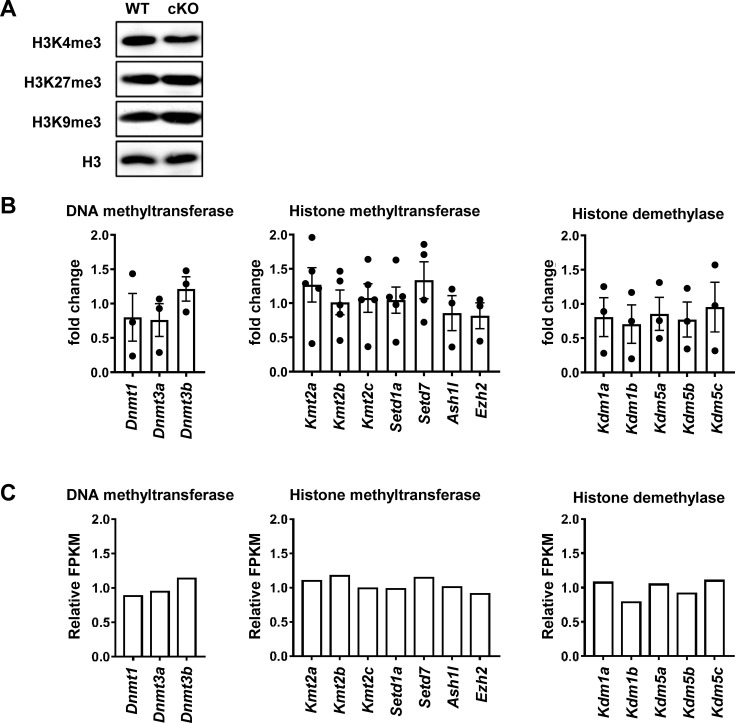
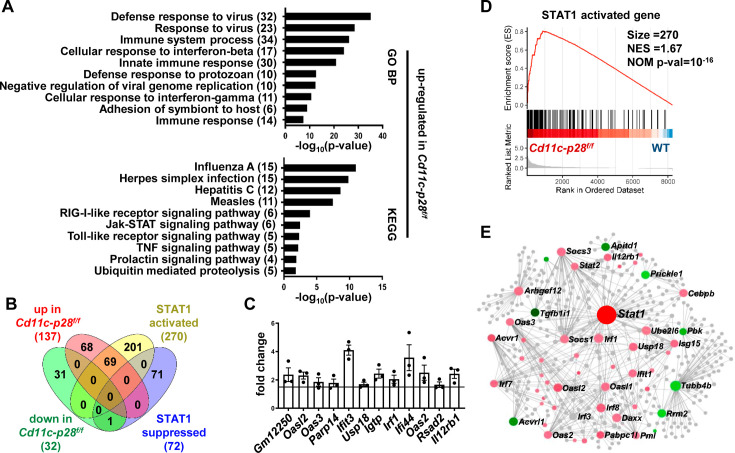
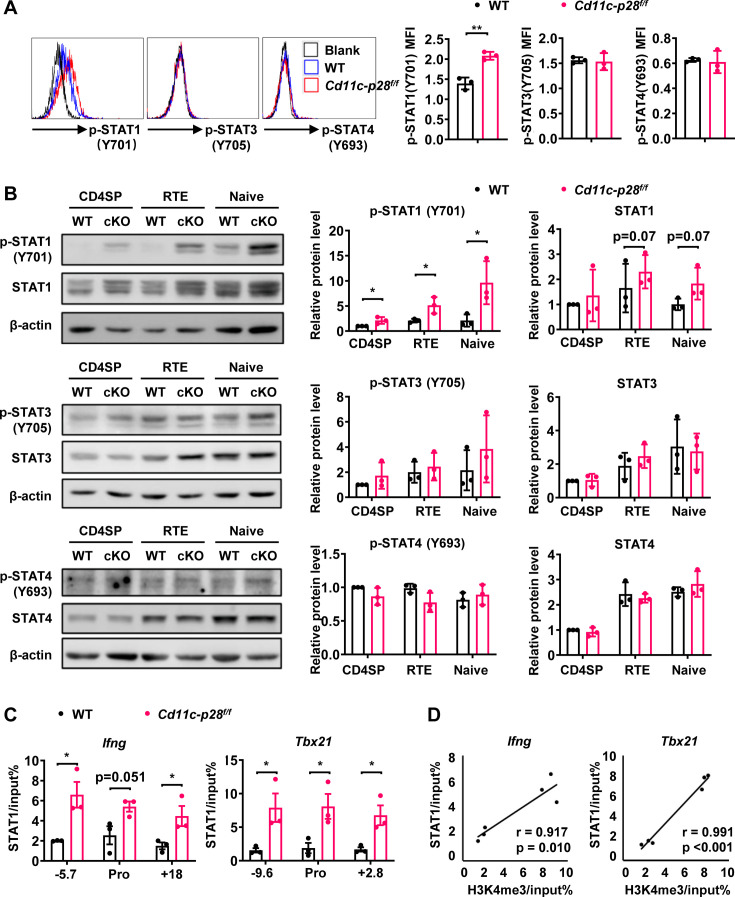
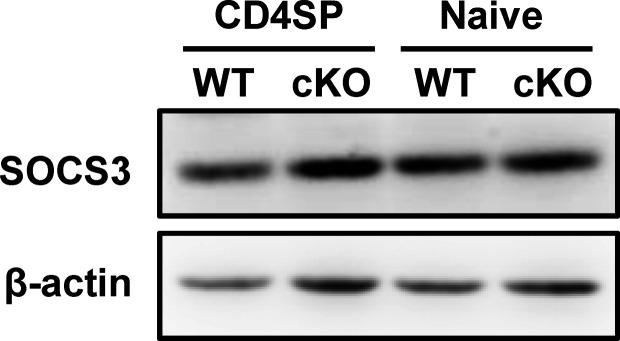
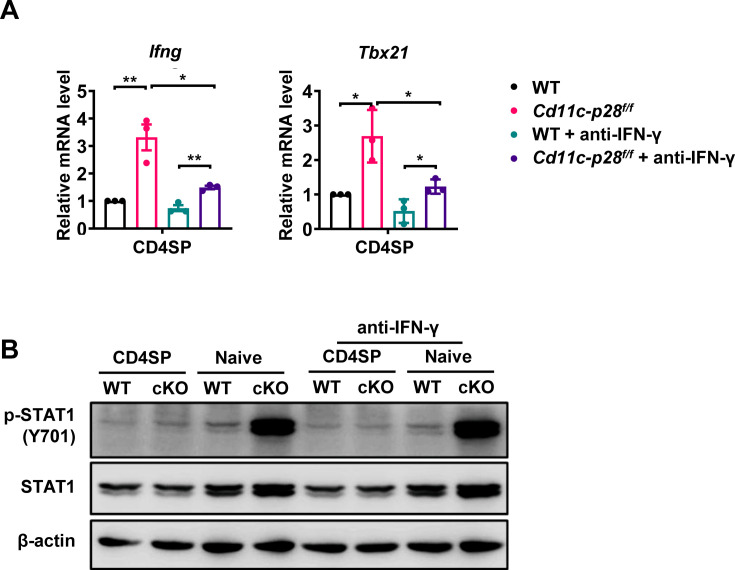
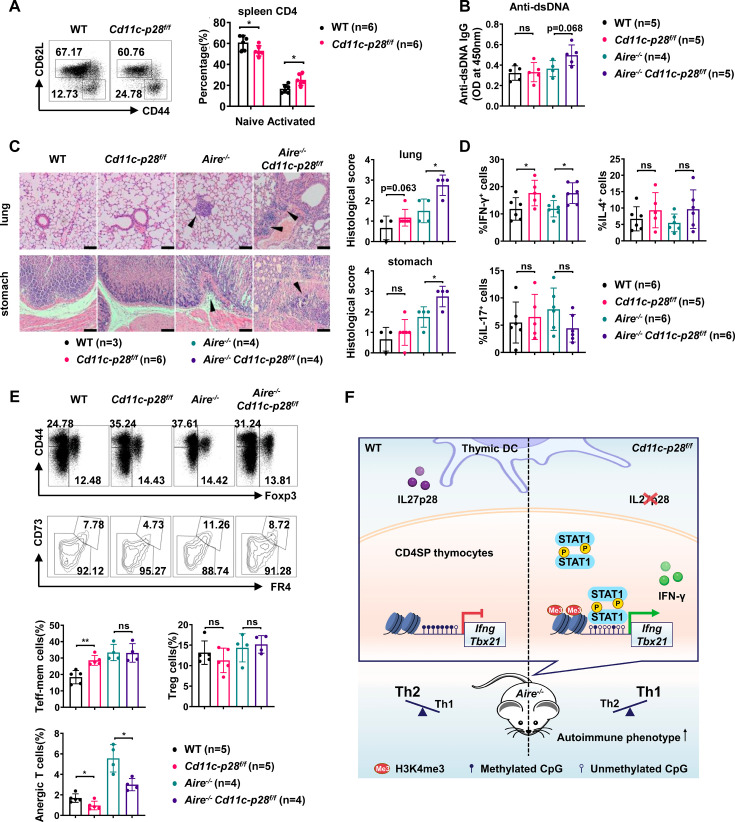
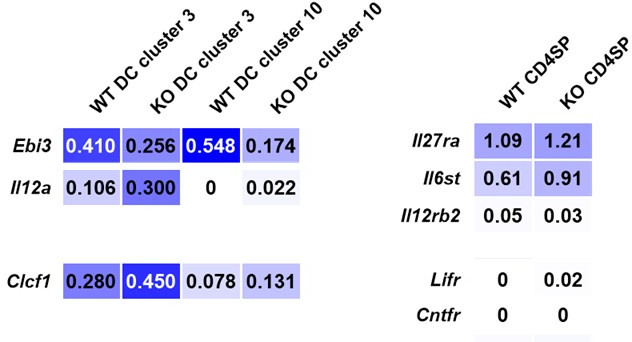
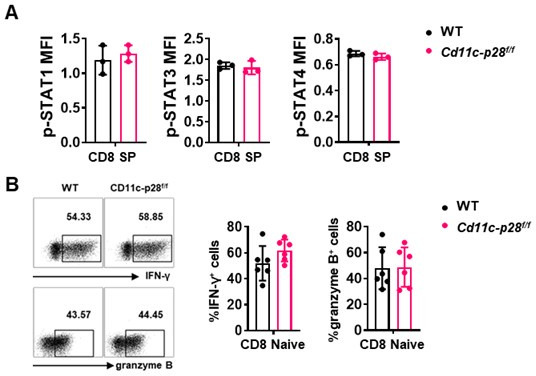
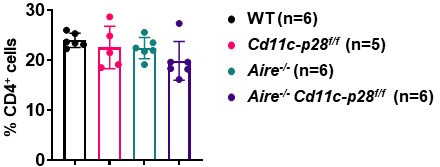
The newly generated CD4 single-positive (SP) T lymphocytes are featured by enhanced IL-4 but repressed IFN-γ production. The mechanisms underlying this functional bias remain elusive. Previous studies have reported that CD4+ T cells from mice harboring dendritic cell (DC)-specific deletion of IL-27p28 display an increased capacity of IFN-γ production upon TCR stimulation. Here, we demonstrated that similarly altered functionality occurred in CD4SP thymocytes, recent thymic emigrants (RTEs), as well as naive T cells from either Cd11c-p28f/f mice or mice deficient in the α subunit of IL-27 receptor. Therefore, DC-derived IL-27p28-triggered, IL-27Rα-mediated signal is critically involved in the establishment of functional bias against IFN-γ production during their development in the thymus. Epigenetic analyses indicated reduced DNA methylation of the Ifng locus and increased trimethylation of H3K4 at both Ifng and Tbx21 loci in CD4SP thymocytes from Cd11c-p28f/f mice. Transcriptome profiling demonstrated that Il27p28 ablation resulted in the coordinated up-regulation of STAT1-activated genes. Concurrently, STAT1 was found to be constitutively activated. Moreover, we observed increased accumulation of STAT1 at the Ifng and Tbx21 loci and a strong correlation between STAT1 binding and H3K4me3 modification of these loci. Of note, Il27p28 deficiency exacerbated the autoimmune phenotype of Aire-/- mice. Collectively, this study reveals a novel mechanism underlying the functional bias of newly generated CD4+ T cells and the potential relevance of such a bias in autoimmunity.

Keywords: IFN-γ; IL-27p28; Th2 bias; autoimmune disease; immunology; inflammation; mouse; single positive thymocyte.


Conflict of interest statement

JZ, HT, HW, XP, RJ, YZ No competing interests declared

Figures

Figure 1.
Figure 1.. Elevated IFN-γ production and T-bet expression in Cd11c-p28f/f mice initiated from CD4SP thymocytes stage.
(A) CD4SP (GFP+CD4+CD8-CD44lo) thymocytes, CD4+ RTEs (GFP+CD4+CD8-CD25-CD44lo) and CD4+ naive (GFP-CD4+CD8-CD25-CD44lo) T cells were sorted from 6- to 8-week-old Cd11c-p28f/f mice and WT littermates, stimulated with plate coated anti-CD3 (2 µg/mL) and soluble anti-CD28 (1 µg/mL) for 12 hr. mRNA levels of Ifng, Il4, and Il2 were determined by qPCR. Data: mean ± SD (n=4, duplicates). (B) Sorted cells were cultured under Th0 conditions for 3 days. The frequency of IFN-γ-producing CD4+ T cells were measured by intracellular staining. Representative dot plots (left) and statistical data (right, mean ± SD, n=3). (C) Supernatants from 3-day cultures were analyzed for IFN-γ and IL-4 by ELISA. Data: mean ± SD (n=3). (D) mRNA levels of Tbx21 and Gata3 in sorted cells were determined by qPCR. Data: mean ± SD (n=4, duplicates). (E–F) T-bet protein levels were assessed by western blot (E) and flow cytometry (F) after 3-day culture. Data: mean ± SD (n=3). (G) Freshly sorted cells were lysed in Trizol, and Ifng and Tbx21 mRNA levels were determined by qPCR. Data: mean ± SD (n=4, duplicates). Statistical differences: * p<0.05, ** p<0.01, *** p<0.001 (Student’s t-test).
Figure 1—figure supplement 1.
Figure 1—figure supplement 1.. The production of IL-2 and TNF-α was not altered during CD4SP thymocytes maturation for p28 deficiency.
CD4SP thymocytes, CD4+ RTEs and naive CD4+ T cells from Cd11c-p28f/f and WT mice were sorted, cultured under Th0 conditions for 3 days, and analyzed by intracellular staining. Representative dot plots (left) and statistical data (mean ± SD, right; n=3) were shown. No significant differences were observed (Student’s t-test).
Figure 1—figure supplement 2.
Figure 1—figure supplement 2.. In vitro differentiation of CD4+ T cells under polarized conditions is unaffected by p28 deficiency.
Sorted CD4SP thymocytes, CD4+ RTEs, and CD4+ naive T cells from Cd11c-p28f/f and WT mice were cultured under Th1 (A–B), Th2 (C–D), Th17 (E) and Treg (F) conditions for 3 days. (A) Frequency of IFN-γ+ cells measured by intracellular staining. Representative dot plots (left) and statistical data (mean ± SD, right; n=4). (B) IFN-γ concentration in the supernatants from Th1 cultures measured by ELISA (mean ± SD, n=3). (C) Frequency of IL-4+ cells measured by intracellular staining. Representative dot plots (left) and statistical data (mean ± SD, right; n=2). (D) IL-4 concentration in supernatants from Th2 cultures measured by ELISA (mean ± SD, right; n=2). (E–F) Frequency of IL-17A+ (E) or Foxp3+ (F) cells were measured by intracellular staining. Representative dot plots (left) and statistical data (mean ± SD, right; n=3). (G) CD8+ naive T cells were cultured under Th0 conditions for 3 days. The frequency of IFN-γ-, and granzyme B-producing CD8+ T cells were determined analyzed by intracellular staining. Representative dot plots (left) and quantification (right, mean ± SD, n=6). (H) Frequency of IFN-γ+ cells in CD4SP thymocytes and CD4+ naive T cells from Il27ra-/- and WT mice cultured under Th1 conditions. Representative dot plots (top) and statistical data (mean ± SD, bottom; n=3). No significant differences were observed (Student’s t test).
Figure 2.
Figure 2.. Enhanced IFN-γ production and T-bet expression in Il27ra-/- mice initiated at the CD4SP thymocytes stage.
(A) CD4SP thymocytes and naive CD4+ T cells were isolated from Il27ra-/- and WT mice, stimulated with plate-coated anti-CD3 (2 µg/mL) and soluble anti-CD28 (1 µg/mL) for 12 hours. mRNA levels of Ifng, Il4, Il2, Tbx21, and Gata3 were determined by qPCR. Data: mean ± SD (n=3, duplicates). (B) CD4SP thymocytes and CD4+ naive T cells were cultured under Th0 conditions for 3 days. The frequency of IFN-γ-producing CD4+ T cells were analyzed by intracellular staining. Representative dot plots (left) and quantification (right, mean ± SD, n=3). Significance: * p<0.05, ** p<0.01 (Student’s t-test).
Figure 3.
Figure 3.. Distinct DNA and H3K4 methylation patterns at Ifng and Tbx21 promoter regions in CD4SP thymocytes from IL27p28-deficient mice.
(A) DNA methylation analysis of nine CpG sites in the Ifng promoter using sodium bisulfite-treated genomic DNA from GFP+CD4+CD8-CD44lo CD4SP thymocytes. Each row represents a sequenced allele (n=10 clones from one of the three independent experiments). Filled (●) and open (○) circles denote methylated and unmethylated cytosine, respectively. (B) Left: Percent methylation at individual CpG sites from one representative experiment. Right: Average methylation of three adjacent site groups (group1: −205,–190, –170; group2: −53,–45, –34; group3:+16,+96,+120) and all CpG sites (mean ± SD, n=3). (C) DNA methylation analysis of five CpG sites upstream of the Il4 transcription start site using sodium bisulfite-treated genomic DNA from GFP+CD4+CD8-CD44lo CD4SP thymocytes. Each row represents a sequenced allele (n=10 clones from the two independent experiments). Filled (●) and open (○) circles denote methylated and unmethylated cytosine, respectively. (D) Left: graphs show the percentage of methylation at each individual site (left panel) or all CpG sites (right panel). (E–G) Histone trimethylation analysis in freshly isolated CD4SP thymocytes from IL27p28-deficient and WT mice. ChIP-qPCR was performed using antibodies against H3K4me3 (E), H3K27me3 (F), and H3K9me3 (G). qPCR primers targeted promoter and trans-regulatory regions of Ifng, Tbx21, Il4, and Gata3. Data: mean ± SEM (n=3, duplicates). Significance: * p<0.05; ** p<0.01 (Student’s t-test). Abbreviation: pro., promoter.
Figure 3—figure supplement 1.
Figure 3—figure supplement 1.. Basal levels of H3K4me3, H3K27me3, H3K9me3, and methylation-related enzymes are unaffected by p28 deficiency.
(A) Global H3K4me3, H3K27me3, and H3K9me3 levels in CD4+ naive T cells detected by western blotting. H3 served as an internal control. Results are representative of three independent experiments. (B) WT CD4SP thymocytes were sorted, stimulated with IL-27 (2 ng/mL) for 12 hr, and analyzed for mRNA levels of histone methyltransferases, demethylases, and DNA methyltransferases by qPCR. Data, shown as fold change over untreated cells (mean ± SEM; n=3–5), revealed no significant differences. (C) Relative FPKM of epigenetic related enzymes in CD4SP thymocytes from RNA-seq data (Figure 4), shown as FPKMCd11c-p28f/f/FPKMWT. No significant changes were observed.
Figure 4.
Figure 4.. Increased expression of STAT1-activated genes in CD4SP thymocytes from Cd11c-p28f/f mice.
RNA-seq was performed to analyze the transcriptome of CD4SP thymocytes from Cd11c-p28f/fand WT mice. (A) Top 10 enriched Gene Ontology (GO) biological process and Kyoto Encyclopedia of Genes and Genomes (KEGG) pathways for up-regulated differentially expressed genes (DEGs) in Cd11c-p28f/f mice. (B) Overlap between DEGs in Cd11c-p28f/f mice and STAT1-activated and suppressed genes. Numbers indicate overlapping genes in each category. (C) Validation of RNA-Seq results by qPCR for representative up-regulated genes. Data: fold change in Cd11c-p28f/f versus WT mice (mean ± SEM, n=3, duplicates). (D) Gene Set Enrichment Analysis (GSEA) showing coordinated upregulation of STAT1-activated genes in Cd11c-p28f/f CD4SP thymocytes. (E) Protein-protein interaction network of DEGs. Nodes represent proteins; edges indicate interactions. Larger nodes denote higher interaction degrees. Red: up-regulated; green: down-regulated; gray: non-DEGs connected to the network (added by Network Analyst).
Figure 5.
Figure 5.. Enhanced STAT1 activation in CD4SP thymocytes from Cd11c-p28f/f mice.
(A) Intracellular staining of freshly isolated thymocytes from Cd11c-p28f/f and WT mice using antibodies against phosphorylated STAT1 (Y701), STAT3 (Y705), and STAT4 (Y693). Representative histograms for CD4SP thymocytes (left) and mean fluorescence intensity (MFI) from three independent experiments (right, mean ± SD). (B) Western blot analysis of total and phosphorylated STAT1 (Y701), STAT3 (Y705), and STAT4 (Y693) in purified CD4SP thymocytes, CD4+ RTEs, and naive CD4+ T cells from Cd11c-p28f/f and WT mice. Representative blots (left) and relative protein levels quantified by densitometry and normalization to β-actin (right, mean ± SD, n=3). (C) Increased STAT1 binding to promoter and regulatory regions of Tbx21 and Ifng loci in Cd11c-p28f/f mice. (D) Correlation between STAT1 binding and H3K4me3 levels at Tbx21 and Ifng loci. Significance: * p<0.05; ** p<0.01.
Figure 5—figure supplement 1.
Figure 5—figure supplement 1.. SOCS3 levels in CD4+ T cells from p28-deficient mice.
CD4SP thymocytes and naive CD4+ T cells were freshly isolated from WT and Cd11c-p28f/f mice, and SOCS3 expression was assessed by western blotting. β-actin served as an internal control. Data are representative of three independent experiments.
Figure 5—figure supplement 2.
Figure 5—figure supplement 2.. The Stat1-dependent hyper-transcription of Ifng and Tbx21 in p28 deficient CD4+ T cells is not rescued by IFN-γ blockade.
(A) The CD4SP thymocytes and naive CD4+ T cells from Cd11c-p28f/f and WT mice were stimulated with plate-bound anti-CD3 (2 μg/mL) and soluble anti-CD28 (1 μg/mL) without or with anti-IFN-γ (10 μg/mL) for 12 hr. Ifng and Tbx21 mRNA levels were determined by qPCR. Data (mean ± SEM) are representative of three independent experiments. *, p<0.05 and **, p<0.01 (Student’s t-test). (B) The CD4SP thymocytes and CD4+ naive T cells from Cd11c-p28f/f and WT mice were cultured without or with anti-IFN-γ (10 μg/mL) for 2 hr. STAT1 phosphorylation (pY701) was examined by western blotting. Data are representative of three independent experiments.
Figure 6.
Figure 6.. Exacerbated autoimmune responses in Aire-/- mice in the absence of IL27p28.
(A) CD44 and CD62L expression in CD4+ T cells from splenocytes of 6–8 week-old WT (n=6) and Cd11c-p28f/f (n=6) mice. Representative dot plots (left) and percentages of CD44loCD62L+ naive and CD44hiCD62L- activated T cells are shown (right, mean ± SD). (B–D) WT, Cd11c-p28f/f, Aire-/-, and Cd11c-p28f/fAire-/- mice (24–30 weeks old) were analyzed. Each symbol represents one mouse (mean ± SD). (B) Serum anti-dsDNA antibody levels (ELISA). (C) H&E staining (left) and histological scores (right) of the lung and stomach. Arrows mark lymphocytic infiltrates. Scale bar = 100 μm. (D) Percentages of IFN-γ+, IL-4+, and IL-17A+ CD4+ T cells in lung tissue after PMA/ionomycin stimulation. (E) Splenocytes from 12-week-old mice were stained for CD44, Foxp3, CD73, and FR4. Percentages of anergic (CD4+Foxp3CD44hiCD73hiFR4hi), effector/memory (CD4+Foxp3CD44hiCD73loFR4lo), and regulatory (CD4+Foxp3+) T cells are shown. (F) Schematic summary of the study. * p<0.05; ** p<0.01; ns, not significant.
Author response image 1.
Author response image 1.. Single-cell RNA sequencing data from CD11c-cre p28f/f (KO) and wild-type thymocytes (Signal Transduct Target Ther. 2022, DOI: 10.1038/s41392-022-01147-z).
Author response image 2.
(A) Intracellular staining was performed with freshly isolated thymocytes from Cd11c-p28f/f mice and WT littermates mice using antibodies against phosphorylated STAT1 (Y701), STAT3 (Y705), and STAT4 (Y693). The mean fluorescence intensity (MFI) for CD8 SP from three independent experiments (mean ± SD, n=3). (B) CD8+ naive T cells were cultured under Th0 conditions for 3 days. The frequency of IFN-γ-, and granzyme B-producing CD8+ T cells were determined analyzed by intracellular staining. Representative dot plots (left) and quantification (right, mean ± SD, n=6).
Author response image 3.

Update of

  • doi: 10.1101/2024.03.02.583138
  • doi: 10.7554/eLife.96868.1
  • doi: 10.7554/eLife.96868.2

Similar articles

References

    1. Ashby KM, Hogquist KA. A guide to thymic selection of T cells. Nature Reviews. Immunology. 2024;24:103–117. doi: 10.1038/s41577-023-00911-8. - DOI - PubMed
    1. Barnholt KE, Kota RS, Aung HH, Rutledge JC. Adenosine blocks IFN-gamma-induced phosphorylation of STAT1 on serine 727 to reduce macrophage activation. Journal of Immunology. 2009;183:6767–6777. doi: 10.4049/jimmunol.0900331. - DOI - PMC - PubMed
    1. Berkley AM, Hendricks DW, Simmons KB, Fink PJ. Recent thymic emigrants and mature naive T cells exhibit differential DNA methylation at key cytokine loci. Journal of Immunology. 2013;190:6180–6186. doi: 10.4049/jimmunol.1300181. - DOI - PMC - PubMed
    1. Bhaumik S, Giffon T, Bolinger D, Kirkman R, Lewis DB, Weaver CT, Randolph DA. Retinoic acid hypersensitivity promotes peripheral tolerance in recent thymic emigrants. Journal of Immunology. 2013;190:2603–2613. doi: 10.4049/jimmunol.1200852. - DOI - PMC - PubMed
    1. Cao YX, Doodes PD, Glant TT, Finnegan A. IL-27 Induces a Th1 immune response and susceptibility to experimental arthritis. The Journal of Immunology. 2008;180:922–930. doi: 10.4049/jimmunol.180.2.922. - DOI - PubMed

Associated data