

Metagenomic analysis reveals distinct patterns of gut microbiota features with diversified functions in C. difficile infection (CDI), asymptomatic carriage and non-CDI diarrhea
- PMID: 40366862
- PMCID: PMC12080279
- DOI: 10.1080/19490976.2025.2505269
Metagenomic analysis reveals distinct patterns of gut microbiota features with diversified functions in C. difficile infection (CDI), asymptomatic carriage and non-CDI diarrhea
Abstract
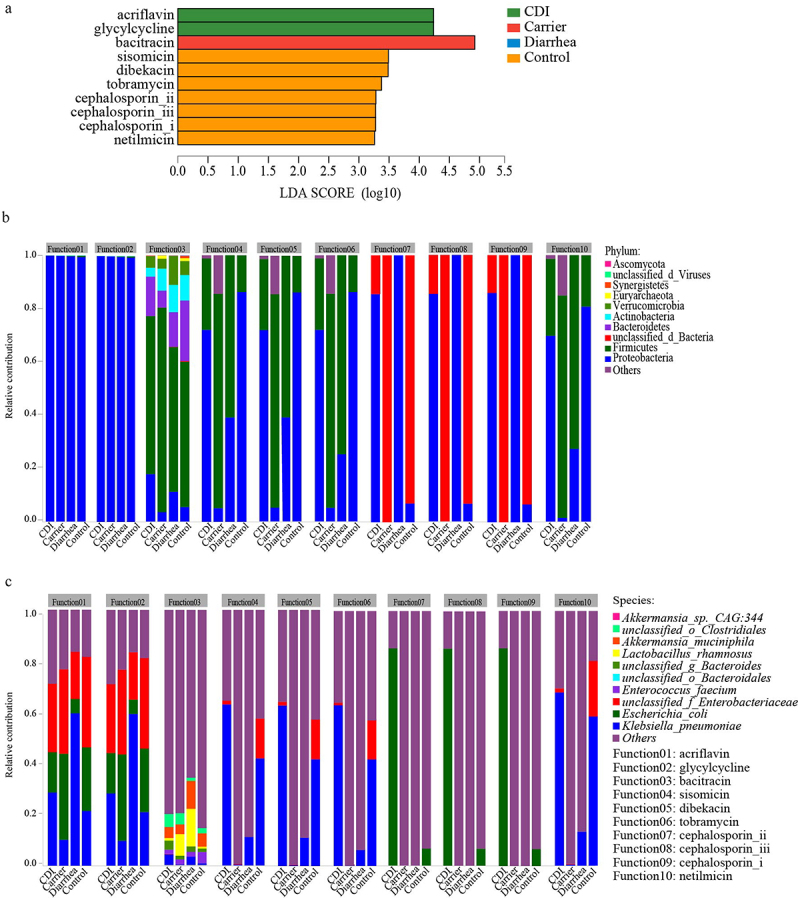
Clostridioides difficile infection (CDI) has been recognized as a leading cause of healthcare-associated infections and a considerable threat to public health globally. Increasing evidence suggests that the gut microbiota plays a key role in the pathogenesis of CDI. The taxonomic composition and functional capacity of the gut microbiota associated with CDI have not been studied systematically. Here, we performed a comprehensive shotgun metagenomic sequencing in a well-characterized human cohort to reveal distinct patterns of gut microbiota and potential functional features associated with CDI. Fecal samples were collected from 104 inpatients, including : (1) patients with clinically significant diarrhea and positive nucleic acid amplification testing (NAAT) and received CDI treatment (CDI, n = 47); (2) patients with positive stool NAAT but without diarrhea (Carrier, n = 17); (3) patients with negative stool NAAT but with diarrhea (Diarrhea, n = 14); and (4) patients with negative stool NAAT and without diarrhea (Control, n = 26). Downstream statistical analyses (including alpha and beta diversity analysis, differential abundance analysis, correlation network analysis, and potential functional analysis) were then performed. The gut microbiota in the Control group showed higher Chao1 index (p < 0.05), while Shannon index at KEGG module level was higher in CDI than in Carrier and Control (p < 0.05). Beta diversity for species composition differed significantly between CDI vs Carrier/Control cohorts (p < 0.05). Microbial Linear discriminant analysis Effect Size and ANCOM analysis both identified 8 species (unclassified_f_Enterobacteriaceae, Veillonella_parvula, unclassified_g_Klebsiella and etc.) were enriched in CDI, Enterobacter_aerogenes was enriched in Diarrhea, Collinsella_aerofaciens, Collinsella_sp_4_8_47FAA, Collinsella_tanakaei and Collinsella_sp_CAG_166 were enriched in Control (LDA >3.0, adjusted p < 0.05). Correlation network complexity was higher in CDI with more negative correlations than in other three cohorts. Modules involved in iron complex transport system (M00240) was enriched in CDI, ABC-2 type transport system (M00254), aminoacyl-tRNA biosynthesis (M00359), histidine biosynthesis (M00026) and inosine monophosphate biosynthesis (M00048) were enriched in Carrier, ribosome (M00178 and M00179) was enriched in Diarrhea, fluoroquinolone resistance (M00729) and aminoacyl-tRNA biosynthesis (M00360) were enriched in Control (LDA > 2.5, adjusted p < 0.05). Resistance functions of acriflavine and glycylcycline were enriched in CDI, while resistance function of bacitracin was enriched in Carrier (LDA > 3.0, adjusted p < 0.05), and the contributions of phylum and species to resistance functions differed among the four groups. Our results reveal alterations of gut microbiota composition and potential functions among four groups of differential colonization/infection status of Clostridioides difficile. These findings support the potential roles of gut microbiota and their potential functions in the pathogenesis of CDI.
Keywords: CDI; antibiotic resistance; gut microbiota; metabolomics; module.
Conflict of interest statement
CPK has acted as a paid consultant to Facile Therapeutics, Ferring Pharma, Finch, Janssen (J&J), Milky Way Life Sciences, Pfizer, Seres, Summit Therapeutics, RVAC Medicines, and Vedanta; has been a Scientific Advisory Board Member, study investigator and received grant support from Milky Way Life Sciences and was a Data Monitoring Board member for Finch Therapeutics.
Figures


References
-
- Bushman FD, Conrad M, Ren Y, Zhao C, Gu C, Petucci C, Kim M-S, Abbas A, Downes KJ, Devas N, et al. Multi-omic analysis of the interaction between Clostridioides difficile infection and pediatric inflammatory bowel disease. Cell Host & Microbe. 2020;28(3):422–33 e7. doi: 10.1016/j.chom.2020.07.020. - DOI - PMC - PubMed
-
- Ojemolon PE, Shaka H, Kwei-Nsoro R, Laswi H, Ebhohon E, Shaka A, Abusalim A-R, Mba B. Trends and disparities in outcomes of clostridioides difficile infection hospitalizations in the United States: a ten-year joinpoint trend analysis. J Clin Med Res. 2022;14(11):474–486. doi: 10.14740/jocmr4828. - DOI - PMC - PubMed
-
- Tartof SY, Rieg GK, Wei R, Tseng HF, Jacobsen SJ, Kalvin CY. A comprehensive assessment across the healthcare continuum: risk of hospital-associated Clostridium difficile infection due to outpatient and inpatient antibiotic exposure. Infect Control & Hosp Epidemiol. 2015;36(12):1409–1416. doi: 10.1017/ice.2015.220. - DOI - PubMed
MeSH terms
Grants and funding
LinkOut - more resources
Full Text Sources
Medical