

Effects of COVID-19 on the contrast sensitivity
- PMID: 40367017
- PMCID: PMC12068780
- DOI: 10.1590/1414-431X2025e14517
Effects of COVID-19 on the contrast sensitivity
Abstract
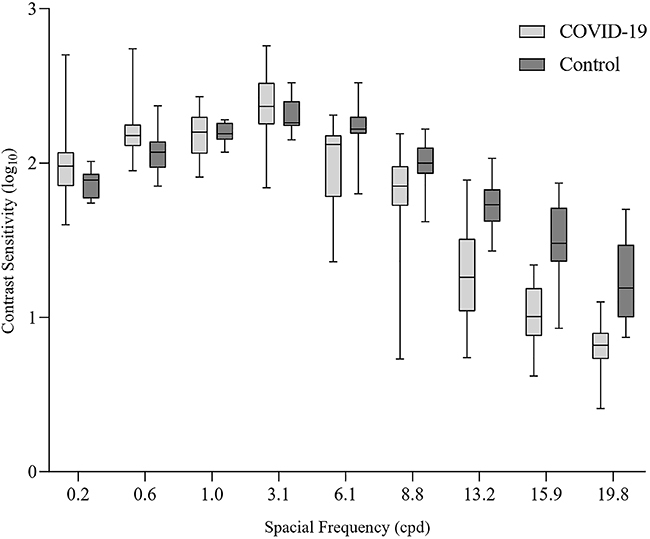
There are significant gaps in understanding the extent of the damage caused by COVID-19, with few publications examining its link to contrast sensitivity function (CSF). The aim of the present study was to evaluate CSF at low, medium, and high spatial frequencies in individuals with and without a history of COVID-19. Thirty adults, both male and female, aged between 18 and 49 years, participated in the study, 15 with a history of COVID-19 and 15 without. CSF was measured using Metropsis software (version 11) and vertical sine-wave gratings with spatial frequencies ranging from 0.2 to 19.8 cycles per degree (cpd). The results indicated COVID-19-related changes in CSF at spatial frequencies of 6.1 (U=36.00; P=0.003; r=-0.55), 13.2 (U=29.00; P=0.001; r=-0.61), 15.9 (U=17.00; P=0.001; r=-0.70), and 19.8 cpd (U=13.00; P=0.001; r=-0.73). The observed decrease in CSF within specific spatial frequency bands suggested that the visual system of individuals exposed to COVID-19 required higher contrast levels to detect high spatial frequencies. This psychophysical finding indicated that COVID-19 altered the functioning of the visual system and likely affected the neural mechanisms responsible for processing high spatial frequencies.
Figures


References
-
- Hu K, Patel J, Swiston C, Patel BC. StatPearls [Internet] Treasure Island (FL): StatPearls Publishing; 2025 Jan.2024 May 6. Ophthalmic manifestations of coronavirus (COVID-19) - PubMed
MeSH terms
LinkOut - more resources
Full Text Sources
Medical
