How marine cloud brightening could also affect stratospheric ozone
- PMID: 40367162
- PMCID: PMC12077500
- DOI: 10.1126/sciadv.adu4038
How marine cloud brightening could also affect stratospheric ozone
Abstract
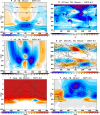
Stratospheric ozone plays a crucial role in life and ecosystems on Earth, with a vast amount of research focused on the effects of human activities on ozone. Yet, impacts of tropospheric climate intervention methods like marine cloud brightening (MCB) have not previously been considered to reach the stratosphere. In this study, we demonstrate that MCB can also have a significant impact on both stratospheric and tropospheric ozone, and discuss the processes via which such an influence could occur. Our results demonstrate the inherent coupling between the troposphere and the stratosphere and underscore the need to assess not just the potential surface climate impacts of MCB, or any other climate intervention, but also their holistic interaction with the whole Earth system, including the middle atmosphere.
Figures


References
-
- Farman J., Gardiner B., Shanklin J., Large losses of total ozone in Antarctica reveal seasonal ClOx/NOx interaction. Nature 315, 207–210 (1985).
-
- World Meteorological Organization (WMO), Scientific Assessment of Ozone Depletion: 2022 (GAW Report No. 278, WMO, 2022), 509 pp.
-
- Butler A. H., Daniel J. S., Portmann R. W., Ravishankara A. R., Young P. J., Fahey D. W., Rosenlof K. H., Diverse policy implications for future ozone and surface UV in a changing climate. Env. Res. Lett. 11, 064017 (2016).
-
- Dhomse S. S., Kinnison D., Chipperfield M. P., Salawitch R. J., Cionni I., Hegglin M. I., Luke Abraham N., Akiyoshi H., Archibald A. T., Bednarz E. M., Bekki S., Braesicke P., Butchart N., Dameris M., Deushi M., Frith S., Hardiman S. C., Hassler B., Horowitz L. W., Hu R.-M., Jöckel P., Josse B., Kirner O., Kremser S., Langematz U., Lewis J., Marchand M., Lin M., Mancini E., Marécal V., Michou M., Morgenstern O., O’Connor F. M., Oman L., Pitari G., Plummer D. A., Pyle J. A., Revell L. E., Rozanov E., Schofield R., Stenke A., Stone K., Sudo K., Tilmes S., Visioni D., Yamashita Y., Zeng G., Estimates of ozone return dates from Chemistry-Climate Model Initiative simulations. Atmos. Chem. Phys. 18, 8409–8438 (2018).
-
- Keeble J., Hassler B., Banerjee A., Checa-Garcia R., Chiodo G., Davis S., Eyring V., Griffiths P. T., Morgenstern O., Nowack P., Zeng G., Zhang J., Bodeker G., Burrows S., Cameron-Smith P., Cugnet D., Danek C., Deushi M., Horowitz L. W., Kubin A., Li L., Lohmann G., Michou M., Mills M. J., Nabat P., Olivié D., Park S., Seland Ø., Stoll J., Wieners K.-H., Wu T., Evaluating stratospheric ozone and water vapour changes in CMIP6 models from 1850 to 2100. Atmos. Chem. Phys. 21, 5015–5061 (2021).
LinkOut - more resources
Full Text Sources

