. 2025 May 16;11(20):eadq3858.
doi: 10.1126/sciadv.adq3858. Epub 2025 May 14.

Phosphorylation by Aurora kinase A facilitates cortical-cytoplasmic dynamics of Par-3 in asymmetric division of radial glia progenitors

Affiliations

Phosphorylation by Aurora kinase A facilitates cortical-cytoplasmic dynamics of Par-3 in asymmetric division of radial glia progenitors

Jason Q Garcia et al. Sci Adv. .

Abstract

During asymmetric cell division (ACD) of radial glia progenitors (RGPs), the cortical polarity regulator Par-3 is detected in the cytoplasm colocalizing with dynein and Notch ligand DeltaD (Dld). What drives Par-3 to the cytoplasm and its impact on RGP ACD remain unknown. Here, we visualize cytoplasmic Par-3 using in vivo time-lapse imaging and find that Ser954 of zebrafish Par-3 is phosphorylated by Aurora kinase A (AurkA) in vitro. Expression of the nonphosphorylated mutant Par-3S954A dominant negatively affects embryonic development, reduces cytoplasmic Par-3, and disrupts the anteroposterior asymmetry of cortical Par-3 and Dld endosomes and, in turn, daughter cell fate. AurkA in mitotic RGPs shows dynamic pericentrosomal distribution that transiently colocalizes with cortical Par-3 preferentially on the posterior side. AurkA is both necessary and sufficient to increase cytoplasmic while decreasing cortical Par-3, disrupts Par-3 cortical asymmetry, and perturbs polarized Dld endosome dynamics. These findings suggest that AurkA regulates Par-3 cortical-cytoplasmic dynamics that is critical for ACD and daughter cell fate.


Figures

Fig. 1.
Fig. 1.. In vivo time-lapse imaging of cytoplasmic Par-3 in mitotic RGPs.
(A) Schematic of RGPs undergoing ACD in the developing zebrafish forebrain. While there is heterogeneity during ACD of RGPs, there is a preferential distribution of cortical Par-3 to the posterior daughter cell. (B) Experimental schematic. Embryos are injected with mRNAs (~200 pg) at the 16/32-cell stage to achieve sparse labeling, followed by Dld antibody uptake at 20 hpf and confocal imaging at 24 hpf. The membrane is marked with Tg[ef1a-MyrTdTomato] embryos (pseudocolored in blue), and DNA is marked by H2B-RFP (pseudocolored in blue) and Par-3-GFP (green). The time-lapse sequence of all images shown is the maximal intensity projection (MIP) of three confocal z-stacks (1-μm z-step). The time of −3 min denotes the metaphase. The time interval between each volume of z-stacks is 20 s, and the total acquisition time is 30 min. (C) Dynamics of internalized Dld and Par-3-GFP in mitotic RGPs. Insets visualize cytoplasmic Par-3 and Dld colocalization during live imaging in RGPs. (D) Dynamics of Par-3-GFP (GFP only by the heatmap) in mitotic RGPs. (E) One- to four-cell stage Tg[ef1a-MyrTdTomato] embryos (pseudocolored in blue) were injected with 4 ng of par-3 MO and 400 pg of Par-3-GFP, followed by the Dld antibody uptake assay and live confocal imaging. Time-lapse sequence of images showing the dynamics of internalized Dld and Par-3-GFP in mitotic RGPs. The time of 3 min denotes the telophase. The time interval between each volume of z-stacks is 30 s, and the total acquisition time is 30 min. All images shown are the MIP of three confocal z-stacks (1-μm z-step). (F) Dynamics of Par-3-GFP (GFP only by the heatmap) in mitotic RGPs. Ap, apical; A, anterior; B, basal; P, posterior; Vent., ventricle. For detailed statistics, see table S1.
Fig. 2.
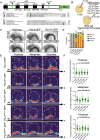
Fig. 2.. Expression of Par-3S954A dominantly interferes with embryonic brain development and cytoplasmic Par-3 localization in RGPs.
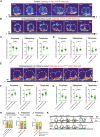
(A) Par-3 consists of three conserved regions (CRs), the oligomerization domain (CR1), the three PDZ domains (CR2), and the aPKC binding domain (CR3). The predicted AurkA phosphorylation sites are located at Ser227 and Ser954 (green), which are conserved across vertebrates. (B) Experimental schematic of mRNA injection into one-cell or 16/32-cell stage zebrafish embryos. (C) Images of embryonic brain morphology at ~28 hpf. Images were taken at 200× on the Zeiss compound microscope. (D) Quantification. Phenotyping rubrics are described in fig. S2. (E) Time-lapse sequence of images showing Par-3 and Par-3 phospho mutants (GFP only in the heatmap) in mitotic RGPs at the prophase, metaphase, and telophase. (F) Quantification. Relative cytoplasmic Par-3 expression was measured at the prophase, metaphase, and telophase using Fiji. One-way ANOVA test with a post hoc comparison to control (Par-3-GFP). *P < 0.05, **P < 0.01, ***P < 0.001, and ****P < 0.0001; ns, not significant. For detailed statistics, see table S1. See table S2 for the representative image signal values compared to the median signal values.
Fig. 3.
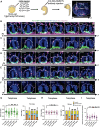
Fig. 3.. Par-3S954A displays reduced posterior cortical asymmetry and dominantly interferes with polarized Dld endosome dynamics in mitotic RGPs.
(A) Experimental schematic. (B to F) Time-lapse sequence of images showing the dynamics of internalized Dld and Par-3(SA, SD, S227A, or S954A)-GFP in mitotic RGPs. The time of 3 min denotes the telophase when asymmetry indices are calculated. The time interval between each volume of z-stacks is 20 s, and the total acquisition time is 30 min. All images shown are MIP of three confocal z-stacks (1-μm z-step). (B) Par-3-GFP: Both internalized Dld and Par-3 are asymmetrically segregated to the posterior daughter shortly after division. (C) Par-3SA-GFP: disrupted internalized Dld and Par-3 asymmetry shortly after division compared to Par3-GFP. (D) Par-3SD-GFP: comparable to Par-3-GFP. (E) Par-3S227A-GFP: comparable to Par-3-GFP. (F) Par-3S954A-GFP: similar to Par-3SA-GFP. (G to I) Quantification. Scatter plot showing asymmetry indices in telophase RGPs. (G) Asymmetry indices of different forms of Par-3-GFP. The dotted lines indicate the threshold of |0.2| for calling asymmetry. (H) Asymmetry indices of internalized Dld (right) in RGPs expressing different forms of Par-3. (I) Telophase RGPs: The relative Dld expression graph reveals a decrease in Dld expression in Par-3SA-GFP and Par-3S954A-GFP compared to control Par-3-GFP. *P < 0.05, **P < 0.01, ***P < 0.001, and ****P < 0.0001; ns, not significant. For detailed statistics, see table S1. See table S2 for the representative image signal values compared to the median signal values.
Fig. 4.
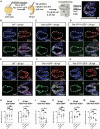
Fig. 4.. Par-3S954A dominantly interferes with progenitor cell fate during active neurogenesis.
(A) Experimental schematic: one-cell injection of mRNA (200 pg) of Par-3-GFP and Par-3S954A-GFP into WT embryos. Embryos were injected with 50 μM EDU at 18 hpf into the yolk sac, followed by fixation, cryosectioning, and confocal microscopy at 24 and 36 hpf. (B to G) WT, Par-3-GFP, and Par-3S954A-GFP 24-hpf [(B) to (D)] and 36-hpf [(E) to (G)] cryosectioned images as single z-stack projection (1 μm) stained with 4′,6-diamidino-2-phenylindole (DAPI), anti-HuC, and anti-EDU. The dash line highlights the forebrain region of interest. (H to M) Quantification. (H) 24-hpf EDU+/DAPI comparing WT, Par-3-GFP, and Par-3-S954A-GFP. (I) 24-hpf EDU+HuC/EDU+ comparing WT, Par-3-GFP, and Par-3-S954A-GFP. (J) 24-hpf EDU+HuC+/EDU+ comparing WT, Par-3-GFP, and Par-3-S954A-GFP. (K) 36-hpf EDU+/DAPI comparing WT, Par-3-GFP, and Par-3-S954A-GFP; P > 0.1229, ns; WT versus Par-3-GFP. (L) 36-hpf EDU+HuC/EDU+ comparing WT, Par-3-GFP, and Par-3-S954A-GFP. (M) 36-hpf EDU+HuC+/EDU+ comparing WT, Par-3-GFP, and Par-3-S954A-GFP. *P < 0.05, **P < 0.01, ***P < 0.001, and ****P < 0.0001; ns, not significant. For detailed statistics, see table S1. See table S2 for the representative image signal values compared to the median signal values.
Fig. 5.
Fig. 5.. AurkA directly phosphorylates Par-3 at Ser954.
(A) Experimental schematic: in vitro–translated Par-3-GFP or Par-3(SA, S954A, SD, or S227A)-GFP was immunoprecipitated with GFP-Trap agarose beads and mixed with 250 nmol of AurkA and [32P]-ATP. Samples were analyzed by SDS-PAGE and autoradiography. hr, hour. (B) Radiolabeled [35S]. Samples were removed and processed by SDS-PAGE/autoradiography. (C) Unlabeled Par-3-GFP immunoprecipitants were incubated with AurkA and [32P]-ATP for 5 min, and reaction products were analyzed by SDS-PAGE and autoradiography. Par-3, 150 kDa. *AurkA autophosphorylation, 50 kDa. (D) Quantification of phosphorylation, normalized to the amount of Par-3 protein. *P < 0.05, **P < 0.01, ***P < 0.001, and ****P < 0.0001; ns, not significant. For detailed statistics, see table S1.
Fig. 6.
Fig. 6.. In vivo time-lapse imaging reveals AurkA dynamics and transient colocalization with Par-3 in mitotic RGPs.
(A) Experimental schematic: mRNA microinjections into four-cell Tg[b-actin2:H2B-HaloTag] embryos to achieve sparse labeling. Subsequently, embryos were incubated with Halo Tag ligand-Janelia Flour 646 for 2 hours before live imaging. Twenty-four– to 30-hpf embryos are then mounted on a petri dish with a glass cover for live confocal imaging. Confocal image of a 28-hpf zebrafish forebrain (dorsal view) under a 40× objective. The time interval between each volume of z-stacks is 20 s, and the total acquisition time is 30 min. All images shown are the maximum MIP of three confocal z-stacks (1-μm z-step). (B to D) In vivo time-lapse imaging of Par-3-GFP and mCherry-AurkA in mitotic RGPs. Arrows indicate AurkA dynamic movements. Par-3-GFP is asymmetrically segregated to the posterior daughter shortly after division, and there is AurkA colocalization toward the posterior side of the cell. (E) Quantification. The bar graph illustrates different patterns of Par-3-AurkA colocalization, while Par-3 undergoes asymmetric distribution in RGPs. *P < 0.05, **P < 0.01, ***P < 0.001, and ****P < 0.0001; ns, not significant. For detailed statistics, see table S1.
Fig. 7.
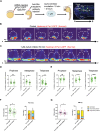
Fig. 7.. Inhibition of AurkA reduces cytoplasmic Par-3 and disrupts cortical Par-3 and Dld asymmetry.
(A) Experimental schematic. Embryos are injected with mRNA (~200 pg) at the 16/32-cell stage to achieve sparse labeling, followed by Dld antibody uptake at 20 hpf and treatment with 1 μM AurkA inhibitor (MK-5108) for 10 min to 2 hours, and the 24- to 30-hpf zebrafish forebrain region is imaged. A zoomed-in confocal image of a 28-hpf zebrafish forebrain (dorsal view) under a 40× objective. DNA is marked by H2B-RFP (pseudocolored in blue), Par-3-GFP (green), and internalized Dld (magenta). (B and C) Time-lapse sequence of images showing the dynamics of internalized Dld and Par-3-GFP in mitotic RGPs. The time of 3 min denotes the telophase when asymmetry indices are calculated. The time interval between each volume of z-stacks is 20 s, and the total acquisition time is 30 min. All images shown are MIP of three confocal z-stacks (1-μm z-step). (B) Control condition: Par-3-GFP time-lapse image showing the dynamics of internalized Dld and Par-3-GFP in mitotic RGPs. (C) Condition: time-lapse sequence of images of 1 μM AurkA Inhibitor for 50 min in mitotic RGPs. Par-3 and Dld asymmetry was disrupted. (D to G) Unpaired t test compared to control. (D) Quantification. Percent relative cytoplasmic Par-3 expression was measured at the prophase, metaphase, and telophase using Fiji. (E) Quantification. Percent relative cortical Par-3 expression was measured at the prophase, metaphase, and telophase using Fiji. (F) Asymmetry indices of Par-3-GFP. The dotted lines indicate the threshold of |0.2| for calling asymmetry. (G) Asymmetry indices of internalized Dld (right) in RGPs expressing different forms of Par-3. *P < 0.05, **P < 0.01, ***P < 0.001, and ****P < 0.0001; ns, not significant. For detailed statistics, see table S1. See table S2 for the representative image signal values compared to the median signal values.
Fig. 8.
Fig. 8.. Overexpression of AurkA results in an increase in cytoplasmic Par-3 and disrupts cortical Par-3 and Dld asymmetry.
(A) Time-lapse sequence of images showing Par-3-GFP (200 pg) (GFP only in the heatmap) in mitotic RGPs. (B) Overexpression (O.E.) of AurkA + Par-3-GFP (400 and 200 pg, respectively) in mitotic RGPs. (C) Quantification. Apical cortical Par-3 expression was measured during the prophase, metaphase, and telophase in mitotic RGPs. (D) Nonapical Par-3 (cytoplasmic) expression was measured during the prophase, metaphase, and telophase in mitotic RGPs. (E) Time-lapse sequence of images showing overexpression of AurkA + Par-3S954A-GFP (400 and 200 pg, respectively) (GFP only in the heatmap) in mitotic RGPs. (F) Quantification. Apical cortical Par-3 expression was measured during the prophase, metaphase, and telophase in mitotic RGPs. (G) Nonapical Par-3 (cytoplasmic) expression was measured during the prophase, metaphase, and telophase in mitotic RGPs. (H to J) Bar graphs represent Par-3 and Dld RGP divisions. (K) Model. N, neuron; Prog, progenitor; Ap, apical; Ba, basal; A, anterior; P, posterior. *P < 0.05, **P < 0.01, ***P < 0.001, and ****P < 0.0001; ns, not significant. For detailed statistics, see table S1. See table S2 for the representative image signal values compared to the median signal values.

Similar articles

References

    1. Knoblich J. A., Asymmetric cell division: Recent developments and their implications for tumour biology. Nat. Rev. Mol. Cell Biol. 11, 849–860 (2010). - PMC - PubMed
    1. Yong K. J., Yan B., The relevance of symmetric and asymmetric cell divisions to human central nervous system diseases. J. Clin. Neurosci. 18, 458–463 (2011). - PubMed
    1. Li Z., Zhang Y. Y., Zhang H., Yang J., Chen Y., Lu H., Asymmetric cell division and tumor heterogeneity. Front. Cell Dev. Biol. 10, 938685 (2022). - PMC - PubMed
    1. Florian M. C., Geiger H., Concise review: Polarity in stem cells, disease, and aging. Stem Cells 28, 1623–1629 (2010). - PMC - PubMed
    1. Aranda V., Nolan M. E., Muthuswamy S. K., Par complex in cancer: A regulator of normal cell polarity joins the dark side. Oncogene 27, 6878–6887 (2008). - PMC - PubMed