. 2025 May 16;11(20):eadt3618.
doi: 10.1126/sciadv.adt3618. Epub 2025 May 14.

Interleukin-4 modulates type I interferon to augment antitumor immunity

Affiliations

Interleukin-4 modulates type I interferon to augment antitumor immunity

Hannah V Newnes et al. Sci Adv. .

Abstract

Despite advances in immunotherapy, metastatic melanoma remains a considerable therapeutic challenge due to the complexity of the tumor microenvironment. Intratumoral type I interferon (IFN-I) has long been associated with improved clinical outcomes. However, several IFN-I subtypes can also paradoxically promote tumor growth in some contexts. We investigated this further by engineering murine B16 melanoma cells to overexpress various IFN-I subtypes, where a spectrum of outcomes was observed. Characterization of these tumors by RNA sequencing revealed a tumor immune phenotype, where potent IFN-I signaling concomitant with diminished type 2 inflammation failed to confer durable tumor control. T cell-mediated rejection of these tumors was restored by introducing interleukin-4 (IL-4) into the tumor microenvironment, either through ectopic expression or in a preclinical adoptive T cell therapy model. Collectively, our findings highlight the IFN-I/IL-4 axis in promoting antitumor immunity, which could be harnessed to target and stratify solid tumors that are nonresponsive to frontline therapies.


Figures
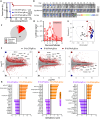
Fig. 1.
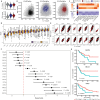
Fig. 1.. Survival and growth kinetics of IFN-I–secreting tumors and underlying bulk transcriptomic signatures.
C57BL/6 mice were inoculated subcutaneously with 5 × 10⁵ B16.GFP.gB.luc, B16.IFNα4.gB.luc, or B16.IFNα9.gB.luc cells. (A) Kaplan-Meier plot representing the percentage of tumor-free mice after tumor challenge. Data were pooled from two to three independent experiments (n = 10 to 30 mice per group). (B) Representative images from IVIS bioluminescence longitudinal imaging of mice inoculated with B16.IFNα9.gB.luc cells. (C) Proportions of mice challenged with B16.IFNα9.gB.luc cells that underwent tumor elimination, equilibrium, or escape events. (D) Luciferase signal (photons/s) over time during tumor elimination. (E) Multidimensional plot of global gene expression data. (F) Smear plots illustrating gene expression differences between each tumor type. (G) Predicted upstream regulators driving transcriptional differences between tumor types. Survival data were analyzed by the log-rank Mantel-Cox test. ****P < 0.0001.
Fig. 2.
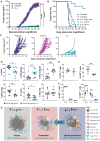
Fig. 2.. Single-cell transcriptomic characterization of B16.IFNα.gB.luc tumors.
(A) Global UMAP plot annotated for immune, stromal, and cancer cell clusters. (B) Representative UMAP plots for B16.GFP.gB.luc, B16.IFNα4.gB.luc, and B16.IFNα9.gB.luc tumors. (C) Gene expression heatmap highlighting the top 5 marker genes per annotated cluster. (D) UMAP plot representing the C06 T/ILC cluster divided into six subclusters. (E) Violin plots of top marker genes associated with each subcluster. (F) Radar plot visualizing the fold change of immune and stromal population frequencies in B16.IFNα4.gB.luc and B16.IFNα9.gB.luc tumors, relative to B16.GFP.gB.luc tumors. (G) Flow cytometry validation of cell populations between the three tumor types. For both RNA-seq and flow cytometry experiments tumors were harvested 8 days post inoculation. Data were pooled from two to three independent experiments (n = 9 to 15 per group). One-way ANOVA with a Tukey post hoc test was used to measure differences in flow cytometry proportions. *P < 0.05; **P < 0.01; ***P < 0.001; ****P < 0.0001.
Fig. 3.
Fig. 3.. IFN-I-high and type 2-high inflammatory signature is positively associated with patient survival in multiple tumor entities.
(A) Violin plot of IL-4 and IFN-I gene expression scores between B16.GFP.gB.luc, B16.IFNα4.gB.luc, and B16.IFNα9.gB.luc tumors. (B) Scatterplots visualizing the distribution of IL-4 and IFN-I gene expression scores (all cells) across each tumor type. (C) Heatmap visualization of IL-4 and IFN-I scores across each major cell compartment between B16.GFP.gB.luc, B16.IFNα4.gB.luc, and B16.IFNα9.gB.luc tumors. (D) Distribution of IFN-I and type 2 inflammation (T2) gene expression scores calculated across 16 different TCGA cancer types. (E) Correlations between IFN-I and T2 scores within cancer types. (F) Forest plots detailing hazard ratios (95% confidence interval) between IFN-IHighT2High and IFN-IHighT2Low patient groups. (G) Kaplan-Meier plots representing overall survival (OS) between IFN-IHighT2High and IFN-IHighT2Low patient groups for SKCM, BLCA, and KIRC cohorts.
Fig. 4.
Fig. 4.. IFNα4 reduced tumor-infiltrating effector CD8+ T cells compared to IFNα9.
(A) C57BL/6 mice were treated with either PBS, 100 μg of anti-CD4, 100 μg of anti-CD8, or 100 μg of both anti-CD4 and anti-CD8 weekly for 6 weeks. One day after the second depletion, mice were challenged with 5 × 10⁵ B16.IFNα9.gB.luc cells. Tumor development was measured over time. (B) Trajectory plot of endogenous CD8+ T cells from all tumors and their corresponding pseudotime state. (C) Pseudotime heatmap illustrating two distinct clusters of genes active at early versus late pseudotime. (D) Violin plots of canonical T cell gene markers associated with stemness/memory and effector function. (E) Distribution of CD8+ T cell states (scRNA-seq) across each tumor type. (F) Flow cytometry validation of CD8+ T cell populations between the three tumor types, effector (TEFF, CD44+), central memory (TCM, CD44+CD62L+), and naïve (Tnaïve, CD62L+). Data were pooled from two independent experiments (n = 10 per group). One-way ANOVA with a Tukey post hoc test was used to measure differences in flow cytometry proportions. *P < 0.05; ****P < 0.0001.
Fig. 5.
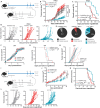
Fig. 5.. Tumor-derived IL-4 restores antitumor control in IFNα4-secreting tumors compared to control.
C57BL/6 mice were inoculated subcutaneously with 5 × 10⁵ B16.IFNα4.gB.luc cells, B16.IFNα4.gB.luc.mCherry cells, or B16.IFNα4.gB.luc.IL4 cells or ratios 10 or 1% B16.IFNα4.gB.luc.IL-4 cells to B16.IFNα4.gB.luc cells. (A) Tumor growth was measured over time; data were pooled from three independent experiments (n = 15 mice per group). Data depict the means ± SEM. Repeated-measures two-way ANOVA (mixed-model) with a Tukey post hoc test was used to measure differences between groups. (B) Percentage of tumor-free mice after tumor challenge. Data were pooled from two to three independent experiments (n = 10 to 15 mice per group) and analyzed by the log-rank Mantel-Cox test comparing to the parental group. (C) Tumor growth measurements from individual mice. (D to F) Eight days after mice were challenged, tumors were harvested and analyzed by flow cytometry. Dots indicate biological samples, error bars show the SEM, and data were pooled from two independent experiments (n = 10 mice per group). (D) Percentage of CD45+ cells, fibroblasts, macrophages, monocytes, granulocytes, B cells, T cells, and NK cells of viable nonmalignant cells. (E) Percentage of CD4+ and CD8+ T cells of total CD3+ T cells, and data were analyzed by unpaired t tests. (F) Proportion of effector (TEFF, CD44+), central memory (TCM, CD44+CD62L+), and naïve (Tnaïve, CD62L+) CD8+ or CD4+ T cells, and data were analyzed by two-way ANOVA with a Šídák post hoc test. *P < 0.05; **P < 0.01; ***P < 0.001; ****P < 0.0001. n.s., not significant. (G) Schematic depicting three tumor phenotypes driven by IFN-I and type II inflammation in the TME. Created in BioRender. S.A.B. (2025); https://BioRender.com/e32i228.
Fig. 6.
Fig. 6.. ACT with T cell–secreting IL-4 reduces tumor burden and improves survival in IFN-I-high tumors.
(A and I) Schematic outlining the experimental timelines. C57BL/6 mice were challenged with 5 × 10⁵ B16.IFNα4.gB.luc (B to E and J to L) or B16.GFP.gB.luc cells (F to H); 7 days later, mice were irradiated (500 rad) and randomized into three treatment groups. Mice either received no further treatment, 107 mCherry+ gBT.I cells, or 107 IL-4+ gBT.I cells. Gy, gray; sc, subcutaneously. [(B), (F), and (J)] Tumor growth was measured over time; each point represents the means ± SEM from three independent experiments (n = 11 to 12 per group). [(C), (G), and (K)] Kaplan-Meier plots representing the overall survival of mice post tumor inoculation. [(D), (H), and (L)] Tumor growth measurements of individual mice. (E) Proportion of nonresponders; mice that were culled due to tumor endpoint, partial responders; mice with tumors less than maximum size (150 mm2) after 120 days or complete responders; mice that had no tumor after 120 days. Data were analyzed by repeated-measures two-way ANOVA (mixed-model) followed by a Tukey post hoc test [(B) and (G)] or log-rank Mantel-Cox test [(C) and (H)]. *P < 0.05; **P < 0.01; ****P < 0.0001.

References

    1. Duan Q., Zhang H., Zheng J., Zhang L., Turning cold into hot: Firing up the tumor microenvironment. Trends Cancer 6, 605–618 (2020). - PubMed
    1. Wang L., Geng H., Liu Y., Liu L., Chen Y., Wu F., Liu Z., Ling S., Wang Y., Zhou L., Hot and cold tumors: Immunological features and the therapeutic strategies. MedComm 4, e343 (2023). - PMC - PubMed
    1. Allison E., Edirimanne S., Matthews J., Fuller S. J., Breast cancer survival outcomes and tumor-associated macrophage markers: A systematic review and meta-analysis. Oncol. Ther. 11, 27–48 (2023). - PMC - PubMed
    1. Armitage J. D., Newnes H. V., McDonnell A., Bosco A., Waithman J., Fine-tuning the tumour microenvironment: Current perspectives on the mechanisms of tumour immunosuppression. Cells 10, 56 (2021). - PMC - PubMed
    1. Klein S., Schulte A., Arolt C., Tolkach Y., Reinhardt H. C., Buettner R., Quaas A., Intratumoral abundance of M2-macrophages is associated with unfavorable prognosis and markers of T-cell exhaustion in small cell lung cancer patients. Mod. Pathol. 36, 100272 (2023). - PubMed

LinkOut - more resources