. 2025 May 14;17(798):eadv4656.
doi: 10.1126/scitranslmed.adv4656. Epub 2025 May 14.

Intra-amniotic antisense oligonucleotide treatment improves phenotypes in preclinical models of spinal muscular atrophy

Affiliations

Intra-amniotic antisense oligonucleotide treatment improves phenotypes in preclinical models of spinal muscular atrophy

Beltran Borges et al. Sci Transl Med. .

Abstract

Neurological disorders with onset before or at birth are a leading cause of morbidity and mortality in infants and children. Prenatal treatment has the potential to reduce or prevent irreversible neuronal loss and facilitate normal neurodevelopment. We hypothesized that antisense oligonucleotides (ASOs) delivered to the amniotic fluid by intra-amniotic (IA) injection could safely distribute to the fetal central nervous system (CNS) and provide therapeutic benefit in the motor neuron disease spinal muscular atrophy (SMA), caused by mutations of the survival of motor neuron 1 gene (SMN1), leading to deficiency of SMN protein. Although the splice-switching ASO nusinersen ameliorates SMA when delivered postnatally, substantial deficits can remain in severely affected infants. Here, IA injection of ASOs into two mouse models of severe SMA increased SMN expression in the CNS. In SMAΔ7 mice, which manifest pathology in utero, prenatal treatment improved motor neuron numbers, motor axon development, motor behavioral tests, and survival when compared with those in mice treated postnatally (between P1 and P3). To assess the feasibility of prenatal treatment in a large-animal model, ASOs were delivered midgestation to fetal sheep by IA or intracranial injection. ASOs delivered by IA injection distributed to the spinal cord at therapeutic concentrations and to multiple peripheral tissues without evidence of substantial toxicity to the fetus or mother. These data demonstrated that IA delivery of ASOs holds potential as a minimally invasive approach for prenatal treatment of SMA and possibly other severe, early-onset neurological disorders.


Conflict of interest statement

Competing Interests: S.K., J.M., and F.B. are employees and stockholders of Ionis. A.R.K. is a co-founder, director, advisor, and stockholder for Stoke Therapeutics, consultant/speaker for Biogen, advisor for Envisagenics, Skyhawk Therapeutics, and Autoimmunity BioSolutions, and consultant for Seed Therapeutics, Crucible Therapeutics, Cajal Neuroscience, and Collage Bio; these arrangements are approved by CSHL in accordance with its conflict-of-interest policies. T.C.M. receives grant funding from Novartis, BioMarin, and Biogen; these arrangements have been reviewed and approved by UCSF in accordance with its conflict-of-interest policies. C.J.S. receives grant support from Roche Ltd., Biogen, and Actio Bio and has served as a paid advisor, consultant, and/or speaker to Biogen, Roche/Genentech, and Novartis; these arrangements have been reviewed and approved by the Johns Hopkins University in accordance with its conflict-of-interest policies. A.R.K is an inventor on patent #US8,361,977, titled ‘Compositions and methods for modulation of SMN2 splicing’ and licensed to Biogen Inc. C.F.B and A.R.K are inventors on patent #US8,980,853, held by Isis Pharmaceuticals and Cold Spring Harbor Laboratory titled ‘Compositions and methods for modulation of SMN2 splicing in a subject’ and licensed to Biogen Inc.

Figures

Figure 1.
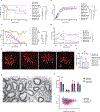
Figure 1.. Prenatal IA administration of ASO leads to widespread SMN expression in ‘Taiwanese’ SMA mice.
A. Schematic showing the mating scheme and timeline of ASO treatment and analyses. Image created with www.biorender.com. B. Probability of survival by group. *p<0.05 by logrank (Mantel-Cox) test. All groups were significantly different (****, p<0.0001) from vehicle controls. C. Radioactive RT-PCR gel showing full-length (FL) vs. truncated (Δ7) SMN mRNA in the indicated tissues of P10 mice. Percent exon 7 inclusion is shown (Incl (%)). D. Quantification of data shown in (C), presented as percent exon 7 inclusion (Incl %) [included/(included + skipped)] in select tissues of indicated experimental groups. *p<0.05, **p<0.01, ***p<0.001, and ****p<0.0001 by one-way ANOVA followed by uncorrected Fisher’s (least significant difference) test. E. Western blot showing SMN and β-tubulin protein abundance in tissues of P10 mice. F. SMN to β-tubulin protein ratios in the indicated tissues, quantified from (E). *p<0.05, **p<0.01, ***p<0.001, and ****p<0.0001 by one-way ANOVA followed by uncorrected Fisher’s LSD test.
Figure 2.
Figure 2.. Prenatal IA administration of ASO increases full length SMN2 mRNA expression in the CNS of SMAΔ7 mice.
A. Schematic showing the mating scheme and timeline of ASO delivery and functional analyses after birth. Image created with www.biorender.com. B. Representative immunohistochemistry images of ASO 449323 (brown, top panel) and immunofluorescence images of ASO 449323–Cy3 (yellow, bottom panel; nuclei are stained blue with DAPI) in the brainstem and cervical, thoracic, and lumbar spinal cord of mice injected at E14.5 (IA injection) and harvested at E18.5. White arrowheads indicate motor neurons. Inset in the upper right corner shows a low-magnification view of each tissue section. Scale bars = top row 250 µm (insets) and 50 µm (magnified view); bottom row 2.5 mm (insets) and 100 µm (magnified view). C and D. ASO concentration (µg/g) as measured by electrochemiluminescent assay (C) and full length SMN2 (FL-SMN2) mRNA expression assessed by RT-qPCR (D) in the brain, liver, lung, kidney, and gut of mice injected with 350 µg ASO at E14.5 and harvested at E18.5. Each symbol represents one fetus. Symbols denote different genotypes. **p<0.01 and ***p<0.001 by two-way ANOVA followed by uncorrected Fisher’s LSD test. E. Full-length SMN2 mRNA expression measured by RT-qPCR in spinal cords and brains of treated and untreated SMAΔ7 mice harvested at P10. **p<0.01 by two-way ANOVA followed by uncorrected Fisher’s LSD test.
Figure 3.
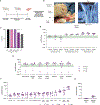
Figure 3.. Prenatal IA administration of ASO improves survival, motor behaviors, and motor neuron pathology in SMAΔ7 mice.
A to D. Plots displaying probability of survival (A), mouse weights (B), time to righting (C) and inverted hang test scores (D) for each experimental group. *p<0.05, **p<0.01, ***p<0.001 and ****p<0.0001 by log rank (Mantel-Cox) test for survival analysis (A), mixed effect analysis (B to D). # in P2 single treated mice (yellow line) indicates 2/13 mice were treated on P1, 11/13 were treated on P2. E. Representative immunofluorescence images of choline acetyltransferase (ChAT, red) expression in L1 spinal cord motor neurons of indicated groups at P14. Scale bar= 50 µm. F. Quantification of ChAT+ motor neurons in the entire L1 spinal cord of indicated experimental groups. **p<0.01 by one-way ANOVA followed by uncorrected Fisher’s LSD test. G. Representative single higher-magnification EM images of L1 ventral roots in prenatally and postnatally treated SMA mice at P14. Scale bar= 2 µm. H. Plot of number of axons of different categories in SMA mice treated with ASO by IA injection prenatally (pink) or by SC injection postnatally on P1+P3 (teal) (n = 5 prenatal, n= 3 postnatal) at P14. *p<0.05 by two-way ANOVA with uncorrected Fisher’s LSD test. I. Scatter plot of L1 ventral root axon g-ratios as a function of axon diameter in prenatally (pink, n = 5) and postnatally (teal, n = 3) SMA-treated mice (1095 axons measured for prenatal, 441 axons measured for postnatal). ****p<0.0001, determined by simple linear regression with slope comparison (F test).
Figure 4.
Figure 4.. Nusinersen achieves therapeutic concentrations in the CNS of fetal lambs when administered by IC injection.
A. Schematic of the experimental design: fetal lambs were injected with nusinersen at E72–77 and harvested at E93-E99. Image created with www.biorender.com B. Representative picture of an ultrasound-guided intracranial (IC) injection into the cisterna magna of a fetal lamb (left), and an ultrasound of a fetal lamb’s cisterna magna (right). C. Plot showing the percentage of fetal lambs in each litter that survived to harvest. Each dot represents the overall survival rate of a single pregnancy. Control (n=3); low dose (0.7 mg, n=2); medium dose (1.5 mg, n=2); high dose (2.1 mg, n=3); sham IC surgery (n=2). D to F. ASO concentrations (µg/g) in different levels of the spinal cord (D), brain (E), and peripheral organs (F) of fetuses after prenatal IC injection of nusinersen. Each dot represents one fetus. The green shaded area represents the estimated therapeutic range (1–10µg ASO/g tissue). G. ASO concentrations (µg/g) in maternal liver and uterus after fetal IC injection of nusinersen. Each dot represents one ewe.
Figure 5.
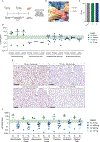
Figure 5.. ASOs penetrate spinal cord tissues of fetal lambs when administered by IA injection.
A. Schematic of the experimental design: fetal lambs were injected with ASO #449323 at E72–80 and harvested at E93-E101. Image created with www.biorender.com. B. Representative picture of IA injection of a fetal lamb. C. Plot showing percentage of fetal lambs in each litter that survived to harvest. Each dot represents the overall survival rate of a single pregnancy. (Control (n=3); IC (n=2); IA (n=7)). D. ASO concentrations (µg/g) in different levels of the spinal cord after prenatal ASO administration. Each dot represents one fetus. Arrows denote animals represented in Fig. 5E. The green shaded area represents the estimated therapeutic range (1–10 µg ASO/g tissue). E. Representative IHC images of ASO (brown) in the cervical spinal cord tissues of indicated experimental groups. Scale bar = 50 µm. F. ASO concentrations (µg/g) in different CNS tissues of indicated experimental groups. Each dot represents one fetus. The green shaded area represents the estimated therapeutic range (1–10 µg ASO/g tissue).
Figure 6.
Figure 6.. Biodistribution of ASO in peripheral tissues after prenatal IA administration.
A. ASO concentrations (µg/g) in different peripheral organs of fetal lambs after prenatal IA administration of different doses of ASO. Each dot represents one fetus. B. Representative IHC images of ASO (brown) in lung, liver, and kidney from fetal lambs in the indicated experimental groups. C. ASO concentrations (µg/g) in maternal liver and uterus after IA ASO administration to the fetus. Each dot represents one ewe.

References

    1. Parrini E, Conti V, Dobyns WB, Guerrini R, Genetic Basis of Brain Malformations. Mol Syndromol 7, 220–233 (2016); published online EpubSep ( 10.1159/000448639). - DOI - PMC - PubMed
    1. Lopez-Rivera JA, Perez-Palma E, Symonds J, Lindy AS, McKnight DA, Leu C, Zuberi S, Brunklaus A, Moller RS, Lal D, A catalogue of new incidence estimates of monogenic neurodevelopmental disorders caused by de novo variants. Brain 143, 1099–1105 (2020); published online EpubApr 1 ( 10.1093/brain/awaa051). - DOI - PMC - PubMed
    1. Devinsky O, Coller J, Ahrens-Nicklas R, Liu XS, Ahituv N, Davidson BL, Bishop KM, Weiss Y, Mingorance A, Gene therapies for neurogenetic disorders. Trends Mol Med, (2025); published online EpubFeb 17 ( 10.1016/j.molmed.2025.01.015). - DOI - PubMed
    1. Collaborators GBDNSD, Global, regional, and national burden of disorders affecting the nervous system, 1990–2021: a systematic analysis for the Global Burden of Disease Study 2021. Lancet Neurol 23, 344–381 (2024); published online EpubApr ( 10.1016/S1474-4422(24)00038-3). - DOI - PMC - PubMed
    1. Herzeg A, Almeida-Porada G, Charo RA, David AL, Gonzalez-Velez J, Gupta N, Lapteva L, Lianoglou B, Peranteau W, Porada C, Sanders SJ, Sparks TN, Stitelman DH, Struble E, Sumner CJ, MacKenzie TC, Prenatal Somatic Cell Gene Therapies: Charting a Path Toward Clinical Applications (Proceedings of the CERSI-FDA Meeting). J Clin Pharmacol 62 Suppl 1, S36–S52 (2022); published online EpubSep ( 10.1002/jcph.2127). - DOI - PMC - PubMed

MeSH terms

Substances

LinkOut - more resources