. 2025 May 14;21(5):e1013092.
doi: 10.1371/journal.ppat.1013092. eCollection 2025 May.

Epstein-Barr virus latent membrane protein 1 subverts IMPDH pathways to drive B-cell oncometabolism

Affiliations

Epstein-Barr virus latent membrane protein 1 subverts IMPDH pathways to drive B-cell oncometabolism

Eric M Burton et al. PLoS Pathog. .

Abstract

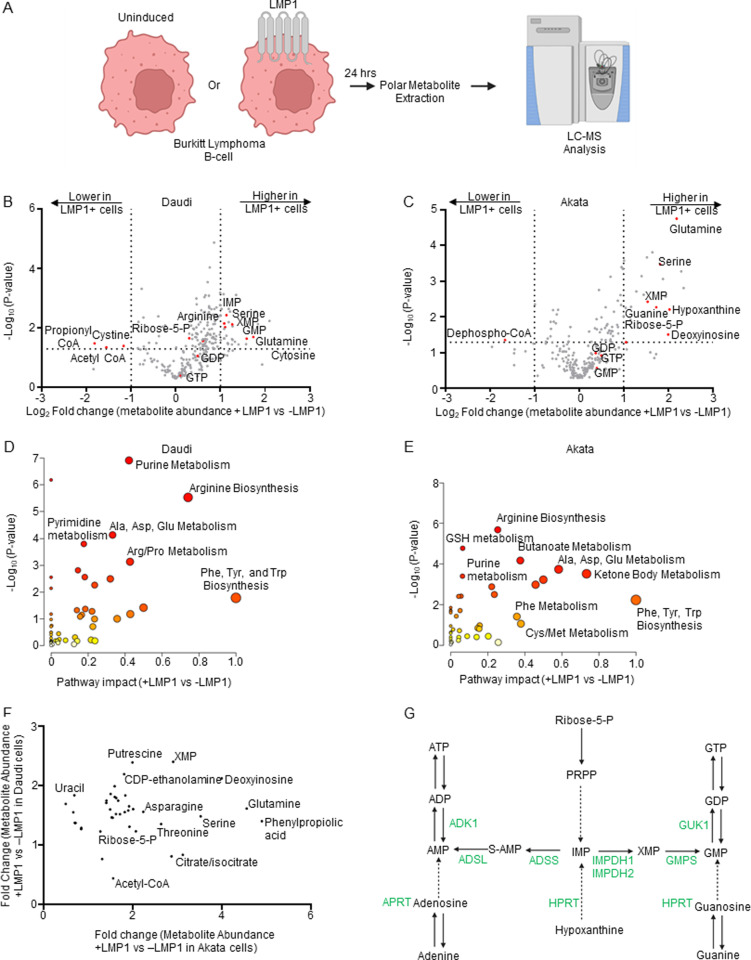
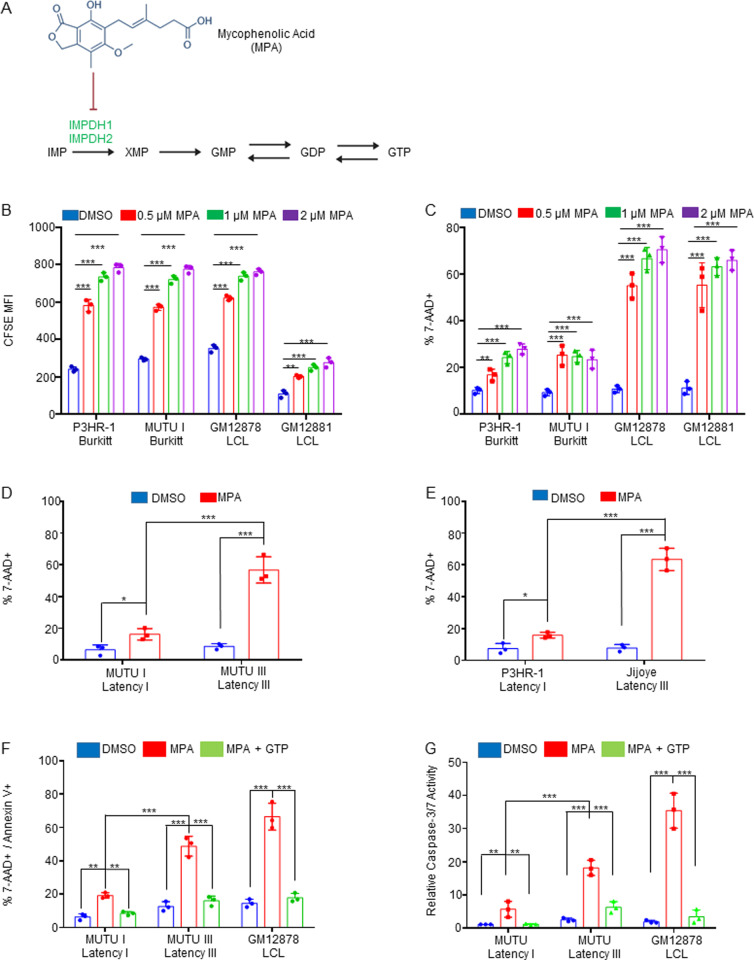
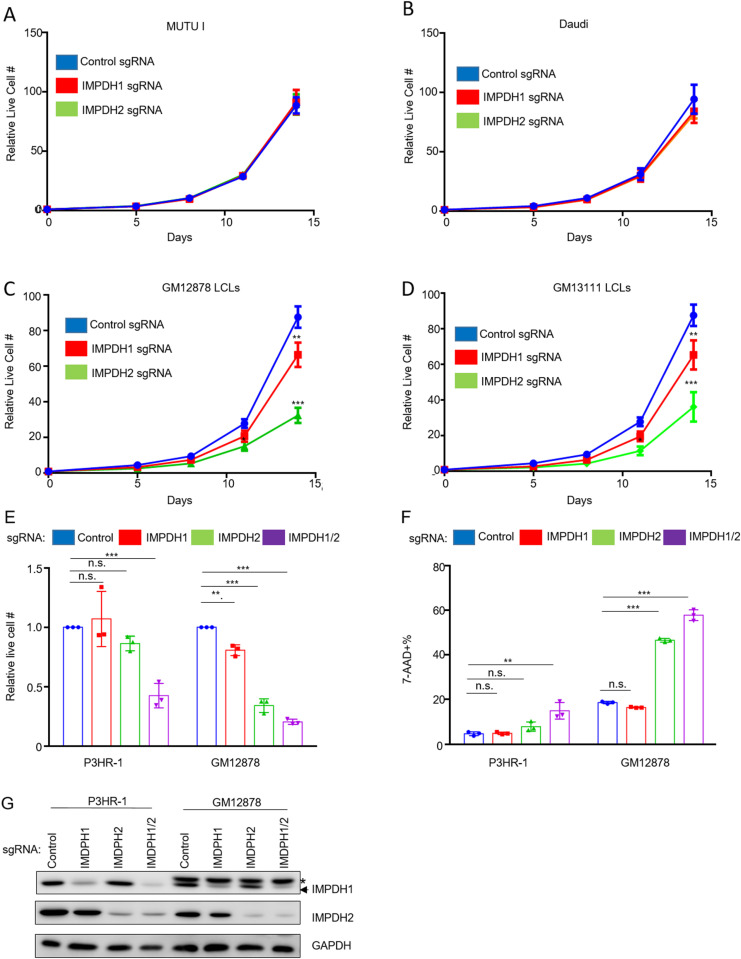
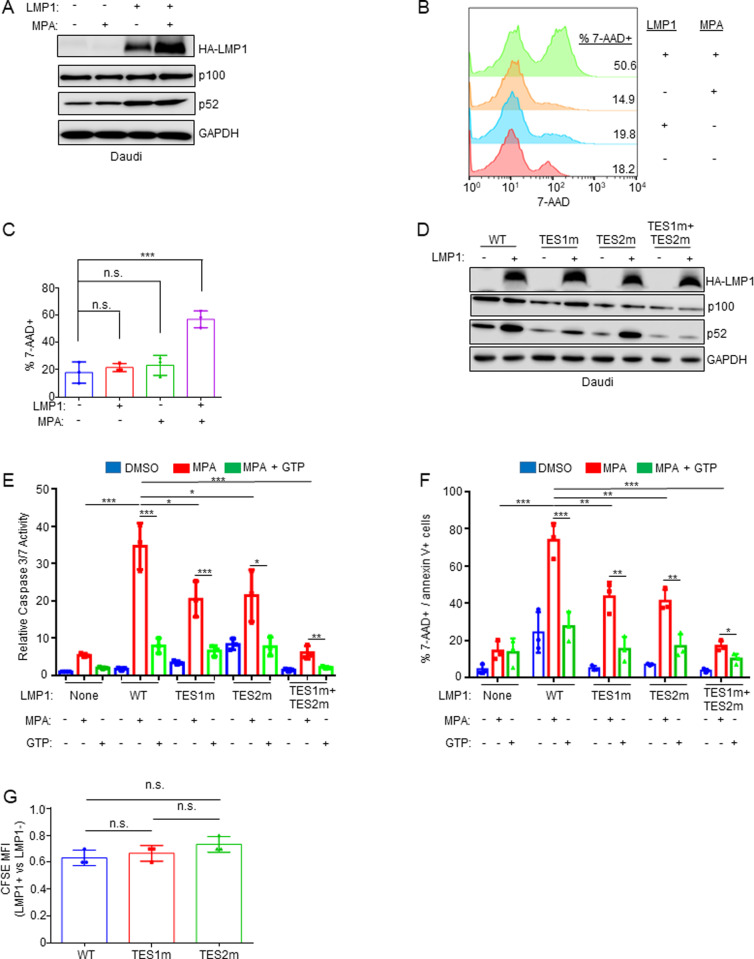
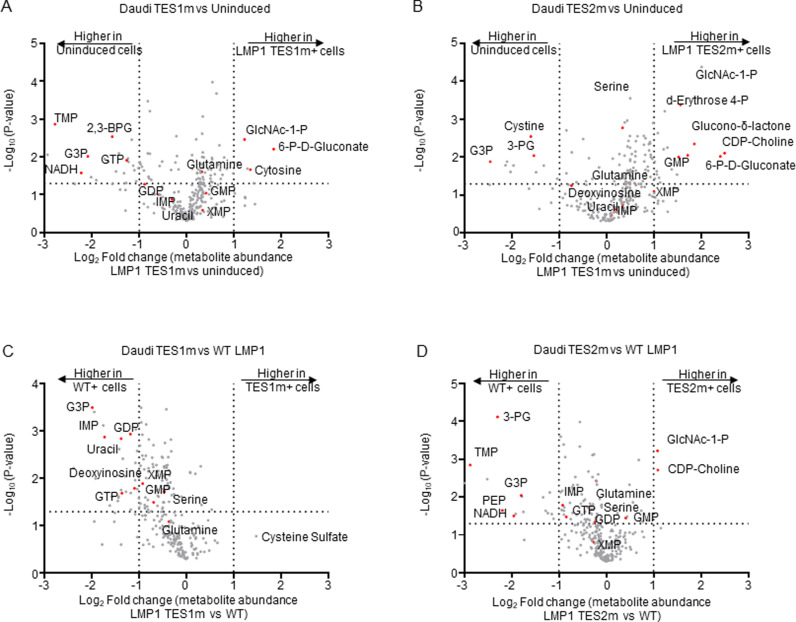
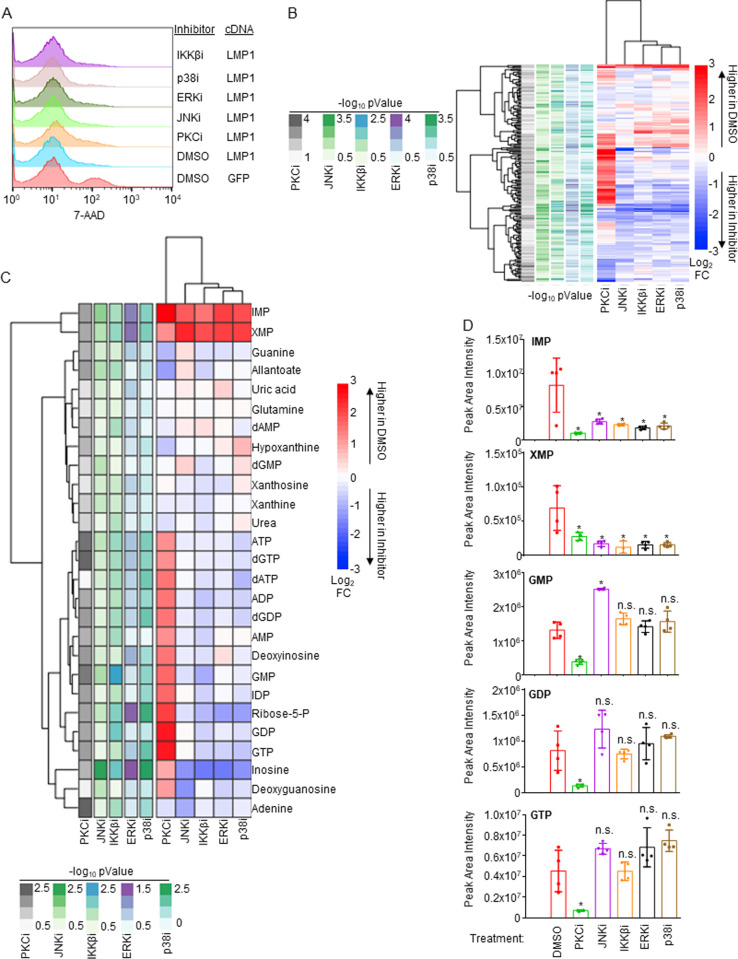
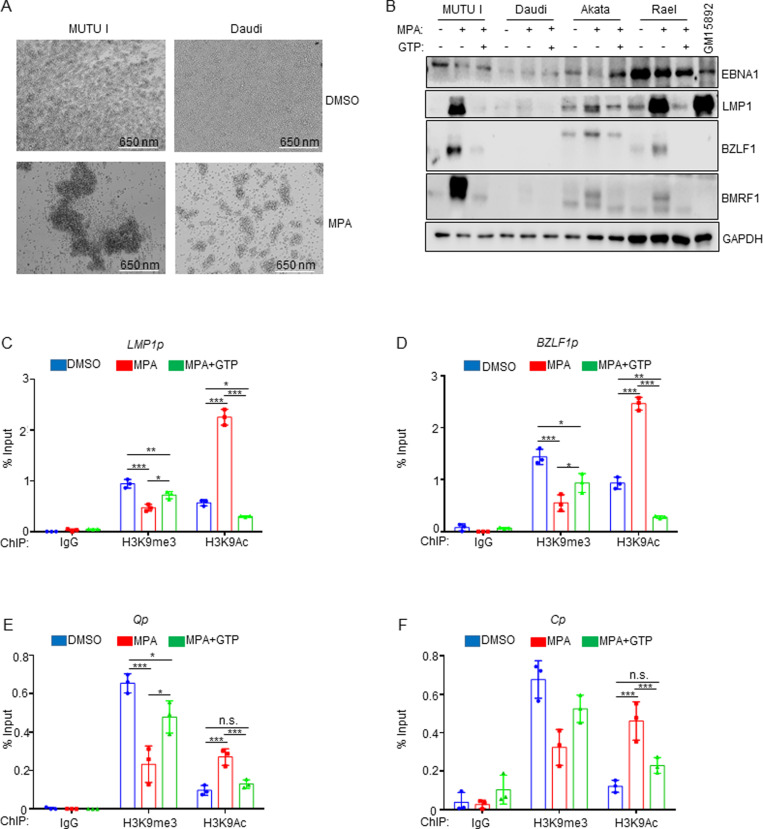
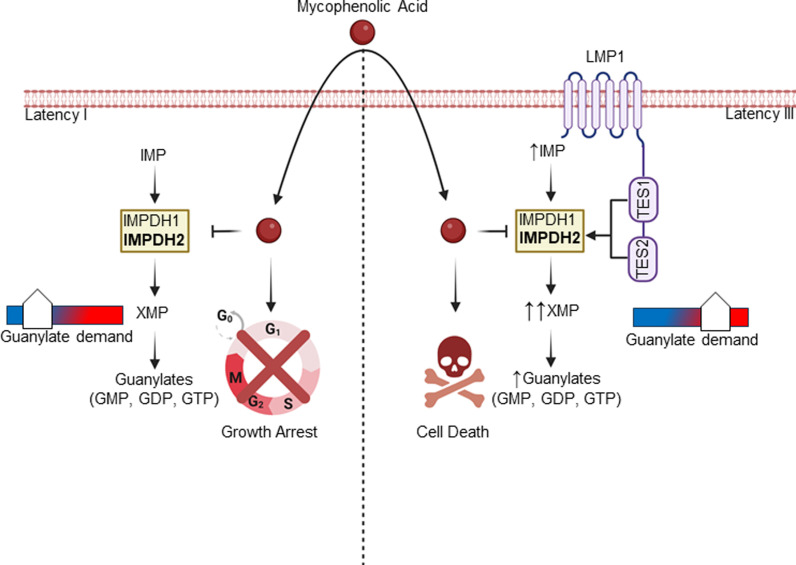
Epstein-Barr virus (EBV) is associated with multiple types of cancers, many of which express the viral oncoprotein Latent Membrane Protein 1 (LMP1). LMP1 contributes to both epithelial and B-cell transformation. Although metabolism reprogramming is a cancer hallmark, much remains to be learned about how LMP1 alters lymphocyte oncometabolism. To gain insights into key B-cell metabolic pathways subverted by LMP1, we performed systematic metabolomic analyses on B cells with conditional LMP1 expression. This approach highlighted that LMP highly induces de novo purine biosynthesis, with xanthosine-5-P (XMP) as one of the most highly LMP1-upregulated metabolites. Consequently, IMPDH inhibition by mycophenolic acid (MPA) triggered death of LMP1-expressing EBV-transformed lymphoblastoid cell lines (LCL), a key model for EBV-driven immunoblastic lymphomas. Whereas MPA instead caused growth arrest of Burkitt lymphoma cells with the EBV latency I program, conditional LMP1 expression triggered their death, and this phenotype was rescuable by guanosine triphosphate (GTP) supplementation, implicating LMP1 as a key driver of B-cell GTP biosynthesis. Although both IMPDH isozymes are expressed in LCLs, only IMPDH2 was critical for LCL survival, whereas both contributed to proliferation of Burkitt cells with the EBV latency I program. Both LMP1 C-terminal cytoplasmic tail domains critical for primary human B-cell transformation were important for XMP production, and each contributed to LMP1-driven Burkitt cell sensitivity to MPA. Metabolomic analyses further highlighted roles of NF-kB, mitogen activated kinase, and protein kinase C downstream of LMP1 in support of XMP abundance. Of these, only protein kinase C activity was important for supporting GTP levels in LMP1 expressing Burkitt cells. MPA also de-repressed EBV lytic antigens, including LMP1 itself in latency I Burkitt cells, highlighting crosstalk between the purine biosynthesis pathway and the EBV epigenome. These results suggest novel oncometabolism-based therapeutic approaches to LMP1-driven lymphomas.


Conflict of interest statement

The authors have declared that no competing interests exist.

Figures

Fig 1
Fig 1. LMP1-mediated B-cell metabolome remodeling.
(A) Metabolomic experiment workflow. Conditional LMP1 Daudi or Akata Burkitt cells were mock induced or induced by doxycycline (250ng/ml) for LMP1 expression for 24h. Polar metabolites were analyzed by targeted metabolomic analysis. (B) Volcano plot analysis of liquid chromatography mass spectrometry (LC-MS) analysis of n = 3 replicates of Daudi cells mock induced or induced for LMP1 expression. Positive fold changes indicate higher metabolite concentrations in LMP1 + vs LMP1- cells. Selected host cell metabolites induced vs. suppressed by LMP1 are indicated. (C) Volcano plot analysis of LC-MS analysis of n = 6 replicates of Akata cells mock induced or induced for LMP1 expression. (D) Metaboanalyst analysis of LMP1 driven Daudi cell metabolic pathway impact from the data presented in (B), using data from significantly changed metabolites in LMP1 + vs LMP1- cells (p value > 0.05). Higher pathway impact values indicates stronger effects of conditional LMP1 expression on the indicated pathway. Purine metabolism was amongst the most highly LMP1 impacted pathways. (E) Metaboanalyst pathway impact analysis of LMP1 + vs LMP1- Akata cells from the data presented in (C). (F) Volcano plot analysis cross-comparing fold change of metabolite abundances in LMP1+ versus LMP1- Akata cells (x-axis) vs Daudi cells (Y-axis). Shown are metabolites whose abundances were LMP1 increased by ≥1.2 fold in both cell models. Selected metabolites are annotated, including xanthosine-5-phosphate, which was highly LMP1-induced under both conditions. (G) Purine metabolism pathways. The de novo pathway uses Ribose-5-phosphate and PRPP to generate inosine monophosphate (IMP), whereas the salvage pathway metabolizes hypoxanthine into IMP. IMP can be converted by IMPDH1/2 to xanthosine monophosphate (XMP) and subsequently to guanosine monophosphate (GMP). Alternatively, IMP can be converted to adenosine monophosphate (AMP). Created in BioRender. Burton, E. (2025) https://BioRender.com/x8l0ikn.
Fig 2
Fig 2. EBV latency III creates dependency on IMPDH activity for prevention of apoptosis.
(A) Schematic diagram of mycophenolic acid (MPA) inhibition of the guanylate biosynthesis pathway enzymes IMPDH1 and IMPDH2. IMP, inosine monophosphate. XMP, xanthosine monophosphate, GMP, guanosine monophosphate. GDP, guanosine diphosphate. GTP, guanosine triphosphate. (B) FACS analysis of dose-dependent MPA effects on proliferation of latency I P3HR-1 and MUTU I cells versus latency III GM12878 and GM12881 LCLs, as judged by CFSE dye-dilution analysis. CFSE-stained cells were incubated with DMSO vehicle vs the indicated MPA concentrations for 96 hours and CFSE mean fluorescence intensity (MFI) was analyzed by FACS. CFSE levels are reduced by half with each mitosis. Shown are mean ± SD CFSE levels from n = 3 independent replicates. (C) FACS analysis of dose-dependent effects of MPA treatment for 48 hours on cell death of latency I P3HR-1 and MUTU I cells versus latency III GM12878 and GM12881 LCLs, as judged by uptake of the vital dye 7-AAD. Shown are mean ± SD percentages of 7-AAD+ (non-viable) cells from n = 3 independent replicates. (D) FACS analysis of DMSO versus MPA effects on viability of isogenic MUTU I versus III cells that differ by EBV latency I versus III programs, respectively. Shown are mean ± SD percentages of 7-AAD+ cells following DMSO versus 1 μM MPA treatment for 48 hours. (E) FACS analysis of DMSO versus MPA effects on P3HR-1 versus Jijoye Burkitt cell viability following DMSO versus 1 μM MPA treatment for 48 hours. Mean ± SD 7-AAD+ cell percentages from n = 3 replicates are shown. (F) FACS analysis of mean ± SD percentages of 7-AAD + /Annexin V+ cells following treatment with DMSO, 1 μM MPA with or without 100 μM GTP rescue for 48 hours. (G) Relative caspase 3/7 activity levels of cells analyzed in panel (F), as judged by Caspase3/7 Glo assay. Mean ± SD values from n = 3 replicates are shown. *, P < 0.05; **, P < 0.05; ***, P < 0.005; ns, nonsignificant using Student’s t-test.
Fig 3
Fig 3. LCLs but not Burkitt cells are dependent on IMPDH2 for growth and survival.
(A) Mean ± SD live cell numbers of Cas9 + MUTU I expressing control, IMPDH1 or IMPDH2 targeting single guide RNAs (sgRNA) from n = 3 replicates. Cells transduced with lentiviruses expressing the indicated sgRNAs were puromycin selected. Cell numbers immediately following puromycin selection (defined as day 0 of the graph) were set to 1. Live cell numbers were quantitated by CellTiter-Glo assay. (B) Mean ± SD live cell numbers of Cas9 + Daudi cells as in (A). (C) Mean ± SD live cell numbers of Cas9 + GM12878 LCLs as in (A). (D) Mean ± SD live cell numbers of Cas9 + GM13111 LCLs as in (A). (E) Mean ± SD live cell numbers of Cas9 + P3HR-1 or GM12878 cells transduced with lentivirus expressing control, IMPDH1, IMPDH2 or IMPDH1 and 2 sgRNAs at 8 days post-puromycin selection. (F) Immunoblot analysis of WCL from Cas9 + P3HR-1 or GM12878 expressing the indicated sgRNA. * = non-specific band present in analysis of GM12878 lysates. Immunoblots are representative of n = 3 independent replicates. (G) Mean ± SD MFI of Cas9 + P3HR-1 or GM12878 cells transduced with lentivirus expressing control, IMPDH1, IMPDH2 or IMPDH1 and 2 sgRNAs at 8 days post-puromycin selection, performed on cells from the same replicates shown in (E).
Fig 4
Fig 4. LMP1 expression sensitizes Burkitt cells to MPA-driven death in a partially GTP dependent manner.
(A) MPA does not impair conditional LMP1 expression or signaling. WCL of Daudi cells induced for LMP1 and/or treated with MPA 1 μM for 24 hours, as indicated. (B) Analysis of LMP1 effects on MPA-driven Burkitt cell death. FACS analysis of 7-AAD uptake by Daudi cells mock induced or induced for LMP1 and then treated with DMSO vs MPA for 96 hours. Shown at right are the % 7-AAD+ cells under each condition. (C) Mean ± SD percentages of 7-AAD cells from n = 3 replicates as in (B). (D) Validation of Daudi conditional wildtype vs mutant LMP1 expression. Immunoblot analysis of WCL of Daudi cells induced for wildtype (WT), TES1m, TES2m or TES1 + TES2m LMP1 for 24 hours. (E) Analysis of TES1 vs TES2 effects on sensitization to MPA-induced Burkitt apoptosis. Relative caspase-3/7 activities in Daudi cells mock induced or induced for WT or the indicated LMP1 mutant for 24 hours and then treated with 1 μM MPA ± 100 μM GTP rescue for 96 hours. Caspase 3/7 levels were measured by Caspase-3/7 Glo assay, and values in mock induced and DMSO treated cells were set to 1. (F) Analysis of TES1 vs TES2 effects on sensitization to MPA-induced Burkitt apoptosis. Mean ± SD percentages of double 7-AAD + /Annexin V+ from n = 3 replicates of Daudi cells treated as in (E). Immunoblots are representative of n = 3 replicates. *P < 0.05, **P < 0.01, ***P < 0.005.
Fig 5
Fig 5. Effects of LMP1 TES1 versus TES2 signaling on Daudi Burkitt metabolome remodeling.
(A) Volcano plot of LC-MS metabolomic analysis of n = 3 replicates of Daudi cells mock induced or doxycycline induced for LMP1 TES1m expression for 24 hours. Metabolites with higher abundance in LMP1 TES1 + cells have positive fold change values, whereas those higher in mock induced cells have negative fold change values. Selected metabolites are highlighted by red circles and annotated. (B) Volcano plot of LC-MS metabolomic analysis of n = 3 replicates of Daudi cells mock induced or doxycycline induced for LMP1 TES2m expression for 24 hours, with selected metabolites highlighted as in (A). (C) Volcano plot of LC-MS metabolomic analysis of n = 3 replicates of Daudi cells doxycycline induced for TES1m vs WT LMP1 expression for 24 hours, with selected metabolites highlighted. Replicates for this cross-comparison were induced side by side, prepared for and analyzed by LC-MS together on the same day to minimize batch effects. (D) Volcano plot of LC-MS metabolomic analysis of n = 3 replicates of Daudi cells doxycycline induced for TES2m vs WT LMP1 expression for 24 hours, with selected metabolites highlighted. Replicates for this cross-comparison were induced side by side, prepared for and analyzed by LC-MS together on the same day to minimize batch effects.
Fig 6
Fig 6. Analyses of LMP1 pathway inhibition effects on Burkitt B cell metabolome remodeling.
(A) FACS analysis of 7-AAD uptake in Daudi cells conditionally induced for control GFP versus LMP1 expression for 24 hours, in the presence of DMSO vehicle or of the indicated small molecule inhibitors: PKC inhibitor (PKCi) staurosporine (100nM), JNK inhibitor (JNKi) SP600125 (10 μM), ERK inhibitor (ERKi) SCH772984 (10 μM), p38 inhibitor (p38i) adezmapimod (10 μM) or IKKβ inhibitor (IKKβi) IKK-2 VII (1 μM). None of the inhibitors increased cell death at the early 24 hour timepoint in LMP1 expressing cells. (B) LC/MS metabolomic analyses was performed using n = 4 independent replicates on Daudi cells treated as in (A). Shown is a heatmap depicting significantly changed metabolite abundances in Daudi cells treated with the indicated inhibitor versus in DMSO treated controls, using a p < 0.05 cutoff. –log10 p-Value and log2 (metabolite fold changes) scales are shown to the left and right of the heatmap, respectively. (C) Heatmap of significantly changed purine metabolism pathway metabolites (using a p < 0.05 cutoff). –log10 p-Value and log2 (fold change metabolite) scales are shown below and to the right of the heatmap, respectively. (D) Bar graphs showing LC-MS mean ± SD of peak area intensities from n = 4 replicates of the indicated guanylate biosynthesis pathway metabolites. Statistical significance of changes between inhibitor treated vs DMSO treated samples is indicated. * = p < 0.05, n.s. = not significant.
Fig 7
Fig 7. MPA derepresses lytic gene expression including LMP1 in latency I Burkitt cells in a GTP dependent manner.
(A) Analysis of MPA effects on latency I Burkitt cell homotypic adhesion (cell clumping), a phenotype that typically correlates with LMP1 expression. Representative brightfield microscopy images of MUTU I and Daudi cells treated with DMSO or the indicated MPA concentration for 72 hours indicating MPA-induced homotypic adhesion. (B) Analysis of MPA effects on Burkitt LMP1, EBNA1, immediate early BZLF1 and early lytic BMRF1 expression. Immunoblot analysis of WCL from the indicated Burkitt cells mock treated or treated with 1 μM MPA ± 100 μM GTP for 24 hours. Shown in the rightmost lane are WCL from latency III GM15892 LCLs for cross comparison. MPA effects on LMP1 and on lytic gene expression were largely reversed by GTP supplementation. Blots are representative of n = 3 replicates. (C) Mean ± SD percentage of input values from MUTU I Burkitt cell chromatin immunoprecipitation (ChIP) with qPCR analysis, using the indicated control IgG, anti-H3K9me3 or anti-H3K9Ac antibodies, as indicated and with primers specific for the LMP1 promoter region (LMP1p). (D) Mean ± SD percentage of input ChIP-qPCR values as in (C) using primers specific for the immediate early BZLF1 promoter (BZLF1p) region. (E) Mean ± SD percentage of input ChIP-qPCR values as in (C) using primers specific for the latency I Q promoter (Qp) region. (F) Mean ± SD percentage of input ChIP-qPCR values as in (C) using primers specific for the latency III C promoter (Cp) region. *, P < 0.05; **P < 0.01, ***P < 0.005, ns = non-significant.
Fig 8
Fig 8. Schematic model of IMPDH1/2 inhibition effects on LMP1-negative latency I versus LMP1-positive latency III B-cell growth and survival.
In Latency I, IMPDH1 and 2 each contribute to production of XMP and downstream guanylates to support demand. IMPDH1/2 inhibition by MPA triggers Burkitt growth arrest and de-represses EBV lytic antigens. In Latency III, LMP1 activated IMPDH2 predominantly supports XMP production and guanylate synthesis, sensitizing LMP1-expressing cells to MPA-driven killing. Created in BioRender. Burton, E. (2025) https://BioRender.com/76p9mp7.

Update of

Similar articles

References

    1. Wen KW, Wang L, Menke JR, Damania B. Cancers associated with human gammaherpesviruses. FEBS J. 2022;289(24):7631–69. doi: 10.1111/febs.16206 - DOI - PMC - PubMed
    1. Münz C. Latency and lytic replication in Epstein-Barr virus-associated oncogenesis. Nat Rev Microbiol. 2019;17(11):691–700. doi: 10.1038/s41579-019-0249-7 - DOI - PubMed
    1. Pei Y, Lewis AE, Robertson ES. Current Progress in EBV-Associated B-Cell Lymphomas. Adv Exp Med Biol. 2017;1018:57–74. doi: 10.1007/978-981-10-5765-6_5 - DOI - PMC - PubMed
    1. Young LS, Yap LF, Murray PG. Epstein-Barr virus: more than 50 years old and still providing surprises. Nat Rev Cancer. 2016;16(12):789–802. doi: 10.1038/nrc.2016.92 - DOI - PubMed
    1. Saha A, Robertson ES. Mechanisms of B-Cell Oncogenesis Induced by Epstein-Barr Virus. J Virol. 2019;93(13):e00238-19. doi: 10.1128/JVI.00238-19 - DOI - PMC - PubMed

MeSH terms

Substances

LinkOut - more resources