. 2025 May 14;21(5):e1013184.
doi: 10.1371/journal.ppat.1013184. eCollection 2025 May.

Virus and cell specific HMGB1 secretion and subepithelial infiltrate formation in adenovirus keratitis

Affiliations

Virus and cell specific HMGB1 secretion and subepithelial infiltrate formation in adenovirus keratitis

Amrita Saha et al. PLoS Pathog. .

Abstract

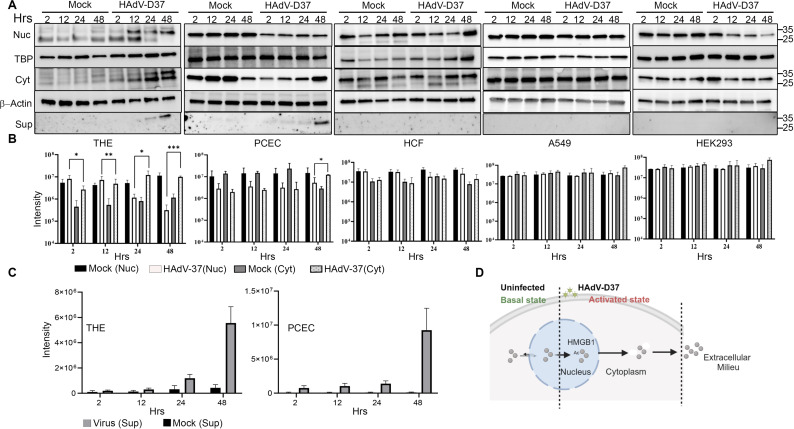
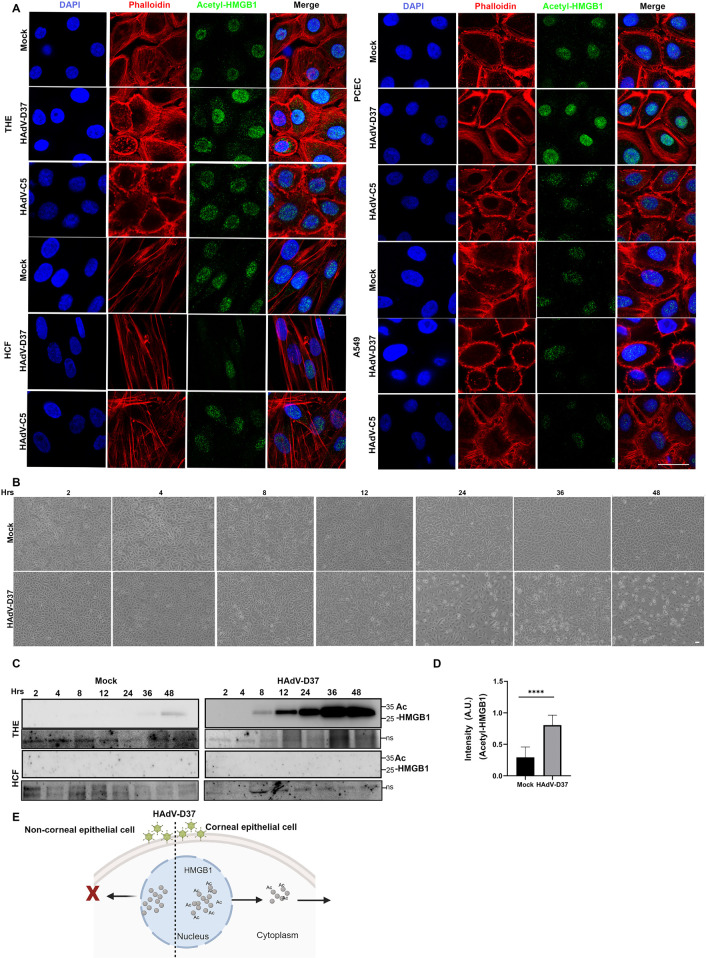
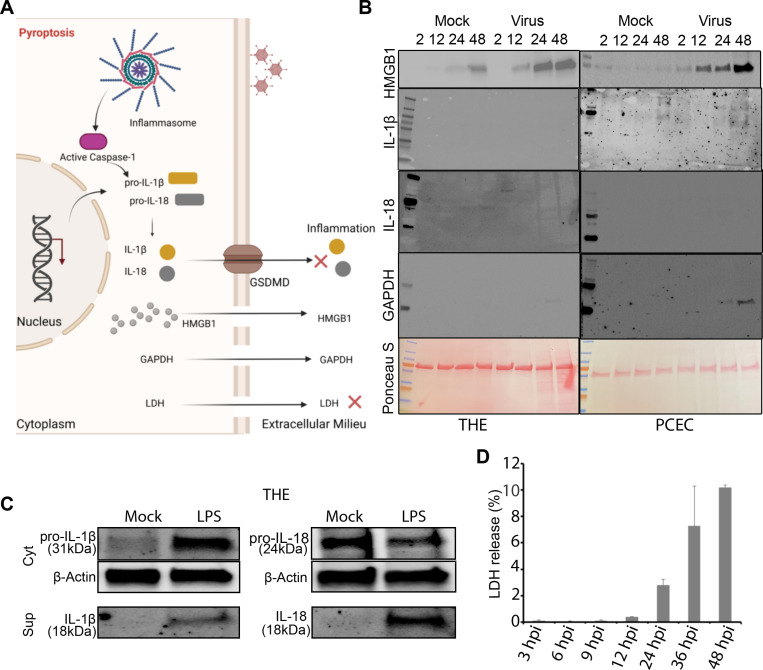
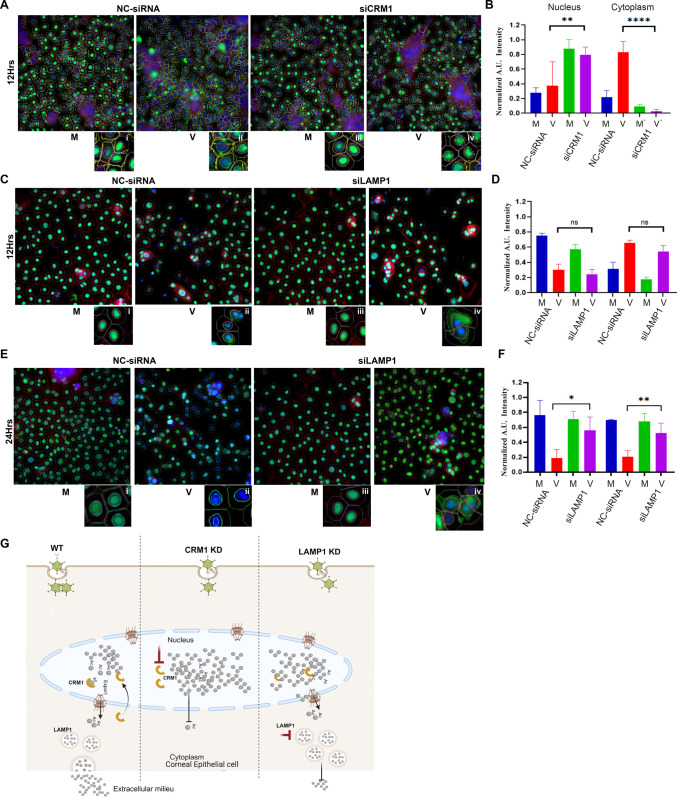
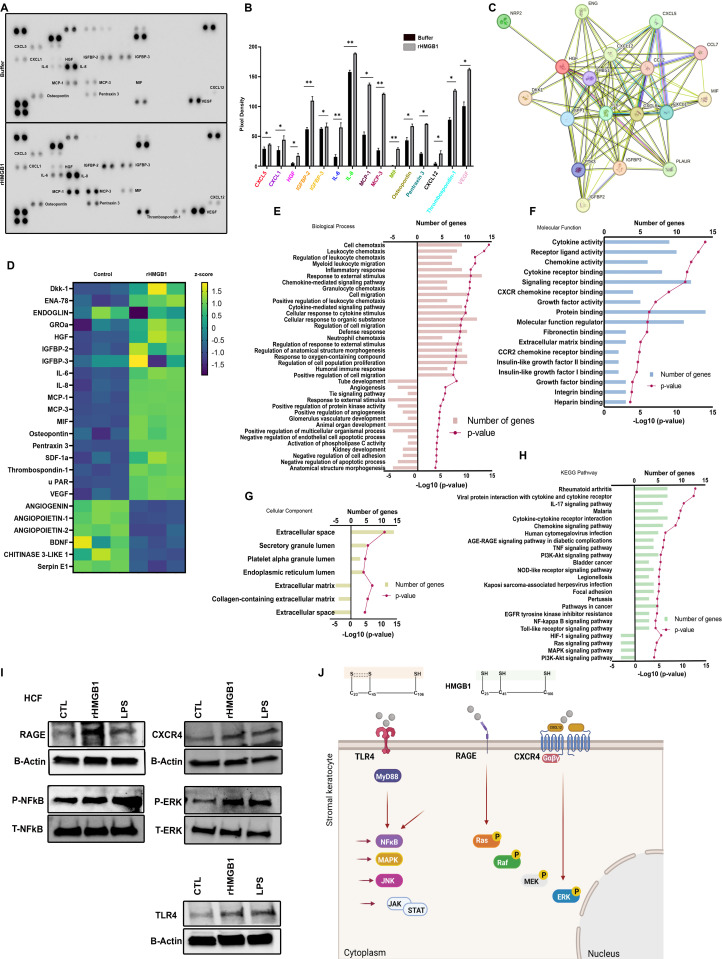
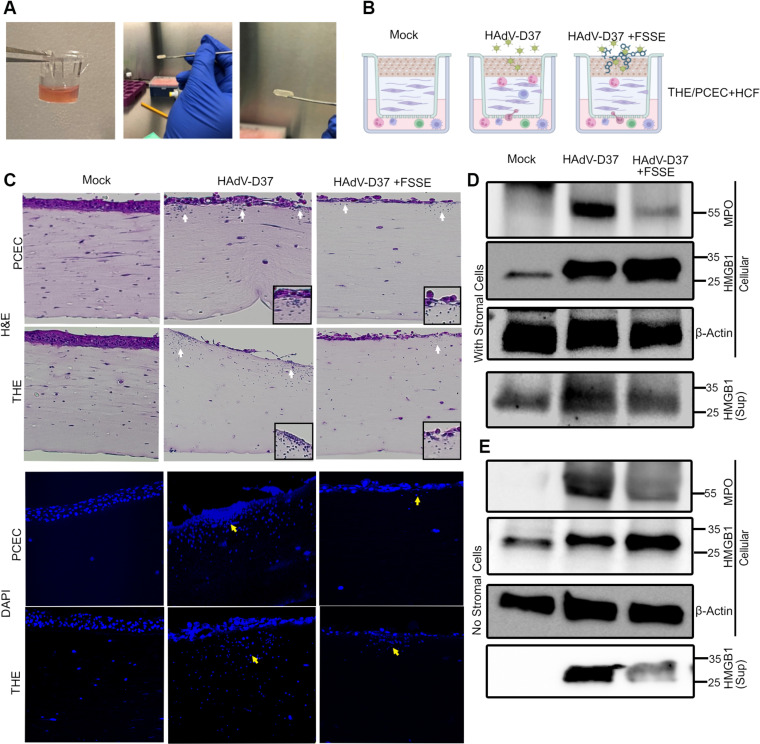
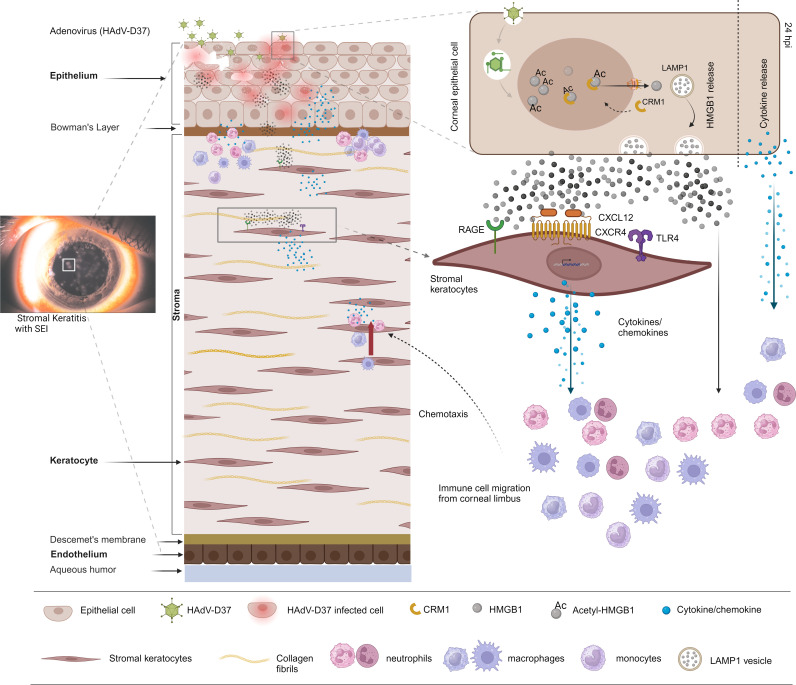
A highly contagious infection caused by human adenovirus species D (HAdV-D), epidemic keratoconjunctivitis (EKC) results in corneal subepithelial infiltration (SEI) by leukocytes, the hallmark of the infection. To date, the pathogenesis of corneal SEI formation in EKC is unresolved. HMGB1 (high-mobility group box 1 protein) is an alarmin expressed in response to infection and a marker of sepsis. Earlier studies using a different adenovirus species, HAdV-C, showed retention of HMGB1 in the infected cell nucleus by adenovirus protein VII, enabling immune evasion. Here, using HAdV-D we show cell-specific HMGB1 secretion by infected cells, and provide an HAdV-D specific mechanism for SEI formation in EKC. HMGB1 was secreted only upon infection of human corneal epithelial cells, not from other cell types, and only upon infection by HAdV-D types associated with EKC. Acetylated HMGB1 translocation from the nucleus to the cytoplasm, then to the extracellular milieu, was tightly controlled by CRM1 and LAMP1, respectively. Primary stromal cells when stimulated by rHMGB1 expressed proinflammatory chemokines. In a novel 3D culture system in tune with the architecture of the cornea, HMGB1 released by infected corneal epithelial cells induced leukocytic infiltrates either directly and/or indirectly via stimulated stromal cells, which together explains SEI formation in EKC.


Conflict of interest statement

The authors have declared that no competing interests exist.

Figures

Fig 1
Fig 1. Cell specific HMGB1 secretion.
(A) Cytoplasmic and nuclear extracts prepared from uninfected or HAdV-D37-infected for 2, 12, 24, and 48 hpi. were resolved on 4-20% SDS-PAGE. Western blots for HMGB1 in the nuclear (Nuc), cytoplasmic (Cyt), and supernatant (Sup) extracts with TBP (nuclear) β-actin (cytoplasmic) as loading controls in cell types THE, PHCE, HCF, A549, and HEK293 (left to right). (B) Densitometric analysis of HMGB1 band intensity of cytoplasmic and nuclear extracts in THE, PHCE, HCF, A549, and HEK293 (left to right). p values were determined by t test; *p < 0.05, **p < 0.01, ***p < 0.001, ****p < 0.0001 (n = 3). (C) Quantification of extracellular HMGB1 measured from supernatants collected at indicated time points pi in THE and PHCE cells (n = 3). (D) Schematic representation (created using Biorender.com) for HAdV-D37 induced translocation of HMGB1 from the cell nucleus to the cytoplasm and then into the extracellular space.
Fig 2
Fig 2. Time dependent translocation of HMGB1 in HAdV-37 infection.
(A) Nuclear and cytoplasmic HMGB1 (green) at 6, 8, 10, and 12 hpi was quantified using computer generated region of interest (ROI) analysis around the nucleus and cell boundary. Arrows and insets (i to x) show HMGB1 nucleus-to-cytoplasmic translocation starting at 8 hpi. At 24 hpi, most of the HMGB1 signal is gone from the cytoplasm, due to secretion into the extracellular space (n = 5). (B) Quantitative analysis of cytoplasmic HMGB1 shows a steady increase until 12 hpi, then a steep drop at 24 hpi. p values at 6 (0.959, ns), 8 (<0.0001), 10 (<0.0001), 12 (<0.0001), 24 hpi (0.9265) compared to mock infection. p values were calculated by one-way ANOVA (Tukey’s multiple comparisons test). (C) Graphs of cytoplasmic HMGB1 measured at various time points pi and compared to mock infection show increases at 8 (<0.0033), 10 (<0.0001), and 12 hpi (<0.0001), and a decrease at 24 hpi (<0.0001). Statistical testing was performed by unpaired t-test (two-tailed). Analysis was done on 60,000 cells/group (n = 5).
Fig 3
Fig 3. EKC virus-specific HMGB1 secretion.
(A) Light microscopic images show cytopathic effect induced by HAdV-D37, D56, D9, and C5 infection of THE and HCF compared to uninfected cells at 24 hpi. Cytopathic effect was noted in all HAdV-D infections, and to a lesser degree with HAdV-C5 infection. (B) Immunofluorescence images at 24 hpi show HMGB1 (green) translocation to the cytoplasm (white arrow heads) only with HAdV-D37, D56, and D9 infection, but not in C5 infection (Space bar = 10µm) (n = 3). (C) Cell culture supernatants from THE and HCF infected with, HAdV-D37, D56, D9, and C5, or mock treated cells at 24 hpi were probed with anti-HMGB1 antibody. Western blot from cellular extracts from the same experiment probed with HAdV-C5 pan antibody are shown in in the adjacent panel. (D) Phylogenetic analysis of whole adenovirus genomes. There were a total of 38,913 positions in the final data set. The evolutionary history was inferred using the Maximum Likelihood method and Tamura-Nei model [105]. Initial tree(s) for the heuristic search were obtained by applying Neighbor-Join and BioNJ algorithms. Evolutionary analyses were conducted in MEGA11 [106]. (E) Multiple sequence alignment of representative protein VII amino acids for members of HAdV-C and D using BioEdit. Sequence differences across types are color coded and sequence conservation are shown with dots. (F) Nuclear extracts from HAdV-D37 and HAdV-C5 infected cells were probed with adenovirus pan antibody for expression of protein VI and protein VII as indicated. (G) Schematic representation (created using Biorender.com) of virus-specific HMGB1 secretion comparing HAdV-C5 and D37.
Fig 4
Fig 4. HMGB1 acetylation is virus specific.
(A) Confocal microscopy using anti-acetylated HMGB1 antibody at 24 hpi with HAdV-D37 or C5, and in 4 cell types: THE, HCF, PCEC and A549. Columns from left to right: nuclei (blue), actin (red), acetyl-HMGB1 (green), and overlay. Increased acetylated-HMGB1 was observed only in THE and PCEC. Scale bar = 10µ. (B) Light microscopy images showing cytopathic effect of HAdV-D37 infected THE cells compared to uninfected cells at different time points (n = 3). (C) Western Blot performed on supernatants collected and concentrated to 50% volume. Acetylated HMGB1 was evident beginning from 8 hpi up to 48 hpi, but not observed in concentrated supernatants of infected HCF. For load control, a nonspecific band (ns) is shown below each panel. (D) Quantitative analysis of HCM images shows increased acetylated-HMGB1 in the cytoplasm of HAdV-D37 infected THE cells compared to mock treated cells. Cytoplasmic HMGB1 quantification from 60,000 cells/condition (MOI of 5) (n = 3). (E) Schematic (created using Biorender.com) of acetylated HMGB1 trafficking upon specific cell type infection.
Fig 5
Fig 5. Corneal epithelial cells release of HMGB1 is independent of pyroptosis.
(A) Schematic representation (created using Biorender.com) of corneal epithelial cell release of HMGB1. HAdV-D37 induces release of HMGB1 into the extracellular space but not IL-18 or IL-1β. (B) Cell culture supernatants from HAdV-D37 infected THE and PCEC, or mock infected cells, were probed with antibodies to HMGB1, GAPDH, IL-18, and IL-1β. Only HMGB1 was detected in the supernatants of THE and PCEC infected cells. Load control and protein presence is indicated by ponceau S staining of the blots. In contrast, inflammasome activity was induced by LPS treatment, as evident by the expression of IL-18 and IL-1β (n = 3). (C) Western blots for IL-18 and IL-1β induced by LPS treatment of THE cells. (D) Colorimetric assay for LDH in the supernatants of HAdV-D37 infected THE cells. LDH quantity was below cytotoxicity levels even at 48 hpi. Data with error bars are represented as mean ± SD.
Fig 6
Fig 6. CRM1 dependent HMGB1 translocation and trafficking to the extracellular space upon adenoviral infection.
(A) CRM1 knockdown (siCRM1) or control (NC-siRNA) treated THE cells, infected with HAdV-D37 for 12 h for HCM analysis. HMGB1 translocation to the cytoplasm is observed in infected, NC-siRNA pretreated cells (inset ii, yellow arrow). No HMGB1 cytoplasmic translocation was observed in siCRM1 treated, or in mock infected cells (inset i, iii, and iv). Masks: gray, algorithm-defined cell boundaries; blue, computer-identified nucleus; yellow outline, computer-identified cytoplasmic HMGB1. Scale bar = 10 µm. (B) Quantitative analysis shows increased nuclear HMGB1 retention in siCRM1 treated, virus infected cells, as compared to NC-siRNA treated, infected cells (red vs purple bars). Cytoplasmic quantification shows reduced HMGB1 in siCRM1 treated, infected cells as compared to NC-siRNA treated, infected cells (red vs purple bars) (n = 5). (C) LAMP1 knockdown (siLAMP1) or control (NC-siRNA) treated cells infected with HAdV-D37 for 12 h. HMGB1 translocation is seen in both NC-siRNA treated and siLAMP1 treated, infected cells (inset ii and iv, yellow arrows) as compared to mock infected cells (inset a and c) (D) HCM quantification shows no significant change in nuclear HMGB1 or cytoplasmic translocation in either NC-siRNA or siLAMP1 treated, infected cells, or mock infected cells (n = 3). (E) Confocal analysis at 24 h after LAMP1 siRNA treatment. In NC-siRNA treated and infected cells no HMGB1 is seen in the cytoplasm, similar to Fig 1A (inset ii, yellow arrow). siLAMP1 treatment led to cytoplasmic HMGB1 retention at 24 hpi (inset iv, yellow arrow). (F) Similar HCM analysis at 24 hpi showed modest nuclear HMGB1 retention in siLAMP1 treated, virus infected cells, as compared to NC-siRNA treated, infected cells (red vs purple bars). In the cytoplasm, HMGB1 accumulation was noted in siLAMP1 treated, virus infected cells as compared to NC-siRNA treated, infected cells. Data shown as the mean ± SD (n = 3). Analyzed by ANOVA with Tukey’s post-hoc test. (G) Schematic representation (created using Biorender.com) showing the pathway of HMGB1 release upon infection of corneal epithelial cells. HMGB1 is dependent on CRM1 for nuclear to cytoplasmic shuttling, and LAMP1 for extracellular release.
Fig 7
Fig 7. rHMGb1 induces expression of proinflammatory mediators in human corneal fibroblasts.
(A) Human cytokine array blot performed on cell supernatants from HCF treated with either PBS (upper panel) or 2 µg/ml rHMGB1 (lower panel) for 4 h showing upregulation of proinflammatory cytokines. (B) Graphical representation of proteins quantified using ImageJ from three experiments, and compared between buffer and rHMGB1 treated cell supernatants. (C) The physical and functional associations among the upregulated proinflammatory mediators were assessed using the STRING tool. The interaction among the query proteins represents the network with 18 nodes and 93 edges of protein-protein interaction (PPI). (D) Heatmap showing the differentially expressed cytokines. Heatmap rows depict z-score SD variation from the mean value for each cytokine (n = 3). (E-H) Gene ontology (GO) showing top biological process, molecular function, KEGG pathway, and cellular components. Bar lengths represent the number of genes and dotted line represents -log10 adjusted p value for significantly enriched pathways. (I) Effect of rHMGB1 on receptors (RAGE, CXCR4, TLR4), and the activation of NFkB and ERK. HCF were treated with rHMGB1 or LPS (100 ng/ml) for 4 h and total cell lysates were prepared to visualize RAGE, CXCR4, TLR4, p-NFkB/total NFkB and p-ERK/total-ERK expression by Western blot. β-actin was used as an internal loading control. Representative blots of three independent experiments are shown. (J) Schematic (created using Biorender.com) of predicted receptor/signaling pathways activated in HCF upon HMGB1 stimulation.
Fig 8
Fig 8. 3D culture mimics natural disease.
(A) Photographs depicting 3D corneal construct preparation. (B) Schematic representation of the 3D corneal constructs treatments and experimental design. (C) Histology of the corneal construct. H&E staining of the mock infected corneal construct with PCEC and THE shows stratified epithelium and stroma with no PBMC migration (column 1, panels 1 and 2). HAdV-D37-infected corneal constructs show foci of immune cell migration as indicated by white arrows (column 2, panels 1 and 2), and reduced immune cell infiltration when pretreated with FSSE (column 3, panels 1 and 2). The enlarged insets show migratory cells within an inflammatory foci. DAPI staining shown for constructs from the same groups, and immune cell migration upon HAdV-D37 infection (column 2, panels 3 and 4, yellow arrow), with reduced immune cells in FSSE treated constructs (column 3, panels 3 and 4, yellow arrows). (D) Immunoblotting of the corneal construct with stromal cells shows increased MPO expression compared to mock infected constructs and to FSSE peptide pre-treated constructs (top panel). Total cellular HMGB1 was retained when constructs were pretreated with FSSE peptide as compared HAdV-D37 infected constructs without FSSE (panel 2). A corresponding increase in secreted HMGB1 in supernatants is seen in HAdV-D37 infected constructs compared to FSSE pretreated constructs (panel 4). Actin for loading control is shown in panel 3. (E) In constructs with no stromal cells, the patterns of HMGB1 and MPO expression are similar: MPO is increased compared to mock infected constructs and to FSSE peptide pre-treated constructs (top panel). HMGB1 is retained in cells and reduced in construct supernatants of FSSE pretreated constructs compared to those infected but untreated with FSSE (panels 2 and 4). Actin for loading control is shown in panel 3.
Fig 9
Fig 9. SEI formation schematic of the study.
Schematic representation (created using Biorender.com) of the mechanism of stromal keratitis/SEI formation upon adenovirus infection. HMGB1 and other mediators expressed by infected corneal epithelium, and the mediators induced by HMGB1 interaction with underlying stromal keratocytes, cumulatively forms a cytokine storm leading to SEI formation, the hallmark of EKC. The human eye photograph with subepithelial infiltrates is reproduced with permission [5] (http://creativecommons.org/licenses/by/4.0/).

Update of

Similar articles

References

    1. Morens DM, Fauci AS. Emerging Pandemic Diseases: How We Got to COVID-19. Cell. 2020;182(5):1077–92. doi: 10.1016/j.cell.2020.08.021 - DOI - PMC - PubMed
    1. Sadoff J, Gray G, Vandebosch A, Cárdenas V, Shukarev G, Grinsztejn B, et al.. Safety and Efficacy of Single-Dose Ad26.COV2.S Vaccine against Covid-19. N Engl J Med. 2021;384(23):2187–201. doi: 10.1056/NEJMoa2101544 - DOI - PMC - PubMed
    1. Zhao J, Zhao S, Ou J, Zhang J, Lan W, Guan W, et al.. COVID-19: Coronavirus Vaccine Development Updates. Front Immunol. 2020;11:602256. doi: 10.3389/fimmu.2020.602256 - DOI - PMC - PubMed
    1. Saha B, Parks RJ. Recent Advances in Novel Antiviral Therapies against Human Adenovirus. Microorganisms. 2020;8(9):1284. doi: 10.3390/microorganisms8091284 - DOI - PMC - PubMed
    1. Pennington MR, Saha A, Painter DF, Gavazzi C, Ismail AM, Zhou X, et al.. Disparate Entry of Adenoviruses Dictates Differential Innate Immune Responses on the Ocular Surface. Microorganisms. 2019;7(9):351. doi: 10.3390/microorganisms7090351 - DOI - PMC - PubMed

MeSH terms

LinkOut - more resources