. 2025 May 14;23(5):e3003163.
doi: 10.1371/journal.pbio.3003163. eCollection 2025 May.

Phosphatase-independent activity of smooth-muscle calcineurin orchestrates a gene expression program leading to hypertension

Affiliations

Phosphatase-independent activity of smooth-muscle calcineurin orchestrates a gene expression program leading to hypertension

Paula Sofía Yunes-Leites et al. PLoS Biol. .

Abstract

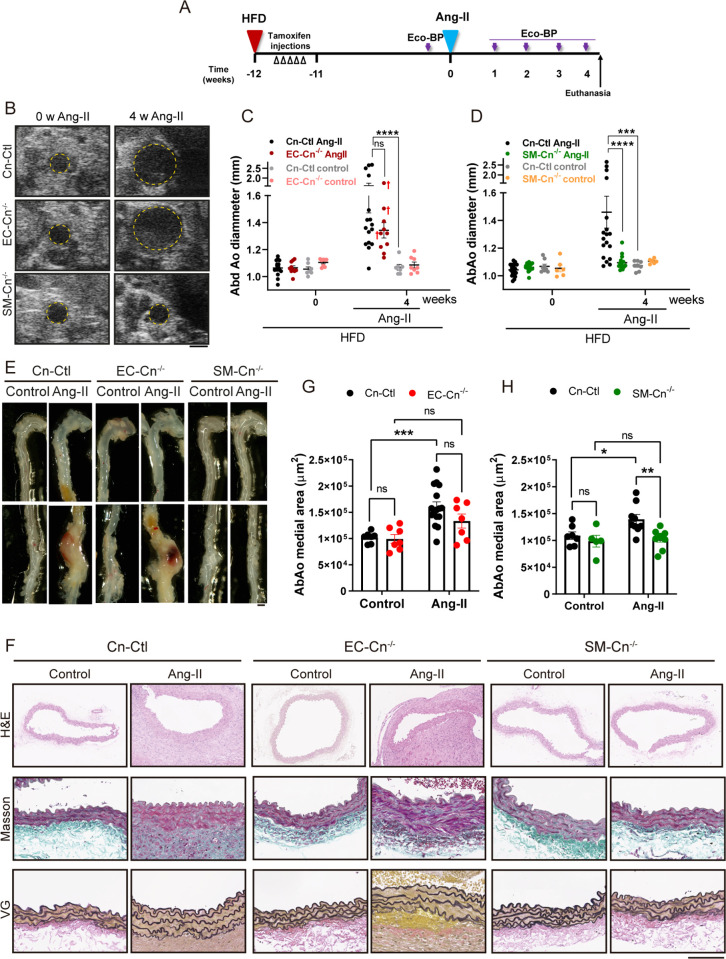
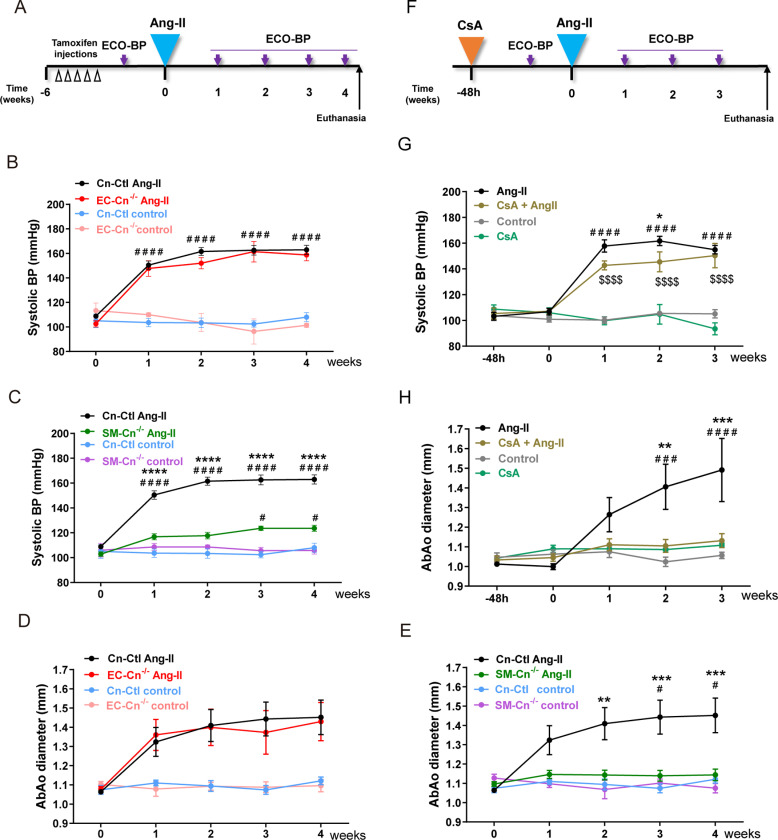
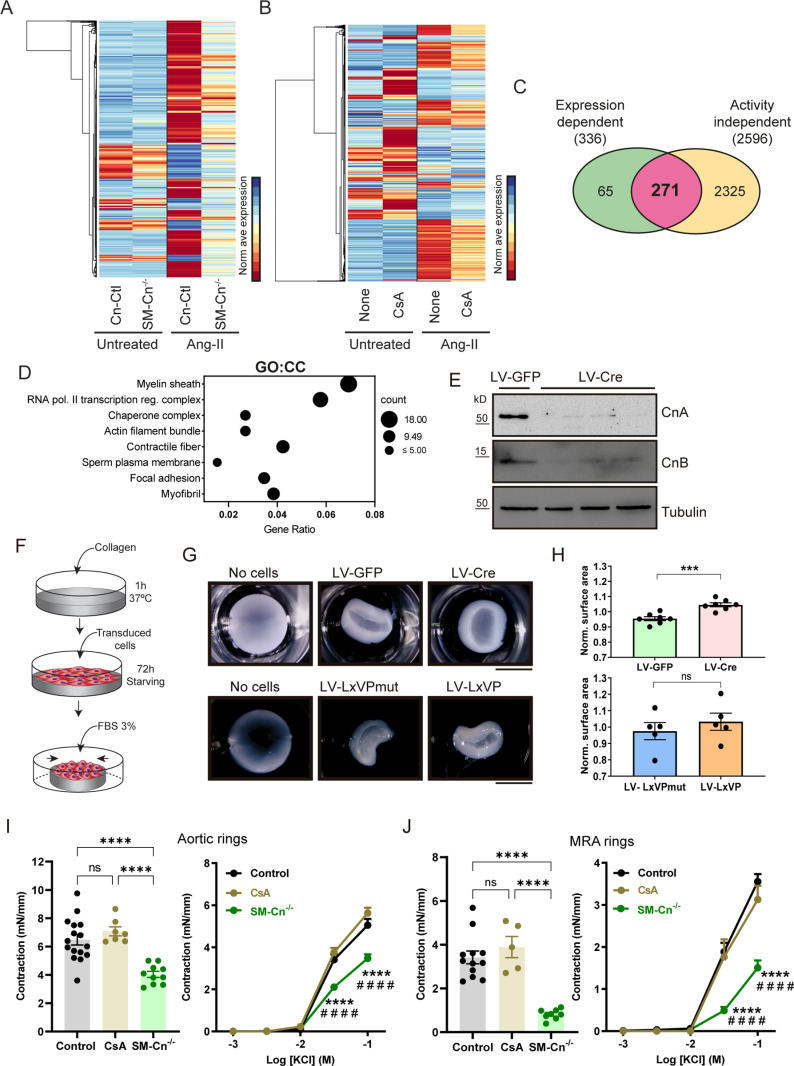
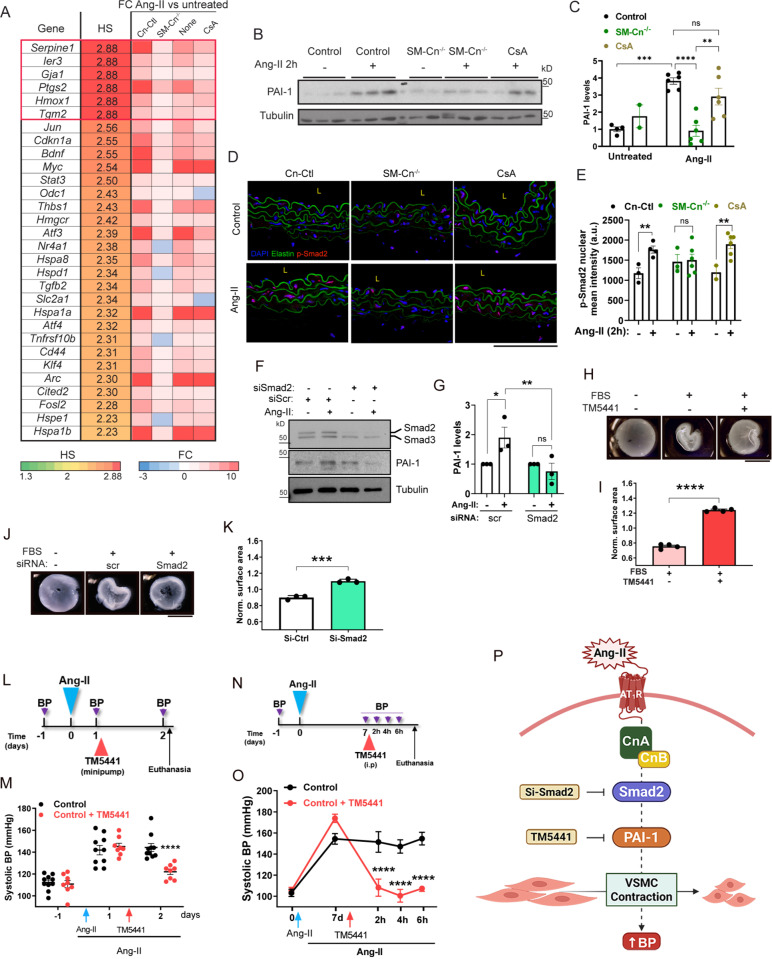
Angiotensin-II (Ang-II) drives pathological vascular wall remodeling in hypertension and abdominal aortic aneurysm (AAA) through mechanisms that are not completely understood. Previous studies showed that the phosphatase activity of calcineurin (Cn) mediates Ang-II-induced AAA, but the cell type involved in the action of Cn in AAA formation remained unknown. Here, by employing newly created smooth muscle cell (SMC)-specific and endothelial cell (EC)-specific Cn-deficient mice (SM-Cn-/- and EC-Cn-/- mice), we show that Cn expressed in SMCs, but not ECs, was required for Ang-II-induced AAA. Unexpectedly, SMC Cn also played a structural role in the early onset and maintenance of Ang-II-induced hypertension, independently of its known phosphatase activity. Among the signaling pathways activated by Ang-II, Cn signaling is essential in SMCs, as nearly 90% of the genes regulated by Ang-II in the aorta required Cn expression in SMCs. Cn orchestrated, independently of its enzymatic activity, the induction by Ang-II of a transcriptional program closely related to SMC contractility and hypertension. Cn deletion in SMCs, but not its pharmacological inhibition, impaired the regulation of arterial contractility. Among the genes whose regulation by Ang-II required Cn expression but not its phosphatase activity, we discovered that Serpine1 was critical for Ang-II-induced hypertension. Indeed, pharmacological inhibition of PAI-1, the protein encoded by Serpine1, impaired SMCs contractility and readily regressed hypertension. Mechanistically, Serpine1 induction was mediated by Smad2 activation via the structural role of Cn. These findings uncover an unexpected role for Cn in vascular pathophysiology and highlight PAI-1 as a potential therapeutic target for hypertension.


Conflict of interest statement

The authors have declared that no competing interests exist.

Figures

Fig 1
Fig 1. Conditional calcineurin (Cn) deletion causes no evident symptoms in the absence of angiotensin-II (Ang-II).
(A) Representative immunoblot analysis of CnA, CnB, CD31, α-SMA, and tubulin (loading control) in mouse aortic endothelial cells (mAECs) and vascular smooth muscle cells (VSMCs), and (B) quantification of their relative expression in protein extracts from n = 3–4 cell lots. Molecular weights (kDa) are indicated. Each data point denotes an individual experiment, and data in histograms are presented as mean ± s.e.m. One-way ANOVA with Tukey post hoc test; ****p < 0.0001, ***p < 0.001, **p < 0.01, n.s., non-significant. (C) Representative immunoblot analysis of CnA, CnB, and tubulin (loading control) in total aortic extracts from n = 10–16 Cn-Ctl and n = 8–10 SM-Cn−/− mice, and (D) quantification of their relative expression in protein extracts. Molecular weights (kDa) are indicated. Each data point denotes an individual mouse, and data in histograms are presented as mean ± s.e.m. Unpaired Student t test; ****p < 0.0001. (E) Systolic blood pressure (BP), (F) diastolic BP, (G) abdominal aorta (AbAo), and (H) ascending aorta (AsAo) diameters in Cn-Ctl, SM-Cn−/−, and EC-Cn−/− mice. Each data point denotes an individual mouse, and the horizontal bars denote the mean (long bar) and s.e.m. The number of mice per group is indicated in each panel. (I) Representative images of hematoxylin–eosin–stained AbAo and AsAo cross-sections from the indicated mice (n = 5 mice per genotype). Scale bar, 250 μm. Underlying data can be found in S1 Data.
Fig 2
Fig 2. Smooth muscle cell (SMC)calcineurin (Cn) is required for angiotensin-II (Ang-II)-induced abdominal aortic aneurysm formation.
(A) Experimental design: 10–12-week-old mice were treated with tamoxifen for five consecutive days (open arrowheads) during the first week of high-fat diet (HFD) feeding. After 12 weeks of HFD, Ang-II osmotic minipumps were implanted for 4 weeks; control mice were operated without minipump implantation. Maximum aortic diameter and BP were measured (Eco-BP) at the indicated time points (purple arrows), and mice were euthanized at the end of the experiment. (B) Representative ultrasound images of AbAo from mice before and after 4 weeks of Ang-II treatment. Yellow lines mark the lumen boundary. Scale bar, 1 mm. (C, D) AbAo diameter in (C) 7 Cn-Ctl and 8 EC-Cn−/− control-treated mice and 16 Cn-Ctl and 10 EC-Cn−/− Ang-II-treated, and in (D) 8 Cn-Ctl and 6 SM-Cn−/− control-treated mice and 18 Cn-Ctl and 16 SM-Cn−/− Ang-II-treated mice. Each data point denotes an individual mouse, and the horizontal bars denote the mean (long bar) and s.e.m. ****p < 0.0001, ***p < 0.001; repeated-measurements (RM) two-way ANOVA with Tukey’s post hoc test. Red crosses (†) indicate mice that died before completion of the experiment and exhibited a ruptured aneurysm. (E) Representative images of aortas from mice treated as indicated. Scale bar, 1 mm. (F) Representative images of hematoxylin–eosin (HE), Masson trichrome (Masson), and Van Gieson (VG) staining on AbAo sections from 4 Cn-Ctl, 3 EC-Cn−/−, and 4 SM-Cn−/− mice. Scale bar, 100 µm. Medial area in AbAo sections from (G) 7 Cn-Ctl and 7 EC-Cn−/− control-treated mice and 16 Cn-Ctl and 7 EC-Cn−/− Ang-II-treated mice and (H) 7 Cn-Ctl and 5 SM-Cn−/− control-treated mice and 9 Cn-Ctl and 9 SM-Cn−/− Ang-II-treated mice. Each data point denotes an individual mouse, and data in histograms are presented as mean ± s.e.m. ***p < 0.001, **p < 0.01, *p < 0.05, n.s., non-significant; two-way ANOVA with Šídák post hoc test. Underlying data can be found in S1 Data. Data from a subset of untreated and Ang-II-treated Cn-Ctl mice were repeated in panels C and D and in panels G and H as indicated in S1 Data.
Fig 3
Fig 3. Calcineurin (Cn) deletion in smooth muscle cell (SMCs) prevents angiotensin-II (Ang-II)-driven arterial hypertension in mice fed a high-fat diet (HFD).
The blood pressure (BP) was measured in the mice shown in Fig 2. (A) Systolic and (B) diastolic BP values at the indicated times in 7 Cn-Ctl and 8 EC-Cn−/− control-treated mice and 16 Cn-Ctl and 10 EC-Cn−/− Ang-II-treated mice (left panels) and 8 Cn-Ctl and 6 SM-Cn−/− control-treated mice and 18 Cn-Ctl and 16 SM-Cn−/− Ang-II-treated mice (right panels). Red crosses (†) indicate EC-Cn−/− mice that died before completion of the experiment and exhibited a ruptured aneurysm. Data are presented as mean ± s.e.m. ****p < 0.0001, *p < 0.05 vs. EC-Cn−/− Ang-II or vs. SM-Cn−/− Ang-II, ####p < 0.0001, ###p < 0.001, ##p < 0.01, and #p < 0.05 vs. Cn-Ctl control, and (A, right) #p < 0.05 vs. SM-Cn−/− control, n.s., non-significant; RM two-way ANOVA with Tukey’s post hoc test. Underlying data can be found in S1 Data. Data from a subset of untreated and Ang-II-treated Cn-Ctl mice were repeated in right and left panels of Figures A and B as indicated in S1 Data.
Fig 4
Fig 4. Smooth muscle cell (SMC) calcineurin (Cn) mediates angiotensin-II (Ang-II)-induced hypertension independently of its phosphatase activity.
(A) Experimental design: 10–12-week-old mice were treated with tamoxifen for five consecutive days (open arrow heads) and, after 6 weeks, Ang-II osmotic minipumps were implanted for 4 weeks in one group of mice; control mice were operated without minipump implantation. Maximum aortic diameter and blood pressure (BP) were measured (Eco-BP) at the indicated time points (purple arrows), and mice were euthanized at the end of the experiment. (B, C) Systolic BP and (D, E) maximal abdominal aorta (AbAo) diameters at the indicated times in 5 Cn-Ctl, 3 EC-Cn−/−, and 5 SM-Cn−/− control-treated mice and 22 Cn-Ctl, 10 EC-Cn−/−, and 18 SM-Cn−/− Ang-II-treated mice. Data are presented as mean ± s.e.m. ****p < 0.0001, ***p < 0.001, **p < 0.01 vs. SM-Cn−/− Ang-II, ####p < 0.0001 vs. Cn-Ctl control, #p < 0.05 vs. SM-Cn−/− or Cn-Ctl control; RM two-way ANOVA with Tukey’s post hoc test. (F) Experimental design: 10–12-week-old mice were fitted with cyclosporine A (CsA) osmotic minipumps; control mice were operated without minipump implantation. After 48 h, Ang-II minipumps were implanted in a group of CsA-treated mice (CsA + Ang-II) and in a group of CsA control mice (Ang-II). The remaining CsA control mice were operated without minipump implantation (Control). Maximal aortic diameter and BP were measured (Eco-BP) at the indicated time points (purple arrows), and mice were euthanized at the end of the experiment. (G) Systolic BP and (H) maximal AbAo diameters at the indicated times in 8 Control-, 10 Ang-II-, 4 CsA-, and 8 CsA + Ang-II-treated mice. Data are presented as mean ± s.e.m. ***p < 0.001, **p < 0.01, *p < 0.05 vs. CsA + Ang-II, ####p < 0.0001, ###p < 0.001 vs. control, $$$$p < 0.0001 vs. CsA; RM two-way ANOVA with Tukey’s post hoc test. Underlying data can be found in S1 Data. Data from untreated and Ang-II-treated Cn-Ctl mice were repeated in panels B and C, and in panels D and E as indicated S1 Data.
Fig 5
Fig 5. Calcineurin (Cn) inhibition by LxVP lentiviral transduction impairs NFAT activation in vivo without preventing angiotesin-II (Ang-II)-induced hypertension.
(A) Experimental design: 10–12-week-old mice were inoculated with LxVPmut- or LxVP-encoding lentivirus (LV) and, after 6 weeks, Ang-II osmotic minipumps were implanted for 4 weeks. BP was measured at the indicated time points (purple arrows), and mice were euthanized at the end of the experiment. (B) Systolic and diastolic BP in mice transduced with LV-LxVPmut (n = 7) and LV-LxVP (n = 7), shown as mean ± s.e.m. ****p < 0.0001, ***p < 0.001, **p < 0.01, *p < 0.05 and ###p < 0.001, ##p < 0.01 vs. beginning of treatment (0 weeks) for LV-LxVPmut- and LV-LxVP-transduced mice, respectively; RM two-way ANOVA with Tukey’s post hoc test. (C) Representative images of GFP immunostaining in abdominal aorta (AbAo) and ascending aorta (AsAo) cross-sections from the indicated mice. (D) Representative images of southwestern histochemistry with an NFAT probe of AbAo and AsAo cross-sections from the indicated mice and (E) quantification of the relative staining (NFAT activity) in the AbAo (left panel) and the AsAo (right panel). Dashed lines indicate the medial layer. Only mice with positive aortic GFP staining and consistent NFAT activity were included. Each data point denotes an individual mouse, and data in histograms are presented as mean ± s.e.m. Mann–Whitney test **p < 0.01. Scale bars, 100 μm. Underlying data can be found in S1 Data.
Fig 6
Fig 6. Smooth muscle cell (SMC) calcineurin (Cn) is required for both the onset and the long-term sustainability of angiotensin-II (Ang-II)-induced hypertension.
(A) Experimental design: 10-12-week-old mice were treated with tamoxifen for five consecutive days (open arrow heads) and, after 6 weeks, Ang-II osmotic minipumps were implanted for 2 and 24 h. BP was measured at the indicated time points (purple arrows), and mice were euthanized and analyzed when indicated. (B) Systolic BP values in the indicated mice (n = 9 mice per group and time point). Each data point denotes an individual mouse, and the horizontal bars denote the mean (long bar) and s.e.m. ****p < 0.0001 vs. baseline; RM two-way ANOVA with Tukey post hoc test. ####p < 0.0001 vs. 2 or 24 h Ang-II Cn-Ctl; RM two-way ANOVA with the Šídák post hoc test. (C) Experimental design: 10–12-week-old mice were fitted with CsA osmotic minipumps (CsA-pretreated); control mice were operated without minipump implantation (Control). After 5 days, Ang-II minipumps were implanted in CsA-pretreated and Control mice for 2 and 24 h. BP was measured at the indicated time points (purple arrows), and mice were euthanized and analyzed when indicated. (D) Systolic BP in the indicated mice (n = 9 mice per group and time point). Each data point denotes an individual mouse, and the horizontal bars denote the mean (long bar) and s.e.m. ****p < 0.0001 vs. baseline; RM two-way ANOVA with Tukey’s post hoc test. (E) Experimental design: 10–12-week-old mice were fitted with Ang-II osmotic minipumps for 4 weeks. After 7 days of Ang-II infusion, tamoxifen was administered for five consecutive days (open arrow heads). BP was measured at the indicated time points (purple arrows), and mice were euthanized at the end of the experiment. (F) Systolic BP measurements at the indicated times in 10 Cn-Ctl and 12 SM-Cn−/− mice. Each data point denotes an individual mouse, and the horizontal bars denote the mean (long bar) and s.e.m. ****p < 0.0001, ***p < 0.001 vs. Cn-Ctl Ang-II; RM two-way ANOVA with Šídák post hoc test. Tx indicates tamoxifen administration time points. Underlying data can be found in S1 Data.
Fig 7
Fig 7. Smooth muscle cell (SMC) calcineurin (Cn) orchestrates an angiontensin-II (Ang-II)-induced transcriptional program related to arterial contractility.
(A, B) Heatmaps of the normalized average expression of differentially expressed genes (DEGs) regulated by angiotensin-II (Ang-II) relative to the untreated conditions in each independent RNAseq dataset. (C) Venn diagram comparing the number of Cn expression-dependent DEGs (336) and Cn activity-independent DEGs (2,596), and showing the number of shared DEGs whose regulation by Ang-II requires Cn expression but not its activity (271). (D) Most significantly enriched cellular components (CC) of the 271 Cn expression-dependent DEGs, obtained by g:Profiler. (E) Representative immunoblot analysis (n = 7 individual experiments) of CnA, CnB, and tubulin (loading control) in protein extracts from primary VSMCs transduced with GFP- or Cre-encoding lentivirus (LV-GFP- or LV-Cre, respectively). Molecular weights (kDa) are indicated. (F) Experimental design: Collagen gels were polymerized for 1 h at 37 °C, and VSMCs (8 × 10⁴) were seeded on each gel, allowed to adhere for 5 h, and serum-starved for 72 h. Gels were then gently detached from the plates and incubated in DMEM supplemented with 3% FBS for 24—48 h at 37 °C. (G) Representative images and (H) normalized surface area of fixed collagen gels under the indicated conditions. Each data point denotes the mean of one experiment, and data in histograms are presented as mean ± s.e.m. (n = 7 independent experiments with LV-GFP and LV-Cre; n = 5 independent experiments with lentivirus encoding the LxVP peptide or its inactive form LxVPmut). ***p < 0.001; n.s., non-significant; unpaired Student t test. Scale bars, 5 mm. Quantification of tension in (I) aortic rings and (J) mesenteric resistance artery (MRA) rings from control (Cn-Ctl or WT), SM-Cn−/−, or CsA-treated WT mice after stimulation for 30 min with 80 mM KCl (left panels) and the indicated KCl concentrations (right panels). Left panels: each data point denotes an individual mouse, and data in histograms are presented as mean ± s.e.m. ****p < 0.0001; one-way ANOVA with Tukey post hoc test. Right panels: data are shown as mean ± s.e.m. ****p < 0.0001 vs. control, ####p < 0.0001 vs. CsA; two-way ANOVA with Tukey post hoc test. Aortic rings experiments including samples from 16 control, 10 SM-Cn−/−, and 7 CsA-treated mice, while MRA rings were anlyzed from 12 control, 8 SM-Cn−/−, and 5 CsA-treated mice. Underlying data can be found in S1 Data.
Fig 8
Fig 8. Plasminogen activator inhibitor type-1 (PAI-1) mediates vascular smooth muscle cell (VSMC) contractility and angiotensin-II (Ang-II)-induced hypertension.
(A) List of the top 30 genes with the highest hypertension score (HS), including their gene symbol, HS, and expression fold change (FC) after 2 h of Ang-II treatment relative to untreated mice. (B) Representative immunoblot analysis of PAI-1 and tubulin (loading control) and (C) quantification of their relative expression in protein extracts from untreated control (n = 4) and SM-Cn−/− (n = 2) mice and from Ang-II-treated control (n = 6), SM-Cn−/− (n = 6), and CsA-pretreated (n = 6) mice. Molecular weights (kDa) are indicated. One-way ANOVA with Tukey post hoc test; ****p < 0.0001, ***p < 0.001, **p < 0.01, n.s., non-significant. (D) Representative images of phospho-Smad2 immunostained AbAo cross-sections from the indicated group of mice. L, lumen. Scale bar, 100 μm. (E) Quantification of the mean intensity of the phospho-Smad2 nuclear signal in the same cross-sections. Each data point denotes an individual mouse, with values representing the average quantification of at least two independent images per mouse. Data in histograms are presented as mean ± s.e.m. **p < 0.01; unpaired Student t test. (F) Representative immunoblot analysis of Smad2/3, PAI-1, and tubulin (loading control) and (G) quantification of their relative expression in protein extracts from the indicated groups (n = 3 independent experiments). Molecular weights (kDa) are indicated. Data are presented as mean ± s.e.m. *p < 0.05, **p < 0.01; two-way ANOVA with Šídák post hoc test. (H–K) Representative images (H, J) and normalized surface area (I, K) of fixed collagen gels under the indicated conditions. Each data point denotes the mean of each experiment, and data in histograms are presented as mean ± s.e.m. (n = 3−4 independent experiments with 3% FBS and 50 µM TM5441 (H)). ***p < 0.001, ****p < 0,0001; unpaired Student t test. Scale bars, 5 mm. (L) Experimental design: 10–12-week-old mice were fitted with Ang-II osmotic minipumps (Ang-II) 24 h before implantating TM5441 minipumps in a group of Ang-II-pretreated mice (Ang-II + TM5441). BP was measured at the indicated time points (purple arrows), and mice were euthanized at the end of the experiment. (M) Systolic BP at the indicated times in 10 Ang-II-treated mice (Ang-II) and 8 mice treated with Ang-II + TM5441. Data are presented as mean ± s.e.m. ****p < 0.001, vs. Control; RM two-way ANOVA with Šídák post hoc test. (N) Experimental design: 10–12-week-old mice were fitted with Ang-II osmotic minipumps (Ang-II) 7 days before intraperitoneally injecting TM5441 or vehicle to a group of Ang-II-pretreated mice. BP was measured at the indicated time points (purple arrows), and mice were euthanized at the end of the experiment. (O) Systolic BP at the indicated times in 5 Ang-II + vehicle (Control) and 6 mice treated with Ang-II + TM5441 (Control + TM5441). Data are presented as mean ± s.e.m. ****p < 0.001, vs. Control; RM two-way ANOVA with Šídák post hoc test. (P) Proposed mechanism: a structural role of SMC Cn mediates the induction of PAI-1 by Ang-II via Smad2 activation, subsequently leading to VSMC contraction and the increase of blood pressure (BP). Underlying data can be found in S1 Data.

Similar articles

References

    1. Curci JA. Digging in the “soil” of the aorta to understand the growth of abdominal aortic aneurysms. Vascular. 2009;17 Suppl 1(Suppl 1):S21–9. doi: 10.2310/6670.2008.00085 - DOI - PMC - PubMed
    1. Ferdinand KC, Harrison D, Johnson A. The NEW-HOPE study and emerging therapies for difficult-to-control and resistant hypertension. Prog Cardiovasc Dis. 2020;63(1):64–73. doi: 10.1016/j.pcad.2019.12.008 - DOI - PubMed
    1. Touyz RM, Alves-Lopes R, Rios FJ, Camargo LL, Anagnostopoulou A, Arner A, et al. Vascular smooth muscle contraction in hypertension. Cardiovasc Res. 2018;114(4):529–39. doi: 10.1093/cvr/cvy023 - DOI - PMC - PubMed
    1. Brown IAM, Diederich L, Good ME, DeLalio LJ, Murphy SA, Cortese-Krott MM, et al. Vascular smooth muscle remodeling in conductive and resistance arteries in hypertension. Arterioscler Thromb Vasc Biol. 2018;38(9):1969–85. doi: 10.1161/ATVBAHA.118.311229 - DOI - PMC - PubMed
    1. Savoia C, Burger D, Nishigaki N, Montezano A, Touyz RM. Angiotensin II and the vascular phenotype in hypertension. Expert Rev Mol Med. 2011;13:e11. doi: 10.1017/S1462399411001815 - DOI - PubMed