Review
. 2025 May 27;19(20):18902-18928.
doi: 10.1021/acsnano.5c01142. Epub 2025 May 14.

Drop Friction and Failure on Superhydrophobic and Slippery Surfaces

Affiliations
Review

Drop Friction and Failure on Superhydrophobic and Slippery Surfaces

Abhinav Naga et al. ACS Nano. .

Abstract

The mobility of drops on a surface influences how much water and energy is required to clean the surface. By controlling drop mobility, it is possible to promote or reduce fogging, icing, and fouling. Superhydrophobic and slippery liquid-infused surfaces both display high drop mobility despite being 'lubricated' by fluids having very different viscosities. Superhydrophobic surfaces rely on micro- and/or nanoscale textures to trap air pockets beneath drops, minimizing solid-liquid contact. In contrast, on liquid-infused surfaces, these solid textures are filled with an immiscible liquid lubricant. Over the past few years, innovations in experimental and computational methods have provided detailed new insights into the static and dynamic wetting properties of drops on these surfaces. In this review, we describe the criteria needed to obtain stable wetting states with low drop friction and high mobility on both surfaces, and discuss the mechanisms that have been proposed to explain the origins of friction on each surface. Drops can collapse from the low-friction Cassie state to the high-friction Wenzel state on both surfaces, but the transition follows different pathways: on liquid-infused surfaces, the wetting ridge near the drop edge plays a central role in triggering collapse, a phenomenon not observed on superhydrophobic surfaces. This review emphasizes that a liquid-infused surface cannot be simply viewed as a superhydrophobic surface with the air pockets replaced by lubricant. The wetting ridge surrounding drops on liquid-infused surfaces significantly alters most of the drop's properties, including macroscopic shape, friction mechanisms, and the mechanism of collapse to a Wenzel state.

Keywords: adhesion; capillarity; drops; friction; interfacial phenomena; lubrication; roughness; surface cleaning; wetting.


Figures

1
1
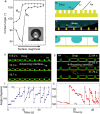
Timeline showing some key discoveries and selected methods to study the wetting of SHS and LIS. Although Young’s equation is named after Thomas Young and attributed to his 1805 paper, the equation was first written by Dupré in 1869. , The equations used to describe the wetting of rough surfaces were pioneered by Wenzel as well as Cassie and Baxter. Dettre and Johnson observed that a hydrophobic surface can become superhydrophobic by increasing its roughness. In the 1990s, the first fractal-like superhydrophobic surfaces were fabricated in a lab (1996 inset. Reproduced from ref . Copyright 1996 American Chemical Society) and scanning electron microscopy was adopted to image the structure of natural superhydrophobic surfaces such as the lotus leaf (1997 inset. Reproduced with permission from ref . Copyright 1997 Springer Nature). , Computational methods were developed to explicitly simulate drop interaction with superhydrophobic surfaces in the early 2000s (2005 inset. Reproduced with permission from ref . Copyright 2005 American Chemical Society.). Re-entrant structures were designed in 2007 (2007 inset. From ref , Tuteja et al. 2007. Reprinted with permission from AAAS) to repel liquids having interfacial tension below 0.03 N/m, such as octane. The concept of LIS was first mentioned (as hemisolids) in a 2008 review paper by Quéré. LIS became popular in 2011 (2011 inset. Reproduced with permission from ref . Copyright 2011 Springer Nature). , Cantilever methods were introduced to measure drop friction in 2012 (2012 inset. Schematic inspired by ref ). Several variations of these methods have been introduced since. − The contact line of drops collapsing to the Wenzel state on SHS was visualized with interference microscopy in 2007 and with confocal microscopy in 2013 (2013 inset. Reproduced from ref . Copyright 2013 National Academy of Sciences). , The first numerical methods to study drop dynamics on LIS were developed in 2016 (2016 inset. Reproduced from ref . Copyright 2018 American Chemical Society), , and the first papers discussing friction on LIS were published in 2017 (2017 inset. Reprinted figure with permission from ref . Copyright 2020 by the American Physical Society). ,
2
2
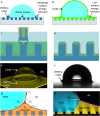
Advancing and receding contact angles on rough surfaces. (a) The apparent advancing and receding contact angles increase beyond a certain roughness, indicating a transition to the Cassie state. Adapted from ref . Copyright 1964 American Chemical Society. Note that the apparent receding contact angle initially decreases with roughness, as predicted by the Wenzel equation (eq ) when the contact angle is less than 90°, suggesting that the drop is initially in a Wenzel state until a critical roughness is reached. (b) Sketch of how a drop (greenish blue) advances on a micropillar array (yellow). Here it is assumed that the drop-air interfaces are flat. (c) Confocal microscopy image of a water drop on a micropillar array. Fluorescently labeled water is shown in cyan, pillars are drawn in yellow, and reflection at the drop-air interface is shown in magenta. Pillar center-to-center (pitch) distance is equal to p = 40 μm. (d) Re-entrant structures such as the T-shape structures shown here can be used to repel liquids with surface tension below 0.03 N/m. Adapted with permission under a Creative Commons CC BY 4.0 License from ref . Copyright 2019 The American Association for the Advancement of Science. (e) Advancing side of a water drop on micropillars imaged by confocal microscopy. Reflection at the air/water interface is shown in yellow and pillars are drawn in green. There is negligible sagging of the air–water interface between the pillars because the drop radius is much larger than the spacing of the pillars. The sagging depth scales as δ ∼ p 2/R, where p is the pitch distance of the pillars and R is the drop radius. Here, the pitch distance is 20 μm and the drop radius is around 1 mm, which gives a sagging depth of δ ∼ 0.4 μm. Such a small sagging depth cannot be observed with the resolution of the images. (f) The apparent advancing contact angle extracted from the profiles in (e) is close to 180°. Abrupt changes correspond to the advancement of the drop to the next row of pillars. (g) Receding side of a water drop. Pillar center-to-center distance is equal to 40 μm. Apparent receding contact angles defined at the height shown in red are plotted in (h). Panels (c, e–h) adapted with permission ref . Copyright 2016 by the American Physical Society.
3
3
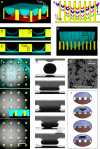
Drops on LIS. (a) Drop deposited on liquid-infused micropillar array. The lubricant fills the gaps but dewets from the pillars top face and from the drop. (b) The lubricant wets the pillars and cloaks the drop. Panels (a) and (b) reproduced with permission from ref . Copyright 2013 by the Royal Society of Chemistry. (c) Sketch of a LIS with a hierarchical structure submerged in water, for example under a drop (light blue). The silicone micropillars (dark blue) are covered with nanostructures. The nanostructure is chemically modified (orange) to ensure good chemical compatibility with the lubricant (green). The inset shows an enlarged view of the infiltrated nanostructure. (d) An example of a micro-Wenzel but nano-Cassie state. The thickness of the lubricant layer separating the drop from the substrate is determined by the height of the infused structure. Panels (c) and (d) adapted from ref . Copyright 2015 American Chemical Society. (e) Confocal image of a drop on a micropillar array. Only the lubricant is fluorescently labeled. The drop is surrounded by a wetting ridge and covered by a lubricant cloak. Adapted with permission under a Creative Commons CC BY 4.0 License from the Supporting Information of ref . Copyright 2024, The Authors. (f) Backlight microscopy (goniometer) image of a drop deposited on a liquid-infused micropillar array. (g) The Neuman triangle and the contact angles at the air-drop-lubricant contact line. Adapted from ref . Copyright 2018 American Chemical Society. (h) Confocal image of the wetting ridge surrounding the drop. Fluorescently labeled water in cyan, lubricant in yellow, reflection at the lubricant/air interface in magenta. The macroscopic contact angle Θmacro is smaller than the apparent contact angle ΘCB at the drop-lubricant-solid contact line. Panels (f) and (h) adapted with permission under a Creative Commons CC BY 3.0 License from ref . Copyright 2015 by the Royal Society of Chemistry.
4
4
Apparent advancing and receding contact angles at the solid-drop-lubricant contact line on LIS. (a) Confocal microscopy images monitoring the advancement of a drop (cyan) on a LIS (yellow pillars). The drop makes contact with the pillars. The lubricant (FC70) was not dyed and appears black. The drop advanced by applying air flow. Pillars are drawn by hand, because they appear shorter than their real height in the confocal microscope, due to refractive index mismatch between the pillars and lubricant. The height of the pillars was determined using scanning electron microscopy. (b) The apparent advancing contact angle continuously increased until it reached 180° and subsequently decreased to a lower value abruptly. The contact angles were extracted from the movie from which the snapshots in (a) were taken. The red crosses correspond to the snapshots in (a). (c) Confocal microscopy images of the receding side of a drop on LIS. The drop receded due to evaporation. (d) The apparent contact angle at the receding side continuously decreased until it approached the apparent receding contact angle. All panels adapted with permission under a Creative Commons CC BY 3.0 License from ref . Copyright 2015 by the Royal Society of Chemistry.
5
5
Solid geometries used for SHS and LIS. All panels correspond to images taken using scanning electron microscopy, except for panel (l), which is a schematic. (a) Candle soot nanoparticles covered by silica. To lower the surface energy, the hydrophilic silica shells were coated with a semifluorinated silane. Adapted with permission from ref . Copyright 2012, American Association for the Advancement of Science. (b) Silicone nanofilaments. Adapted from ref (modified the scale bar). Copyright 2016 WILEY-VCH Verlag GmbH & Co. KGaA, Weinheim. (c) Black silica with micrometer-sized spikes. Adapted with permission under a Creative Commons CC BY 4.0 License from ref . Copyright 2023 Springer Nature. (d) Silica microposts with wax layer. (e–f) Silica microposts with doubly re-entrant nano-overhangs. (g–h) Hierarchical structure of silicone micropillars with Lotus wax tubules. Panels (d), (g), (h) adapted with permission from ref . Copyright 2009 by the Royal Society of Chemistry. Panels (e) and (f) adapted with permission from ref . Copyright 2014, American Association for the Advancement of Science. (i) Janus micropillars, covered with a layer of colloidal particles. Adapted with permission under a Creative Commons CC BY 3.0 License from ref . Copyright 2014 by the Royal Society of Chemistry. (j) Inverse opal. Adapted with permission under a Creative Commons License CC BY 3.0 from ref . Copyright 2015 by the Royal Society of Chemistry (k) Teflon wrinkles, reprinted with permission under a Creative Commons License CC BY 4.0 from ref . Copyright 2022 Springer Nature. (l) Schematic of a functionalized porous solid for LIS. Reprinted with permission from ref . Copyright 2011, Springer Nature Limited.
6
6
Mechanisms giving rise to friction when drops move on superhydrophobic surfaces. (a) Schematic of a drop moving on a SHS. The different regions where dissipation arises are highlighted by the dotted rectangles. (b) Velocity profile inside a drop showing that flow inside the drop follows a rolling trajectory. The velocity profiles were obtained by imaging the trajectory of tracer particles experimentally. The figure is adapted with permission under a Creative Commons License CC BY 4.0 from ref . Copyright 2020 The Authors. The flow inside the drop can lead to significant friction due to viscous shear in the drop when the liquid is viscous. (c) Schematic of velocity streamlines at the advancing wedge close to the drop/air interface. At the wedge, the dissipation in the air phase can exceed that in the drop phase since the flow is strongly confined in the air phase. The panel is adapted with permission from ref . Copyright 2013 AIP Publishing. (d) Depinning of a capillary bridge as a drop recedes on an array of micropillars. The image was taken using confocal microscopy. Adapted from ref . Copyright 2017 American Chemical Society. (e) Drop base visualized using reflection interference contrast microscopy. At low speeds (0.1 mm/s), the drop is in contact with the surface, but at high speeds (30 cm/s), the drop lifts off and an air film (which gives rise to dissipation) forms between the drop and the solid texture, as shown in the schematics below the interferograms. In these measurements, the drop was held in position by a cantilever while the substrate moved at constant velocity. The direction of the arrows labeled U shows the direction of motion of the substrate. The advancing and receding sides of the drop are labeled as Adv. and Rec., respectively. Reprinted with permission under a Creative Commons License CC BY 3.0 from ref . Copyright 2024 by the Royal Society of Chemistry. (f) Water drop rolling inside a superhydrophobic cylinder spinning clockwise at 26 cm/s. To illustrate the flow of air around the drop, we have added the white arrows on top of the original image. The white arrows are deduced by observing the flow of air in the movie. Adapted from the supplementary movie in ref under a standard PNAS License.
7
7
Relationship between friction force, drop velocity, and air capillary number on superhydrophobic surfaces. On the y-axis, the friction force is normalized by the product of drop base width and surface tension of the drop. The data is extracted from refs , , , , and . The non-normalized friction force spans from tens of nN to several μN. On the x-axis, the capillary number is defined in terms of the drop velocity and the air viscosity for all data sets. Throughout this figure, γ denotes the drop-air surface tension. The top x-axis shows the drop velocity. In the plot, circle symbols correspond to Glaco-coated substrates, triangles correspond to black silicon, and squares correspond to micropillars. SEM images of some of the surface geometries are included as insets. At low Ca, there is initially a plateau, where the friction force is independent of velocity. In this regime, the friction force is dominated by capillary depinning. The height of this plateau depends on the solid fraction of the surface geometry. Above a critical Ca, the friction becomes velocity-dependent and scales as F/(γw) ∼ Ca0.84 (line of best fit is the solid black line; dashed black line corresponds to a scaling law exponent of 2/3, and dotted black line corresponds to an exponent of 1). In this regime, friction originates predominantly from viscous dissipation in the air layer under the drop. At the highest speeds (Ca > 10–4), aerodynamic resistance becomes important and FγwCa4/3 (dashed brown line; solid brown line shows best fit). The micropillar and black silicon inset are reprinted with permission under a Creative Commons License CC BY 4.0 from ref . Copyright 2024 Wiley. The Glaco inset is reprinted with permission under a Creative Commons License CC BY 3.0 from ref . Copyright 2024 by the Royal Society of Chemistry.
8
8
Lubricant reorganization when drops move on lubricated surfaces. (a) Schematic of a drop moving on a LIS with micropillars. The vertical cross section drawn is taken in a slice cutting between two rows of pillars (hence the pillars are not visible in a and b). (b) Shape of the rear (left column) and front (right column) wetting ridge when a water drop moves at different speeds, imaged using an adapted laser scanning confocal microscope setup. The lubricant is 500 cSt silicone oil. The drop is not shown because fluorescent dye was only added to the lubricant. Reproduced with permission under a Creative Commons License CC BY 4.0 from ref . Copyright 2024 The Authors. (c–e) Interference patterns obtained when imaging the lubricant film under the drop from below using white-light interferometry. (c) On a hydrophobic flat surface, a lubricant forms under the drop (1 μL); the thickness of the film is given by LLD law. (d) A lubricant film also forms on short pillars (height 2 μm) because the film thickness predicted by LLD law exceeds the pillar height. (e) On tall pillars (9 μm), the LLD height is less than the pillar height and there is no dynamic lubricant film above the pillars, apart from a submicrometer film that remains due to a thermodynamically stable wetting state. (f) The height of the lubricant film under the middle of the drop, measured from the base of the pillars to the drop-lubricant interface (as shown in the schematics of c–e), only increases with Ca (defined in terms of the lubricant viscosity) when the film thickness predicted by the LLD law exceeds the pillar height. These measurements were taken using white-light interferometry. The drop volume was 5–10 μL, the drop speed was 50–600 μm/s, and the lubricant was perfluorinated oil (30–60 cP). Panels c–f are adapted with permission from ref . Copyright 2017 SNCSC.
9
9
Relationship between friction force and capillary number on lubricated surfaces, where the lubricant viscosity is larger than the drop viscosity. The data are taken from refs , , , , and . On the y-axis, the friction force is normalized by the product of the drop-lubricant interfacial tension and the drop base width. In cases where the drop base width was not reported in the literature, we estimated it from the drop volume and assumed that the drop is approximately a hemisphere. In the bottom x-axis, Ca is defined in terms of the lubricant viscosity and the drop-lubricant interfacial tension. Throughout this figure, γ denotes the drop-lubricant interfacial tension. The drop velocity on the top x-axis is computed from Ca, assuming that the lubricant was 100 cSt silicone oil. Note that, since the data points include lubricants of various viscosities, the velocity on the top x-axis is not necessarily the true drop velocity but is merely a representative velocity to provide intuition for how fast the drop would move if the lubricant was 100 cSt. Below Ca < 0.005, the data points follow 2 parallel bands. The upper band (circle symbols) corresponds to the case when a Landau–Levich film forms underneath the drop whereas the lower band (square symbols) corresponds to the case where there is no film. For both these regimes, F/γwCa2/3 (dashed blue and back line). At Ca ≈ 10–2 these 2 bands begin to converge, and we obtain a scaling of F ∼ Ca0.39 above Ca > 10–1 (solid brown line). Solid lines correspond to unbiased fits whereas dashed lines correspond to fits where the gradient is imposed. The top left inset highlights regions where energy may be dissipated in the form of viscous dissipation. Bottom right insets: Heatmaps showing the distribution of viscous dissipation (mainly localized in regions 1,2,3). The term “heatmap” refers to the fact that viscous dissipation is accompanied by release of heat. The top image is a vertical cross section across the center of the drop. The bottom image is a horizontal stack of the dissipation across the entire 3D domain. The drop contour is shown in cyan and the lubricant contour is shown in yellow. The color bars represent the ratio of the dissipated power to the power input per unit volume to move the drop. The top left inset is adapted with permission from ref . Copyright 2020 by the American Physical Society. The bottom right insets are reprinted with permission under a Creative Commons License CC BY 4.0 from ref . Copyright 2024 The Authors.
10
10
Summary of the mechanisms that contribute to drop friction at different drop speeds on SHS and LIS. Depinning of capillary bridges at the receding side dominates at low speeds. On SHS, depinning can dominate up to speeds of several cm/s when the solid fraction is high (e.g., on micropillars). Viscous dissipation in the drop is typically not important for low-viscosity liquids such as water but it becomes important when the drop has high viscosity. As a guideline, the drop viscosity can be considered high when it is above ∼10 mPa s on SHS and above the lubricant viscosity on LIS. On superhydrophobic nanostructured surfaces with low pinning, the drop may lift off at speeds as low as ∼mm/s and air film may form between the drop and the solid textures. The critical speed at which the drop lifts off is higher for taller surface textures. Viscous dissipation in the plastron and air film leads to a velocity-dependent friction force. At speeds of the order of cm/s, aerodynamic drag becomes relevant. On LIS, friction is typically dominated by viscous dissipation in the wetting ridge and where the wetting ridge meets the lubricant film under the drop. On LIS, drops never reach high enough speeds for aerodynamic drag to become important. Current evidence suggests that the presence of a lubricant cloak layer around the drop does not affect the dominant dissipation mechanisms.
11
11
Collapse of the Cassie state on superhydrophobic surfaces. (a) 3D confocal microscopy image (water fluorescence in cyan, reflection from the drop-air interface in red) of the center of a water drop sitting on hydrophobized micropillars (yellow), showing the curvature of the interface. The vertical axis is scaled differently to the horizontal axis to highlight the curved drop-air interface. Adapted from ref . (b, c) Sagging mechanism. Confocal microscopy vertical slice through the deepest point of the drop-air interface (cyan). Laplace pressure increases as the drop evaporates and the interface eventually touches the substrate while the microscopic contact line remains pinned at the edges of the pillars. Adapted with permission from ref under a standard PNAS License. (d) Depinning mechanism. The microscopic contact line slides down the side of the pillars when the contact angle with respect to the vertical reaches the material’s contact angle. These metastable intermediate wetting states can last for several seconds. Adapted with permission from ref . Copyright 2007 by the SNCSC. (e) 3D confocal image of an intermediate wetting state. Adapted with permission from ref under a standard PNAS License. (f) Composite confocal and transmission images of an evaporating water drop sitting on micropillars. Just before the transition via the sagging mechanism, interference fringes are visible. When the air cushion vanishes, they disappear. Air bubbles get trapped around the micropillars, shrinking slowly as air diffuses into the water drop. The inset shows a vertical slice of bubbles (black) trapped on the side walls of pillars (yellow) under fluorescently labeled water, imaged with confocal microscopy. Adapted with permission from ref , under a standard PNAS License. (g) Reversibility of the Cassie state was experimentally confirmed on micropillars with high aspect ratio coated with hydrophobic nanoparticles. Here pressure is applied directly by squeezing the drop between two plates. Adapted from ref , PNAS Open Access. (h) Reflection interference from underneath a water drop sitting on a disordered structure of hydrophobic raspberry-like particles. Wenzel islands (dark patches) that grow with time may appear. Unpublished data. (i) On dual scale structures, featuring nanoprotrusions on top of micropillars, the Cassie-to-Wenzel transition may be reversible because a thin air cushion remains trapped, causing the drop to remain in a nano-Cassie state despite being in a micro-Wenzel state. Adapted from ref , PNAS Open Access.
12
12
Confocal microscopy images showing the collapse of the lubricated Cassie state on LIS. The lubricant (black) is silicone oil (10,000 cSt), the micropillars (yellow) have a height of 10 μm and width of 100 μm. The drop is water (5 μL, blue). Initially, the lubricant height is equal to the pillar height (perfectly filled). (a) On hydrophilic (untreated SU-8) pillars, the drop displaces the lubricant between the pillars and collapses to the Wenzel state within 159 s. (b) On hydrophobic (PDMS brush-coated) pillars, lubricant remains trapped between the pillars and the middle of the drop remains in a Cassie state even after 203 min. The images in (a) and (b) show a vertical confocal slice taken close to the middle of the drop. (c) Horizontal confocal slice taken at the top of the hydrophilic pillars shows that only a few isolated lubricant pockets remain (dark patches within the blue region) due to pinning after the drop has collapsed between the hydrophilic pillars. (d) Horizontal slice taken at the base of the hydrophobic pillars shows that a large pocket of lubricant remains trapped in the middle of the drop inside a Wenzel ring. The lubricant in this pocket remains trapped until the end of the measurement because it is blocked by the Wenzel ring. White boxes in (c) and (d) highlight regions used for vertical cross sections in (a) and (b), respectively. (e) Vertical slice of collapse dynamics at the edge of the drop on hydrophobic pillars. The snapshots show how the drop-lubricant sags to collapse to the Wenzel state at the drop edge. This collapse occurs around the circular drop contact perimeter, leading to the Wenzel ring shown in (d). Note that the aspect ratio of the images is not 1 in the vertical slices (a,b,e). In these panels, the vertical axis has been magnified to highlight the curvature of the drop-lubricant interface and the collapse. Adapted from ref , with permission from the author.

Similar articles

References

    1. de Gennes, P.-G. ; Brochard-Wyart, F. ; Quéré, D. . Capillarity and Wetting Phenomena, 1st ed.; Springer: New York, NY, 2004. 10.1007/978-0-387-21656-0. - DOI
    1. Bormashenko, E. Yu. Wetting of Real Surfaces; De Gruyter: Berlin, Boston, 2018. 10.1515/9783110583144. - DOI
    1. Butt, H.-J. ; Kappl, M. . Surface and Interfacial Forces, 2nd ed.; Wiley-VCH, 2018.
    1. Thorpe W. H.. Plastron Respiration in Aquatic Insects. Biol. Rev. 1950;25:344–390. doi: 10.1111/j.1469-185X.1950.tb01590.x. - DOI - PubMed
    1. Wagner T., Neinhuis C., Barthlott W.. Wettability and Contaminability of Insect Wings as a Function of Their Surface Sculptures. Acta Zool. 1996;77:213–225. doi: 10.1111/j.1463-6395.1996.tb01265.x. - DOI

LinkOut - more resources