

Multi-omics analyses reveal differences in intestinal flora composition and serum metabolites in Cherry Valley broiler ducks of different body weights
- PMID: 40367572
- PMCID: PMC12141840
- DOI: 10.1016/j.psj.2025.105275
Multi-omics analyses reveal differences in intestinal flora composition and serum metabolites in Cherry Valley broiler ducks of different body weights
Abstract
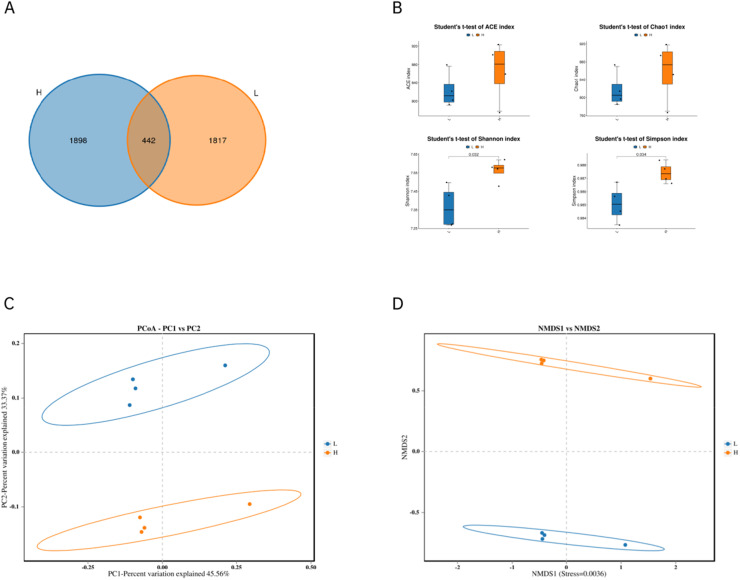
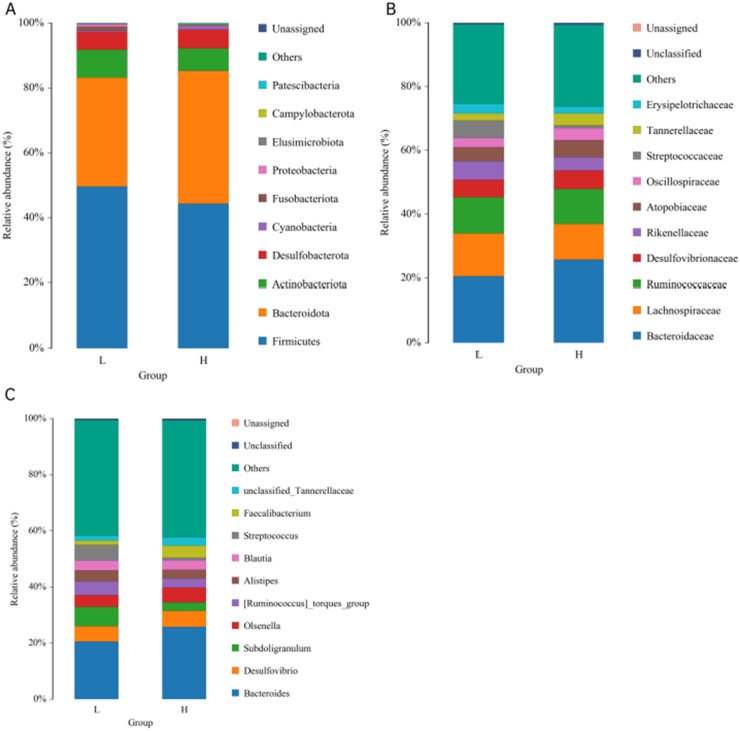
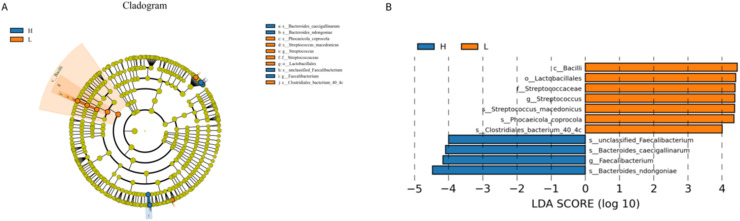
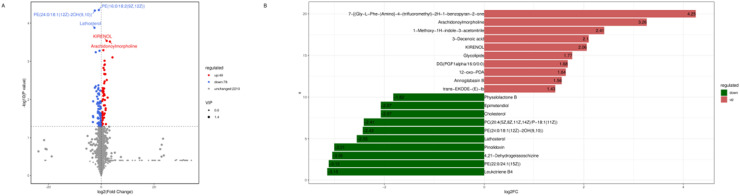
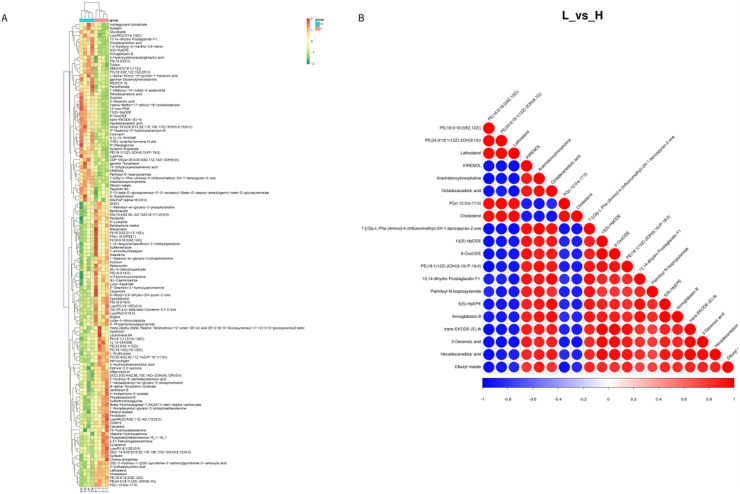
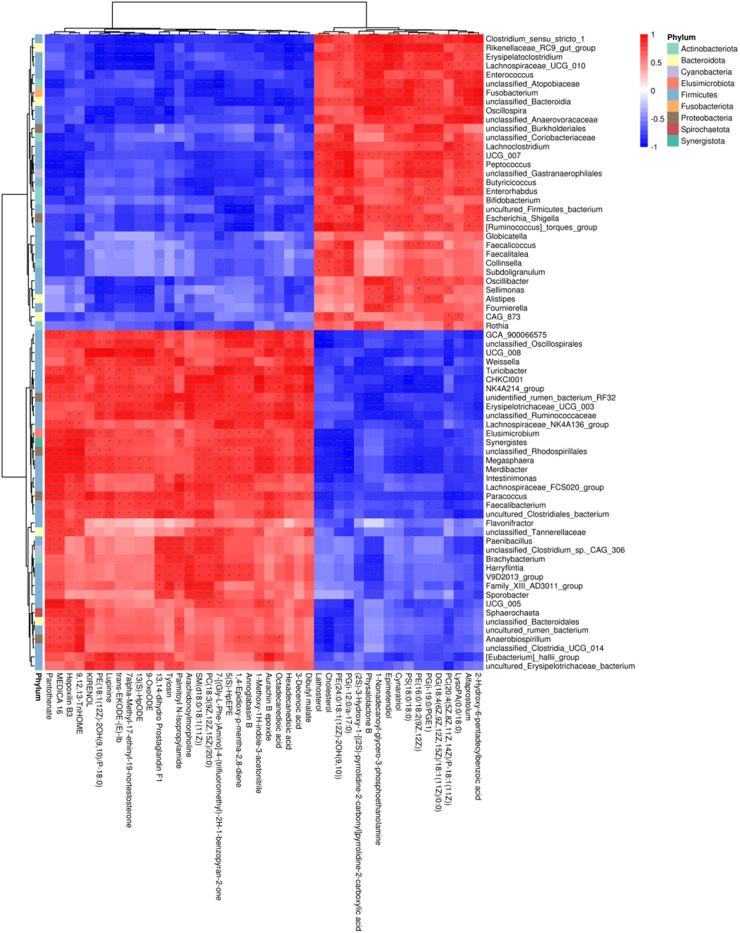
Fledgling broiler ducks vary in body weight and growth rate. The aim of this study was to investigate the relationship between serum metabolites and the intestinal microbiota in Cherry Valley broiler ducks with different finishing weights and to reveal differences in their metabolic regulation and microbial composition. Serum and cecum content samples were collected from Cherry Valley broiler ducks of different finishing weights. Metabolites were identified and compared using untargeted metabolomics, 16S rRNA gene sequencing, multivariate statistics and bioinformatics. Six key findings emerged. First, serum biochemical parameters showed that AST and ALT levels were significantly lower in the high weight group (Group H) than in the low weight group (Group L), and serum immunoglobulin IgG levels were significantly higher in group H. Second, the chorionic height to crypt depth ratio of the duodenum was significantly higher in group H than in group L. Third, the gut microbial community diversity or abundance was lower in broiler ducks in group L. Fourth, LEfSe analysis showed that the biomarker for group L was Streptococcus, whereas for group H it was Faecalibacterium. Fifth, a total of 127 differential metabolites were identified (49 up-regulated and 78 down-regulated). Finally, Spearman's correlation analysis showed that Spearman's correlation analyses showed that the Lipid-related serum metabolites were higher in low-body recombinant broiler ducks, mainly Lathosterol, Cholesterol, Cynaratriol and Leukotriene B4. In addition to lipid-associated serum metabolites in high-body recombination, The water-soluble vitamin-like metabolite Pantothenate and the antibiotic-like metabolite Tylosin were high. The cecum microbiota is strongly associated with metabolites, especially Faecalibacterium, unclassified Tannerellaceae, Subdoligranulum, Alistipes, and [Ruminococcus] torques_group, with which it exhibits strong Correlation. Broiler ducks with higher body weights have a better intestinal villous structure, enhanced digestion and absorption, higher levels of immunoglobulin secretion and superior growth performance. Broiler ducks with different body weights differed in plasma metabolites and cecum flora. Spearman's correlation analyses showed that the Correlation between differential metabolites and differential gut microbial genera.
Keywords: Cherry Valley broiler duck; Intestinal microbiota; Serum metabolites; Weight.
Copyright © 2025. Published by Elsevier Inc.
Conflict of interest statement
Declaration of competing interest The authors declare that they have no known competing financial interests or personal relationships that could have appeared to influence the work reported in this paper.
Figures


References
-
- Aden K., Rehman A., Waschina S., Pan W.H., Walker A., Lucio M., Nunez A.M., Bharti R., Zimmerman J., Bethge J., Schulte B., Schulte D., Franke A., Nikolaus S., Schroeder J.O., Vandeputte D., Raes J., Szymczak S., Waetzig G.H., Zeuner R., Schmitt-Kopplin P., Kaleta C., Schreiber S., Rosenstiel P. Metabolic functions of gut microbes associate with efficacy of tumor necrosis factor antagonists in patients with inflammatory bowel diseases. Gastroenterology. 2019;157(5) doi: 10.1053/j.gastro.2019.07.025. 1279-92.e11. - DOI - PubMed
-
- Alagawany M., El-Saadony M.T., Elnesr S.S., Faraha M., Attia G., Madkour M., Reda F.M. Use of lemongrass essential oil as a feed additive in quail's nutrition: its effect on growth, carcass, blood biochemistry, antioxidant and immunological indices. Digestive enzymes and intestinal microbiota. Poult. Sci. 2021;100(6) doi: 10.1016/j.psj.2021.101172. - DOI - PMC - PubMed
-
- Alharbi N., McBride M.W., Graham D., Padmanabhan S. Metabolomic study of pathways underlying hexadecanedioate-induced blood pressure elevation. J. Hypertens. 2016;34:155. doi: 10.1097/01.hjh.0000491759.44896.eb. - DOI
MeSH terms
Substances
LinkOut - more resources
Full Text Sources
Medical
