

Age-related changes in myelin and myelin water quantified with short-TR adiabatic inversion-recovery (STAIR) sequences
- PMID: 40367604
- PMCID: PMC12140967
- DOI: 10.1016/j.nicl.2025.103801
Age-related changes in myelin and myelin water quantified with short-TR adiabatic inversion-recovery (STAIR) sequences
Abstract
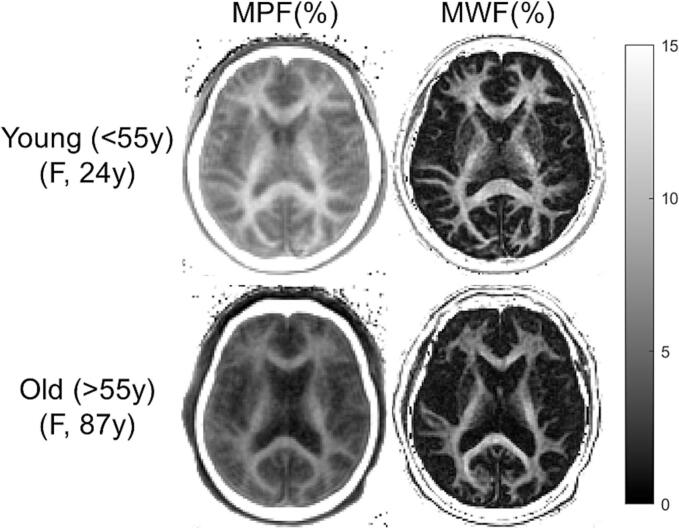
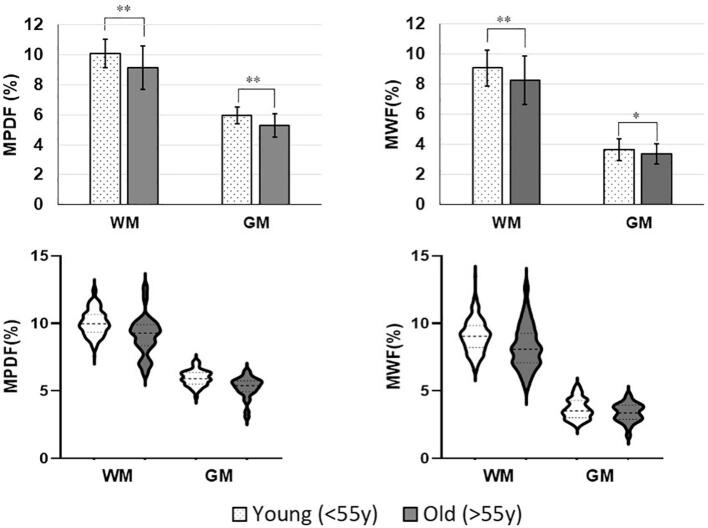
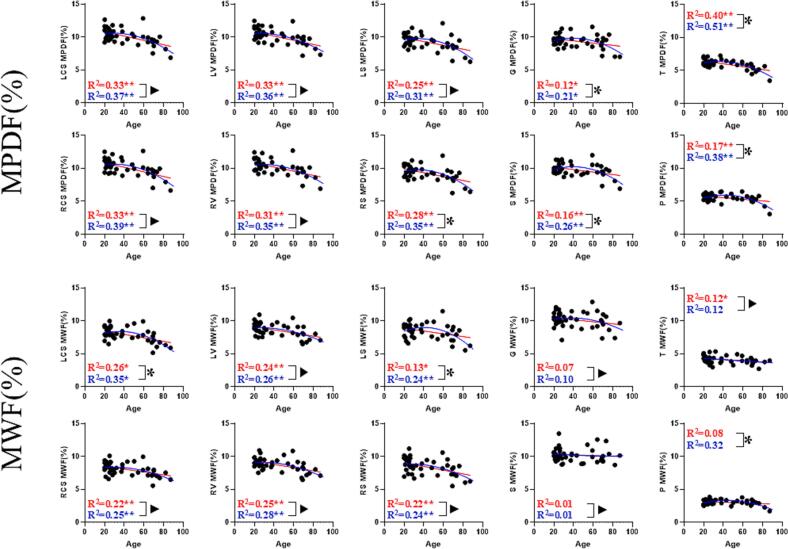
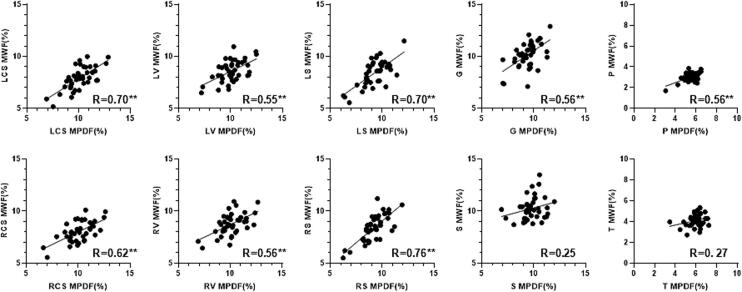
Myelin proton density fraction (MPDF) and myelin water fraction (MWF) measured with short-TR adiabatic inversion-recovery (STAIR) sequences are potential biomarkers of aging and neurodegeneration, but the effects of aging on MPDF/MWF remain unknown. This study aims to assess relationships between age and MPDF/MWF using the 3D STAIR ultrashort echo time (STAIR-UTE) and STAIR short echo time (STAIR-STE) sequences, respectively. 42 volunteers (29 young (<55y), 13 old (>55y)), were recruited for MPDF and MWF mapping for white matter (WM) and gray matter (GM) on a 3 T scanner. Excellent inter-reader reliability was demonstrated for MPDF and MWF measurements with ICC values of 0.97 and 0.98, respectively, between two readers. In the young group, WM MPDF and MWF range from 8-13 % and 6-13 %, respectively, while GM MPDF and MWF range from 5-7 % and 3-5 %, respectively. In the old group, WM MPDF and MWF range from 6-12 % and 5-13 %, and GM MPDF and MWF range from 3-6 % and 2-5 %, respectively. The young group's MPDF/MWF values were significantly higher than those of the old group. Altogether, the 42 volunteers display linear and quadratic associations of MPDF/MWF with age. MPDF demonstrated significant correlations with MWF in the majority of brain regions. This study demonstrates the capability of two myelin imaging biomarkers, STAIR-UTE measured MPDF and STAIR-STE measured MWF to map brain myelin and MW. These biomarkers hold the potential to differentiate normal aging from neuroinflammatory/neurodegenerative diseases.
Keywords: Aging; Biomarker; Brain; Myelin content; Myelin water.
Copyright © 2025 The Authors. Published by Elsevier Inc. All rights reserved.
Conflict of interest statement
Declaration of competing interest The authors declare that they have no known competing financial interests or personal relationships that could have appeared to influence the work reported in this paper.
Figures
References
-
- Alonso-Ortiz E., Levesque I.R., Pike G.B. MRI-based myelin water imaging: a technical review: MRI-Based Myelin Water Imaging. Magn. Reson. Med.. 2015;73(1):70–81. 10.1002/mrm.25198. - PubMed
-
- Alonso-Ortiz E., Levesque I.R., Pike G.B. MRI-based myelin water imaging: A technical review. Magn. Reson. Med.. 2015;73(1):70–81. 10/gf34d2. - PubMed
-
- Alsop D.C., Ercan E., Girard O.M., et al. Inhomogeneous magnetization transfer imaging: Concepts and directions for further development. NMR Biomed.. 2023;36(6):e4808. - PubMed
MeSH terms
Grants and funding
LinkOut - more resources
Full Text Sources
Medical
Research Materials
