. 2025 May 14;16(1):4470.
doi: 10.1038/s41467-025-59249-5.

Intermittent fasting reduces alpha-synuclein pathology and functional decline in a mouse model of Parkinson's disease

Affiliations

Intermittent fasting reduces alpha-synuclein pathology and functional decline in a mouse model of Parkinson's disease

Éva M Szegő et al. Nat Commun. .

Abstract

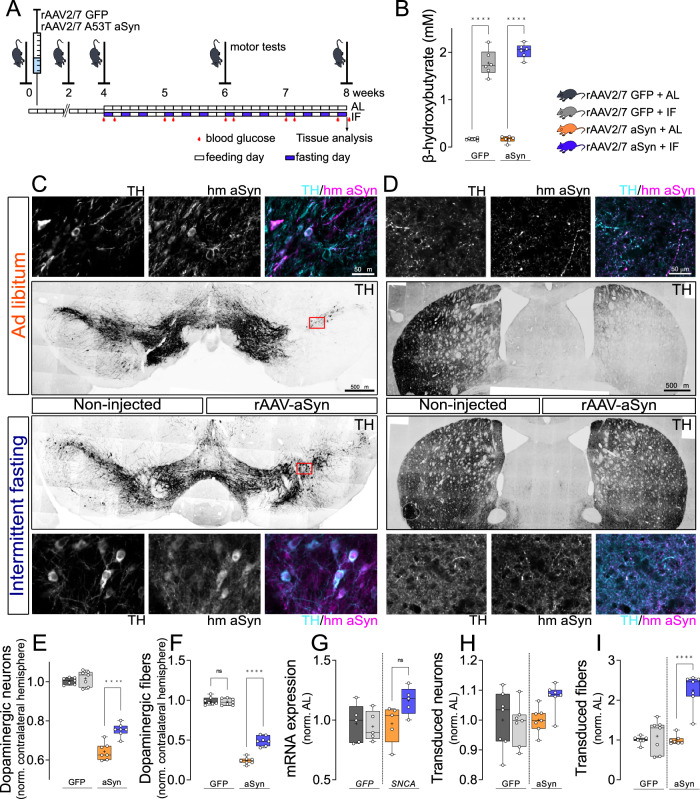
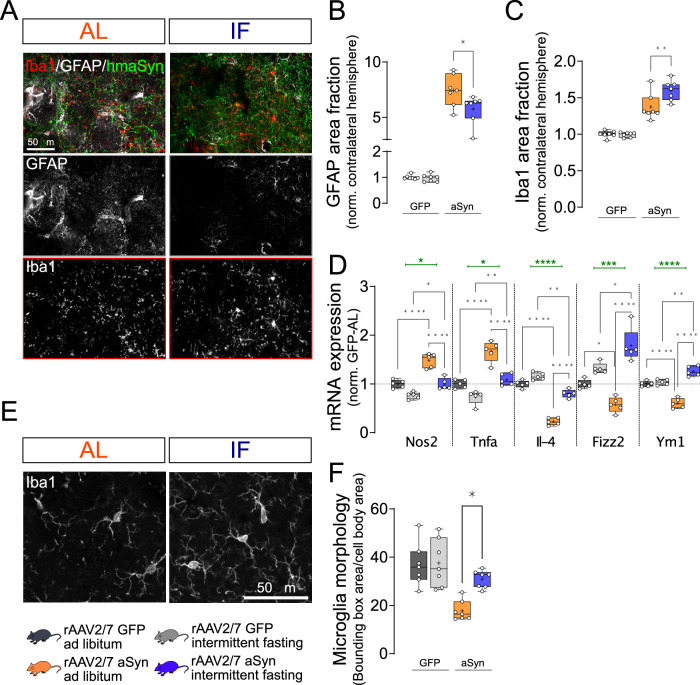
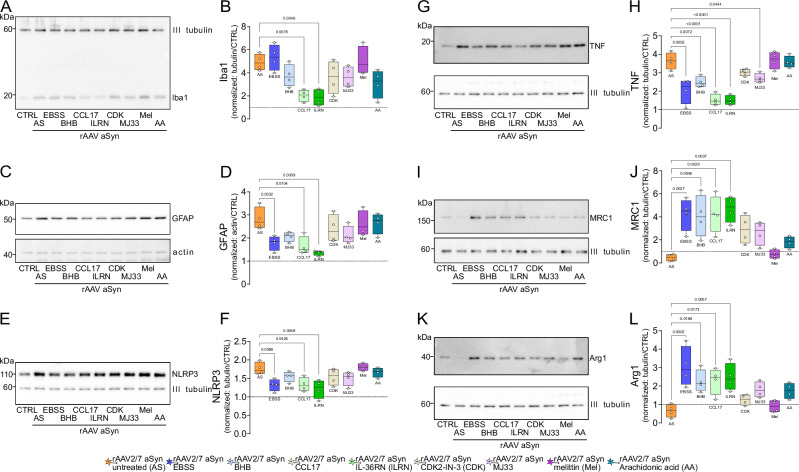
Parkinson's disease (PD) is a neurodegenerative disorder characterized by dopaminergic neuron degeneration and α-synuclein (aSyn) accumulation. Environmental factors play a significant role in PD progression, highlighting the potential of non-pharmacological interventions. This study investigates the therapeutic effects of intermittent fasting (IF) in an rAAV-aSyn mouse model of PD. IF, initiated four weeks post-induction of aSyn pathology, improved motor function and reduced dopaminergic neuron and axon terminal degeneration. Additionally, IF preserved dopamine levels and synaptic integrity in the striatum. Mechanistically, IF enhanced autophagic activity, promoting phosphorylated-aSyn clearance and reducing its accumulation in insoluble brain fractions. Transcriptome analysis revealed IF-induced modulation of inflammation-related genes and microglial activation. Validation in primary cultures confirmed that autophagy activation and inflammatory modulators (CCL17, IL-36RN) mitigate aSyn pathology. These findings suggest that IF exerts neuroprotective effects, supporting further exploration of IF and IF-mimicking therapies as potential PD treatments.


Conflict of interest statement

Competing interests: The authors declare no competing interests.

Figures

Fig. 1
Fig. 1. Intermittent fasting reduces aSyn-induced degeneration of dopaminergic neurons.
A Experimental scheme. B Serum levels of BHB (mM). n = 6, two-way ANOVA, Tukey post-hoc test. ****: p < 0.0001. C Representative images of midbrain sections. Upper images: rAAV-aSyn–AL, lower images: rAAV-aSyn–IF. Overview: TH staining (gray). Scale bar: 500 µm. Insets: TH and human aSyn (hm aSyn) staining (gray), or both (TH: cyan, hm aSyn: magenta) of the indicated areas. Scale bar: 50 µm. D Representative images of striatal sections. Upper images: rAAV-aSyn–AL, lower images: rAAV-aSyn–IF. Overview: TH staining (gray) of both hemispheres. Scale bar: 500 µm. Insets: TH and human aSyn (hm aSyn) staining (gray), or both as overlay (TH: cyan, hm aSyn: magenta). Scale bar: 50 µm. E Normalized number of TH-positive neurons in the SN. Numbers were normalized to the non-injected hemisphere of the same animal. Box and whisker plots, middle line: median, +: mean, circles: individual animals; n = 7, two-way ANOVA, Tukey post-hoc test, p < 0.0001. TH neuron numbers are on Supplementary Fig. 1D. F Density of TH-positive fibers in the STR, normalized to the (i) contralateral hemisphere and (ii) to the rAAV-GFP–AL group. Box and whisker plots (see “methods”), middle line: median, +: mean, circles: individual animals; n = 7, two-way ANOVA, Tukey post-hoc test, p < 0,0001). Fiber densities are on Supplementary Fig. 1E. G Expression of GFP and hmSNCA in the SN. Box and whisker plots, middle line: median, +: mean, circles: individual animals; n = 5, two-way ANOVA, Tukey post-hoc test. H Normalized number of GFP- or human aSyn-positive neurons in the SN. Numbers were normalized to the (i) non-injected hemisphere of the same animal and (ii) AL. Box and whisker plots, middle line: median, +: mean, circles: individual animals; n = 7, two-way ANOVA, Tukey post-hoc test, p < 0.0001. I Density of GFP- or hmaSyn-positive fibers in the STR, normalized to the (i) contralateral hemisphere and (ii) to rAAV-GFP–AL. Box and whisker plots, middle line: median, +: mean, circles: individual animals; n = 7, two-way ANOVA, Tukey post-hoc test, p < 0.0001). Box and whiskers plots: box: 25th to 75th percentiles, whiskers: from the smallest to the largest value. Source data are provided as a Source Data file.
Fig. 2
Fig. 2. Intermittent fasting improves aSyn-induced motor impairment and reduces striatal synapse loss.
A Dopamine content (ng/mg wet tissue) in striatal lysates. Graph shows box and whisker plots, middle line: median, +: mean, circles: individual animals; n = 5, two-way ANOVA, Tukey post-hoc test, p = 0.023. B Quantification of the unilateral motor deficits (asymmetry in forelimb use) using the cylinder test. Mice were tested before and 2, 4, 6, and 8 weeks after the vector injection. Mean ± SD, circles: individual animals; n = 7, repeated measures ANOVA, Tukey post-hoc test; *: p = 0.012; **: p = 0.0022; +: p = 0,0242. Graph showing the time until the first 25 paw contacts is on Supplementary Fig. 3A. C Quantification of the motor coordination using the rod test. Mice were tested before and 2, 4, 6, and 8 weeks after the vector injection. Mean ± SD, circles: individual animals; n = 7, repeated measures ANOVA, Tukey post-hoc test; *: p = 0.0232; ***: p = 0.0008; +++: p = 0.0006; +: p = 0.018. D Representative images of striatal sections from rAAV-aSyn-injected mice stained for the presynaptic marker synapsin (magenta in overlay images), for the postsynaptic marker PSD95 (green) and TH (cyan). Scale bar: 10 μm. E Quantification of area fraction positive for the presynaptic marker synapsin in the STR. Numbers were normalized (i) to the contralateral hemisphere of the same animal and to the (ii) rAAV-GFP-AL group. Graph shows box and whisker plots, middle line: median, +: mean, circles: individual animals; n = 7, two-way ANOVA, Tukey post-hoc test, p < 0.0001. Graph showing area fractions from both hemispheres are on Supplementary Fig. 3B. F Quantification of the area fraction positive for the postsynaptic marker PSD95 in the STR. Numbers were normalized (i) to the contralateral hemisphere of the same animal and to the (ii) rAAV-GFP—AL group. Graph shows box and whisker plots, middle line: median, +: mean, circles: individual animals; n = 7, two-way ANOVA, Tukey post-hoc test, p < 0.0077. Graph showing area fractions from both hemispheres are on Figure supplement 3C. Box and whiskers plots: box: 25th to 75th percentiles, whiskers: from the smallest to the largest value. Source data are provided as a Source Data file.
Fig. 3
Fig. 3. Intermittent fasting induces autophagy, autophagosome maturation and increased colocalization of LC3 and phospho-aSyn in the SN.
A Representative images of SN sections stained for phospho-aSyn (white). tfl-LC3 construct is visualized in green (EGPF) and red (RFP) (top images), or only in red (bottom). Small images (left and right): individual channels. Green arrowheads: neutral LC3-positive vesicles; red arrowheads: acidic LC3-positive vesicles; open blue arrowheads: free phospho-aSyn particles outside of autophagosomes; blue arrowheads: phospho-aSyn-positive particles within LC3-positive vesicles. Scale bar: 20 μm. Lower magnification images: Supplementary Fig. 5C. B Area fraction positive for LAMP1 within TH-positive neurons in the SN. Numbers were normalized to rAAV-GFP–AL. Box and whisker plots, middle line: median, +: mean, circles: individual animals; n = 7, two-way ANOVA, Tukey post-hoc test, *: p = 0.042; **: p = 0.0069. C Area fraction positive for LC3 signal (red channel) within phospho-aSyn-positive neurons. Numbers were normalized to rAAV-aSyn–AL. Box and whisker plots, middle line: median, +: mean, circles: individual animals; n = 5, two-sided t-test, p < 0.0001. Area fractions of LC3 signal in the SN are on Figure supplement 5A. D Average number of total, neutral and acidic LC3-positive vesicles within phospho-aSyn-positive neurons. Box and whisker plots, middle line: median, +: mean, circles: individual animals; n = 5, two-sided t-test, ****: p < 0.0001. E Average number of phospho-aSyn-positive particles within neutral or acidic LC3-positive vesicles, or outside. Box and whisker plots, middle line: median, +: mean, circles: individual animals; n = 5, two-sided t-test, ****: p < 0.0001; **: p = 0.0017. Average vesicle numbers in different positions (shrink analysis) are on Supplementary Fig. 5C, D). F Expression of autophagy-related genes in the SN. Box and whisker plots, middle line: median, +: mean, circles: individual animals; n = 5, two-way ANOVA, Tukey post-hoc test (Igf1: ****: p < 0.0001; **: p = 0.0073) (Irs1: *: p = 0.032; **: p = 0.0065) (Mtor: *: p = 0.039). G Expression of lysosome-related genes in the SN. Box and whisker plots, middle line: median, +: mean, circles: individual animals; n = 5, two-way ANOVA, Tukey post-hoc test (Lamp1: ****: p < 0.0001; *: p = 0.029; interaction: *: p = 0.013) (Mcoln1: **: p = 0.0017). Green line and * represent interaction between the treatments (vector and diet). Box and whiskers plots: box: 25th to 75th percentiles, whiskers: from the smallest to the largest value. Source data are provided as a Source Data file.
Fig. 4
Fig. 4. Intermittent fasting reduces alpha-synuclein pathology.
A Representative, high magnification images of the SN from animals, stained for TH (red on overlay images), phospho-aSyn (green) and human aSyn (blue). Scale bar: 50 µm. B Representative, high magnification images of the STR from animals, stained for TH (red on overlay images), phospho-aSyn (green) and human aSyn (blue). Scale bar: 50 µm. C Normalized number of phopspho-aSyn-positive neurons in the SN. Numbers were normalized to the rAAV-aSyn–AL group. Box and whisker plots, middle line: median, +: mean, circles: individual animals; n = 7, two-sided t-test. D Ratio of phospho-aSyn-positive neurons within human aSyn-positive neurons in the SN. Numbers were normalized to the rAAV-aSyn–AL group. Box and whisker plots, middle line: median, +: mean, circles: individual animals; n = 7, two-sided t-test, p = 0.0282. E Normalized density of phospho-aSyn-positive fibers in the STR. Numbers were normalized to the rAAV-aSyn–AL group. Box and whisker plots, median: middle line; mean: +, circles: individual animals; n = 7, two-sided t-test, p = 0.0006. F Ratio of phospho-aSyn-positive fibers within human aSyn-positive fibers in the STR. Numbers were normalized to the rAAV-aSyn–AL group. Box and whisker plots, middle line: median, +: mean, circles: individual animals; n = 7, two-sided t-test, p = 0.0076. G Representative immunoblots of the Triton X-100 soluble fraction showing rodent aSyn and βIII tubulin (upper panel), and human aSyn (lower panel) signal. H Representative immunoblots of the Triton X-100 insoluble fraction showing human aSyn and βIII tubulin (upper panel), and rodent aSyn (lower panel) signal. I Ratio of the human αSyn signal in the Triton X-100 insoluble and Triton X-100 soluble fractions. Numbers were normalized to the rAAV-aSyn–AL group. Box and whisker plots, middle line: median, +: mean, circles: individual animals; n = 5, two-sided t-test, p = 0.0359. J Ratio of the endogenous αSyn signal in the Triton X-100 insoluble and Triton X-100 soluble fractions. Numbers were normalized to the rAAV-aSyn–AL group. Box and whisker plots, middle line: median, +: mean, circles: individual animals; n = 5, two-sided t-test, p = 0.0148. Box and whiskers plots: box: 25th to 75th percentiles, whiskers: from the smallest to the largest value. Source data are provided as a Source Data file.
Fig. 5
Fig. 5. Intermittent fasting reduces aSyn-induced astroglia activation and shifts microglia polarization.
A Representative images of ipsilateral striatal sections stained for GFAP (white in overlay images), Iba1 (red) and human aSyn (green). Scale bar: 50 μm. B Area fraction positive for GFAP signal, normalized to the (i) contralateral hemisphere of the same animal and to the (ii) rAAV-GFP–AL group. Box and whisker plots, middle line: median, +: mean, circles: individual animals; n = 7, two-way ANOVA, Tukey post-hoc test, p = 0.019. Area fractions from both hemispheres are on Supplementary Fig. 4A. C Area fraction positive for Iba1 signal, normalized to the (i) contralateral hemisphere of the same animal and to the (ii) rAAV-GFP–AL group. Box and whisker plots, middle line: median, +: mean, circles: individual animals; n = 7, two-way ANOVA, Tukey post-hoc test, p = 0.0075. Area fractions from both hemispheres are on Supplementary Fig. 4B. D Expression of Nos2, Tnfa, Il-4, Fizz2, and Ym1 in the STR. Box and whisker plots, middle line: median, +: mean, circles: individual animals; n = 5, two-way ANOVA, Tukey post-hoc test (Nos2: ****: p < 0.0001; ++++: p < 0.0001; *: p = 0.0354; +: p = 0.0403) (Tnfa: ****: p < 0.0001; ++++: p < 0.0001; **: p = 0.00079; +: p = 0.0381) (Il-4: ****: p < 0.0001; ++++: p < 0.0001; **: p = 0.0044; ++++: p < 0.0001) (Fizz2: *: p = 0.012; ++++: p < 0.0001; +: p = 0.0232; ***: p = 0.00075) (Ym1: ****: p < 0.0001; ++++: p < 0.0001; **: p = 0.0085; ++++: p < 0.0001). Green line and * represent interaction between the treatments (vector and diet). E Representative images with larger magnification of microglia identified by staining for Iba1. Scale bar: 50 μm. Morphology of Iba1-positive cells was analyzed by comparing the ratio of the bounding box area to the area of the cell body (Supplementary Fig. 5C). F Quantification of “microglia morphology” (expressed as the ratio of the bounding box area and cell body area). Box and whisker plots, middle line: median, +: mean, circles: individual animals (minimum 50 cells per animal analyzed); n = 7, two-way ANOVA, Tukey post-hoc test. p = 0.0117. Box and whiskers plots: box: 25th to 75th percentiles, whiskers: from the smallest to the largest value. Source data are provided as a Source Data file.
Fig. 6
Fig. 6. Intermittent fasting reduces aSyn-induced neurodegeneration in aged mice.
A Representative images of midbrain sections from aged animals, stained for TH. Scale bar: 500 μm. B Normalized number of TH-positive neurons in the SN. Numbers were normalized to the (i) contralateral hemisphere and (ii) to the PBS–AL group. Box and whisker plots, middle line: median, +: mean, circles: individual animals; n = 4 for PBS and n = 5 for rAAV2/7-aSyn, two-way ANOVA, Tukey post-hoc test, p = 0.0134. C Representative images of the SN from aged animals unilaterally injected with rAAV2/7-aSyn vector, stained for TH (magenta pseudo color on overlay images) and phospho-aSyn (green). Scale bar: 50 µm. D Intensity of paSyn signal within human-aSyn-positive neurons, normalized to the rAAV-aSyn–AL group. Box and whisker plots, middle line: median, +: mean, circles: individual animals; n = 5, two-sided t-test, p = 0.003. E Representative images of striatal sections from aged animals, stained for TH. Scale bar: 20 μm. F Density of TH-positive fibers in the STR, normalized to the (i) contralateral hemisphere and (ii) to the PBS–AL group. Box and whisker plots, middle line: median, +: mean, circles: individual animals; n = 4 for PBS and n = 5 for rAAV2/7-aSyn, two-way ANOVA, Tukey post-hoc test, p = 0.0004). G Representative images showing Iba1 staining in the striatum of aged animals. Scale bar: 20 μm. H Area fraction positive for Iba1 signal, normalized to the (i) contralateral hemisphere of the same animal and to the (ii) PBS–AL group. Box and whisker plots, middle line: median, +: mean, circles: individual animals; n = 4 for PBS and n = 5 for rAAV2/7-aSyn, two-way ANOVA, Tukey post-hoc test. Data for GFAP is shown as Supplement to Fig. 6. Box and whiskers plots: box: 25th to 75th percentiles, whiskers: from the smallest to the largest value. Source data are provided as a Source Data file.
Fig. 7
Fig. 7. Intermittent fasting induces profound transcriptome changes in the ventral midbrain of mice injected with rAAV-aSyn.
Bulk RNA sequencing was performed from the ventral midbrain of mice transduced with rAAV-GFP or rAAV-aSyn, and subjected to diet control. A Heatmap shows differentially expressed genes between aSyn-AL and aSyn-IF groups. Z-scores of genes of individual mice are used to generate the heatmap, note: only every 15th gene is labeled with names. B Volcano plot shows genes detected in aSyn-AL and aSyn-IF. Blue: down-regulated DEGs, red: up-regulated DEGs. For the graph, log2 fold change (log2FC) and log10 p-values were used. Genes are considered as DEG, when the log2FC > 0.5 or log2FC < −0.5, and log10(p) > 1.3 (p < 0.05). Genes selected for further validation are highlighted in (A, B). two-sided t-test, p < 0.05. C Gene Ontology (GO) analysis of DEGs. Genes, selected as in (B), were significantly regulated both in aSyn-AL vs. GFP-AL and aSyn-AL vs. aSyn-IF. Fisher’s exact test was used to compute the p-values and enrichment factors for each ontology category. Source data are provided as a Source Data file.
Fig. 8
Fig. 8. CCL17 and IL-36 inhibition reduces neuroinflammation in vitro.
A Representative immunoblot showing βIII tubulin and Iba1 signal. B Ratio of the Iba1 and βIII tubulin signals, normalized to rAAV-GFP (CTRL). Box and whisker plots, middle line: median, +: mean, circles: individual preparations; n = 4, one-way ANOVA, Tukey post-hoc test. p-values are shown on the graph. C Representative immunoblots showing GFAP (upper panel) and βactin (lower panel) signals in primary cultures. D Ratio of the GFAP and βactin signals. Numbers were normalized to rAAV-GFP (CTRL). Box and whisker plots, middle line: median, +: mean, circles: individual preparations; n = 4, one-way ANOVA, Tukey post-hoc test. p-values are shown on the graph. E Representative immunoblot showing NLRP3 and βIII tubulin signals. F Ratio of the NLRP3 and βIII tubulin signals, normalized to rAAV-GFP (CTRL). Box and whisker plots, middle line: median, +: mean, circles: individual preparations; n = 4, one-way ANOVA, Tukey post-hoc test. p-values are shown on the graph. G Representative immunoblots showing TNFα (upper panel) and βIII tubulin (lower panel) signals. H Ratio of the TNFα and βIII tubulin signals, normalized to rAAV-GFP (CTRL). Box and whisker plots, middle line: median, +: mean, circles: individual preparations; n = 4, one-way ANOVA, Tukey post-hoc test. p-values are shown on the graph. I Representative immunoblots showing MRC1 (upper panel) and βIII tubulin (lower panel) signals. J Ratio of the MRC1 and βIII tubulin signals, normalized to rAAV-GFP (CTRL). Box and whisker plots, middle line: median, +: mean, circles: individual preparations; n = 4, one-way ANOVA, Tukey post-hoc test. p-values are shown on the graph. K Representative immunoblots showing Arg1 (upper panel) and βIII tubulin (lower panel) signals. L Ratio of the Arg1 and βIII tubulin signals, normalized to rAAV-GFP (CTRL). Box and whisker plots, middle line: median, +: mean, circles: individual preparations; n = 4, one-way ANOVA, Tukey post-hoc test. p-values are shown on the graph. Whole membranes are shown on Figure supplement for Fig. 7. Box and whiskers plots: box: 25th to 75th percentiles, whiskers: from the smallest to the largest value. Source data are provided as a Source Data file.
Fig. 9
Fig. 9. Reduced aSyn pathology in cultures with reduced inflammation.
A Representative, high magnification images of primary neuronal cultures transduced with rAAV-aSyn and treated as indicated on the left side. Cultures were stained for human aSyn, MAP2 (magenta in overlay images), and phospho-aSyn (cyan in overlay images). Scale bar: 10 μm. B Area fraction of hmaSyn signal within MAP2-positive neurons, normalized to rAAV-aSyn control cultures. Box and whisker plots, middle line: median, +: mean, circles: individual preparations; n = 5, one-way ANOVA, Tukey post-hoc test. C Mean fluorescence intensity of paSyn signal within MAP2-positive neurons, normalized to rAAV-aSyn control cultures. Box and whisker plots, middle line: median, +: mean, circles: individual preparations; n = 5, one-way ANOVA, Tukey post-hoc test. p-values are shown on the graph. D Representative immunoblots showing LC3-I and LC3-II (upper panel) and βactin (lower panel) signals. E Ratio of the LC3-II (lipidated LC3, lower band) and βactin signals, normalized to rAAV-GFP (CTRL). Box and whisker plots, middle line: median, +: mean, circles: individual preparations; n = 4, one-way ANOVA, Tukey post-hoc test. p-values are shown on the graph. F Representative immunoblots showing SQSTM1/p62 (upper panel), βactin (upper band, lower panel) and aSyn (lower band, lower panel) signals. G Ratio of p62 and βactin signals, normalized to rAAV-GFP (CTRL). Box and whisker plots, middle line: median, +: mean, circles: individual preparations; n = 4, one-way ANOVA, Tukey post-hoc test. p-values are shown on the graph. H Representative immunoblots showing “total” aSyn (both human and rodent asyn) upper panel) and βIII tubulin (lower panel) signals in the Triton X-100 insoluble fraction. I Ratio of aSyn and βIII tubulin signals, normalized to the rAAV-aSyn untreated (rAAV aSyn CTRL) cultures. Box and whisker plots, middle line: median, circles: independent experiments/preparations; n = 4, one-way ANOVA followed by Tukey post-hoc test. p-values are indicated on the graph. Whole membranes are shown on Figure supplement 8. Box and whiskers plots: box: 25th to 75th percentiles, whiskers: from the smallest to the largest value. Source data are provided as a Source Data file.
Fig. 10
Fig. 10. Anti-inflammatory treatment ameliorates aSyn toxicity in vitro.
A Representative images of primary neuronal cultures transduced with rAAV-aSyn and treated as indicated on the top. Cultures were stained against MAP2, GFAP, human aSyn and p129S-aSyn. Scale bar: 20 µm. B LDH release in cultures treated as indicated and normalized to the positive (cultures treated with 1% Triton X-100) and negative (empty medium) controls, and for rAAV-GFP. Box and whisker plots, middle line: median, circles: independent experiments/preparations; n = 5, one-way ANOVA followed by Tukey post-hoc test. p-values are indicated on the graph. C Quantification of the area fraction positive for the MAP2-staining in rAAV-aSyn-transduced primary cultures, normalized to rAAV-GFP. Box and whisker plots, middle line: median, circles: independent experiments/preparations; n = 5, one-way ANOVA followed by Tukey post-hoc test. p-values are indicated on the graph. D Quantification of the area fraction positive GFAP, normalized for rAAV-GFP. Box and whisker plots, middle line: median, circles: independent experiments/preparations; n = 5, one-way ANOVA followed by Tukey post-hoc test. p-values are indicated on the graph. Data including the rAAV-GFP treated cultures is included as Supplement to Fig. 10. Box and whiskers plots: box: 25th to 75th percentiles, whiskers: from the smallest to the largest value. Source data are provided as a Source Data file.

References

    1. Spillantini, M. G. et al. α-synuclein in Lewy bodies [8]. Nature388, 839–840 (1997). - PubMed
    1. Marotta, N. P. & Lee, V. M. Y. Modeling the cellular fate of alpha-synuclein aggregates: a pathway to pathology. Curr. Opin. Neurobiol.72, 171–177 (2022). - PMC - PubMed
    1. Hirsch, E. C. & Standaert, D. G. Ten unsolved questions about neuroinflammationnin Parkinson’s disease. Mov. Disord.36, 16–24 (2021). - PubMed
    1. Szegö, E. M. et al. Constitutively active STING causes neuroinflammation and degeneration of dopaminergic neurons in mice. Elife11, 81943 (2022a). - PMC - PubMed
    1. Panicker, N., Ge, P., Dawson, V. L. & Dawson, T. M. The cell biology of Parkinson’s disease. J. Cell Biol. 220, e202012095 (2021). - PMC - PubMed

MeSH terms