. 2025 May 14;16(1):4427.
doi: 10.1038/s41467-025-59058-w.

Differential regulation of fetal bone marrow and liver hematopoiesis by yolk-sac-derived myeloid cells

Affiliations

Differential regulation of fetal bone marrow and liver hematopoiesis by yolk-sac-derived myeloid cells

Benjamin Weinhaus et al. Nat Commun. .

Abstract

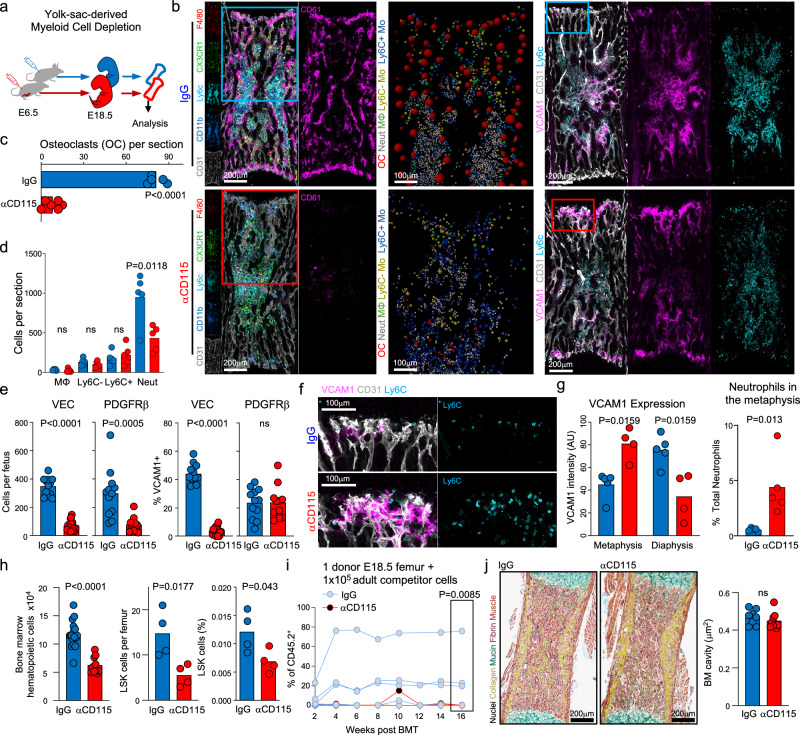
Fetal hematopoiesis takes place in the liver before colonizing the bone marrow where it will persist for life. This colonization is thought to be mediated by specification of a microenvironment that selectively recruits hematopoietic cells to the nascent bone marrow. The identity and mechanisms regulating the specification of this colonization niche are unclear. Here we identify a VCAM1+ sinusoidal colonization niche in the diaphysis that regulates neutrophil and hematopoietic stem cell colonization of the bone marrow. Using confocal microscopy, we find that colonizing hematopoietic stem and progenitor cells (HSPC) and myeloid cells selectively localize to a subset of VCAM1+ sinusoids in the center of the diaphysis. Vcam1 deletion in endothelial cells impairs hematopoietic colonization while depletion of yolk-sac-derived osteoclasts disrupts VCAM1+ expression, and impairs neutrophil and HSPC colonization to the bone marrow. Depletion of yolk-sac-derived myeloid cells increases fetal liver hematopoietic stem cell numbers, function and erythropoiesis independent of osteoclast activity. Thus, the yolk sac produces myeloid cells that have opposite roles in fetal hematopoiesis: while yolk-sac derived myeloid cells in the bone marrow promote hematopoietic colonization by specifying a VCAM1+ colonization niche, a different subset of yolk-sac-derived myeloid cells inhibits HSC in the fetal liver.


Conflict of interest statement

Competing interests: The authors declare no competing interests.

Figures

Fig. 1
Fig. 1. The E18.5 bone marrow grows by recruitment and is spatially organized by the distribution of myeloid cells.
a Representative images of twelve-week-old (adult, positive control) or E18.5 femur stained with the indicated markers. The right image shows a zoomed-in region showing extravasated Ter119+ erythroid cells and the location of Lin-CD117+ hematopoietic progenitors (blue spots for easier visualization). b Representative flow cytometry plots and quantifications showing a lack of CD11b+CD117+Ly6G+ immature neutrophils (IN) and increased CD11b+CD117-Ly6G+ mature neutrophils (MN) in the E18.5 bone marrow. Each dot shows the frequencies detected by pooling long bones (tibia, femur, humerus) from one litter. c Quantifications of granulocyte progenitors (GP), monocyte dendritic cell progenitors (MDP), monocyte progenitors (MOP), and common lymphoid progenitors (CLP) in the average E18.5 femur from one litter. d Cellular composition of the E18.5 femur; note the absence of erythroid cells. Each dot corresponds to one fetus. e Number of total hematopoietic cells and Lin-CD117+Sca1- (LK) and Lin-Sca1+CD117+ (LSK) HSPC in the femurs from E17.5 (n = 13) and E18.5 (n = 15) fetuses. Each dot corresponds to one femur from one fetus in 2 independent litters. f The left image shows a whole-mounted E18.5 femur from a Cx3cr1-gfp fetus stained with the indicated markers. The right image is a map of a representative 5 µm optical section from the image on the left where each indicated cell type has been replaced with a dot of the same diameter as the cell of interest. Osteoclasts (CD11bdim CD61+ Ly6C- F4/80- CX3CR1dim CD31-), macrophages (CD11bdim CD61- Ly6C- F4/80+ CX3CR1+ CD31-), Ly6C- monocytes (CD11b+ CD61- Ly6c- F4/80+/- CX3CR1+ CD31-), Ly6C+ monocytes (CD11b+ CD61- Ly6c+ F4/80+/- CX3CR1+ CD31-) and neutrophils (CD11b+ CD61- Ly6c+ F4/80- CX3CR1- CD31-). g The dot plot shows the Y position (along the anteroposterior axis of the bone, relative to the geometric center of each section) of all myeloid cell types found in three representative 5 µm thick optical sections of 4 femurs from 4 different E18.5 Cx3cr1-gfp fetuses as shown in (f). For HSPC, the data shows the position of all HSPCs found in 3 whole-mounted femurs from 3 different E18.5 wild-type fetuses as shown in (a). Based on the differential localization of myeloid cells, we defined the metaphysis as the region of the bone that is >600 µm from the center of the bone. The interdiaphysis is the region that is more than 400 µm -but less than 600 µm—from the bone center. The rest of the bone is considered the central diaphysis. Each dot corresponds to one cell. Total cell numbers of each myeloid cell population in 4 femur sections from 4 E18.5 Cx3cr1-gfp fetuses: osteoclasts n = 122, 109, 145, 170; macrophages n = 96, 33, 108, 84; Ly6C+ monocytes n = 324, 468, 427, 510; Ly6C- monocytes n = 158, 169, 192, 194; neutrophils (Neu) n = 1386, 1142, 1726, 1401; and HSPC (Lin-CD117+) n = 56, 75, 75 from 3 femur sections from 3 E18.5 wild-type fetuses. h The plots show the number of each indicated cell type per 100 µm in each bone marrow region (M=metaphysis). Each dot corresponds to one section from one E18.5 fetus. Statistical differences were calculated using one-way ANOVA. For panels b to e each dot corresponds to one femur and statistical differences were calculated using two-way Student’s t-test if the distributions were normal and Mann-Whittney if not normal. Source data are provided as a Source Data file.
Fig. 2
Fig. 2. VCAM1+ sinusoids are a “colonization niche” in the diaphysis.
a the graphs show the number of hematopoietic cells detected in Fig. 1g (left) and percentage of perfused vessels (right) defined by the presence of Ter119+ red blood cells in the vessel lumen of the E18.5 bone marrow. Each dot corresponds to one femur section from one fetus. b Experimental scheme for fate mapping yolk-sac-derived cells using Csf1r-MeriCreMer and Ai14tdTomatoTom/Tom mice. The right panel shows the percentage of the indicated cells that are yolk-sac-derived (TdTomato+) by flow cytometry. c Representative images and quantifications of TdTomato+ yolk-sac-derived osteoclasts (CD61+). Each dot corresponds to one fetus in one experiment. d The left panels show whole-mount images and representative maps from 5 µm optical sections of E16.5, E17.5 and E18.5 femurs showing progressive colonization by the indicated myeloid cells. The cell diameter and cell type are represented by the diameter and color of the spot. The right panels are representative images showing progressive upregulation of VCAM1 in sinusoidal and perisinusoidal cells in the central diaphysis as the bone marrow matures. e number of the indicated cells in the E16.5, E17.5 and E18.5 femur sections shown in d. Each dot corresponds to the average of 1 femur from 3 fetuses. Data are presented as mean values +/- SD. f Quantifications of the VCAM1+ area (black line) and VCAM1 intensity (red line) in the samples shown in c. n = 3 femur sections from 3 fetuses per time point. Data are presented as mean values +/- SD. g Representative zoomed-in optical section and map of an E18.5 femur in d showing that myeloid cells selectively map to VCAM1+ sinusoids in the central diaphysis and not to VCAM1- sinusoids. h Graph showing the distance of a respective myeloid cell population (one dot = one cell) in 3 E16.5 sections from each fetus to the closest VCAM1+ sinusoid. Statistical differences were calculated using the Kruskal-Wallis multiple comparisons test. i microscopy images showing expression of VCAM1 in CD31+ vascular endothelial and PDGFRβ stromal cells. j experimental scheme for conditional Vcam1 deletion in endothelial cells using Cdh5-CreERT:Vcam1flox/flox mice pulsed with tamoxifen at E15.5 (prior to colonization of definitive hematopoiesis). k, l quantifications (k) and raw images (l) showing colonization by Ly6C + CD11b+ cells (monocytes and neutrophils) and VCAM1 expression in CD31+ cells in femur sections from Cdh5-CreERT:Vcam1flox/flox mice (KO) or littermate controls (LC). n = 5 for both conditions. Each dot corresponds to one section from one fetus. For all panels, P values were calculated using two-tailed Mann-Whittney analyses. Source data are provided as a Source Data file.
Fig. 3
Fig. 3. Yolk-sac-derived myeloid cells control VCAM1 expression and colonization by neutrophils and HSC.
a Experimental design depleting yolk-sac-derived myeloid cells as previously reported,,–. b Representative images of whole-mounted E18.5 femurs and maps of the indicated regions. c Number of CD61+ osteoclasts after depletion of yolk-sac-derived myeloid cells. Each dot corresponds to one femur section from one E18.5 fetus. d Number of indicated cells per section; n = 5 sections from 5 E18.5 fetuses. e Cell numbers and percent VCAM1+ cells of CD45-Ter119-CD31+CD105+ vascular endothelial cells (VEC) or CD45-Ter119-CD31-PDGFRβ+ stromal cells (PDGFRβ+). Each dot corresponds to one E18.5 fetus from two independent litters. f, g Zoomed-in image from b and quantifications showing de novo misexpression of VCAM1 and subsequent recruitment of neutrophils (Ly6C+) in the metaphysis of anti-CD115-treated fetuses. For VCAM1 quantifications; IgG n = 5 and αCD115 n = 4 sections from femurs of different E18.5 fetuses in each group. For metaphyseal neutrophil quantifications; n = 5 femur sections from five E18.5 fetuses in each group. h Number of total hematopoietic cells along with Lin-Sca1+CD117+ multipotent progenitor numbers and frequency in the femur of anti-CD115- or IgG-treated E18.5 fetuses quantified by FACS. Each dot corresponds to one mouse. i Percentage of donor (CD45.2+) cells in the peripheral blood of CD45.1+ recipients at the indicated time points after transplantation of all the hematopoietic cells found in one femur of anti-CD115- or IgG-treated E18.5 fetuses along with 1 ×10⁵ CD45.1+ competitor cells purified from adult mice. Each dot corresponds to one mouse, n = 7 IgG and 8 anti-CD115 recipients in two experiments. Statistics shown are for total engraftment at 16 weeks. j Representative pentachrome stain and quantification of bone marrow area (not occupied by cartilage or bone) in E18.5 femur from IgG or αCD115 groups. Each dot corresponds to one femur from one fetus. For all panels, p values are shown, and statistical differences were calculated using a two-tailed Student’s t-test if the distributions were normal or Mann-Whitney if not normal. Source data are provided as a Source Data file.
Fig. 4
Fig. 4. Yolk-sac-derived myeloid cells are negative regulators of fetal liver hematopoiesis.
a Experimental design for depletion of yolk-sac-derived myeloid cells and examination of HSC function in primary and secondary competitive transplantation experiments in the E18.5 fetal liver. b–e Number of the indicated cells in the fetal liver of mice treated as in a Each dot corresponds to one fetus in two different litters. CFU-E Colony forming unit erythrocyte progenitors, Ery Erythroblasts, Retics Reticulocytes, RBC erythrocytes, Neutros Mature Neutrophils LT-HSC Lin-Sca1+CD117+Flt3-CD48-CD150+ Long term hematopoietic stem cells, LSK Lin-Sca1+CD117+. f Frequency of donor CD45.2+ cells in the blood of B6-SJL (CD45.1+) recipients transplanted with 50 Lin-Sca1+CD117+Flt3-CD48-CD150+ CD45.2+ LT-HSC from fetal livers and 2×10⁵ CD45.1+ competitor cells as shown in a. Note that the Lineage panel does not contain CD11b, as this molecule is expressed in fetal HSC (in contrast to adult HSC). The dot shows the mean, and the error bars the SEM. n = 6 and 7 recipients in 2 independent experiments. P values: All cells 4 weeks = 0.0298, B cells 4 weeks = 0.0087, B cells 8 weeks = 0.0291, T cells 8 weeks = 0.0041. g The table shows the fraction of CD45.1+ secondary recipients that showed peripheral blood engraftment (defined as more than 0.1% CD45.2+ donor cells in peripheral blood); the right graph shows the frequency of donor cells for the same mice. Statistical differences were calculated using a one-tailed Chi-square test. Unless otherwise indicated for all other panels: p values are shown, each dot corresponds to one mouse, and statistical differences were calculated using a two-tailed Student’s t-test if the distributions were normal or Mann-Whitney if not normal. Source data are provided as a Source Data file.
Fig. 5
Fig. 5. Mice lacking osteoclasts do not display changes in fetal liver hematopoiesis.
a Numbers of the indicated cells in the E14.5 fetal liver from fetuses from dams treated with IgG or anti-CD115 as in Fig. 4a. LT-HSC = Lin-Sca1+CD117+Flt3-CD48-CD150+ Long-term hematopoietic stem cells, CFU-E Colony forming unit erythrocyte progenitors, Ery Erythroblasts, Retics Reticulocytes, RBC erythrocytes. b Breeding strategy to generate fetuses lacking osteoclasts (RankΔ/Δ). c Representative pentachrome-stained E18.5 femur sections and quantifications from RankΔ/Δ mice and littermate controls showing reduced bone marrow cavity (control n = 10, RankΔ/Δ= 5) and hematopoietic cells per femur (control n = 11, RankΔ/Δ= 4) in RankΔ/Δ mice. d, e Representative images and quantification showing lack of VCAM1 expression and loss of Ly6C+ monocyte and neutrophil recruitment to the E18.5 RankΔ/Δ marrow. f, g Number of indicated cells in the E18.5 fetal liver from RankΔ/Δ or littermate control fetuses. h Percentage of CD45.2+ cell engraftment after transplantation of 50 Lin-Sca1+CD117+Flt3-CD48-CD150+ CD45.2+ LT-HSC purified from RankΔ/Δ or littermate controls. The dots show the mean, and the error bars the SEM. n = 6 ctrl and 4 RankΔ/Δ recipients in 2 independent experiments. For all other panels and unless otherwise indicated: p values are shown, each dot corresponds to one fetus, and statistical differences were calculated using a two-tailed Student’s t-test if the distributions were normal or Mann-Whitney if not normal. Source data are provided as a Source Data file.

References

    1. Maximow, A. Untersuchungen über Blut und Bindegewebe: I. Die frühesten Entwicklungsstadien der Blut- und Bindegewebszellen beim Säugetierembryo, bis zum Anfang der Blutbildung in der Leber. Arch. F.ür. Mikrosk. Anat.73, 444–561 (1908).
    1. Palis, J. & Yoder, M. C. Yolk-sac hematopoiesis. Exp. Hematol.29, 927–936 (2001). - PubMed
    1. Palis, J., Robertson, S., Kennedy, M., Wall, C. & Keller, G. Development of erythroid and myeloid progenitors in the yolk sac and embryo proper of the mouse. Development126, 5073–5084 (1999). - PubMed
    1. Hoeffel, G. et al. C-Myb+ erythro-myeloid progenitor-derived fetal monocytes give rise to adult tissue-resident macrophages. Immunity42, 665–678 (2015). - PMC - PubMed
    1. Gomez Perdiguero, E. et al. Tissue-resident macrophages originate from yolk-sac-derived erythro-myeloid progenitors. Nature518, 547–551 (2015). - PMC - PubMed

MeSH terms

Substances

LinkOut - more resources