. 2025 May 14;11(1):127.
doi: 10.1038/s41531-025-00981-6.

Differential memory enrichment of cytotoxic CD4 T cells in Parkinson's disease patients reactive to α-synuclein

Affiliations

Differential memory enrichment of cytotoxic CD4 T cells in Parkinson's disease patients reactive to α-synuclein

Antoine Freuchet et al. NPJ Parkinsons Dis. .

Abstract

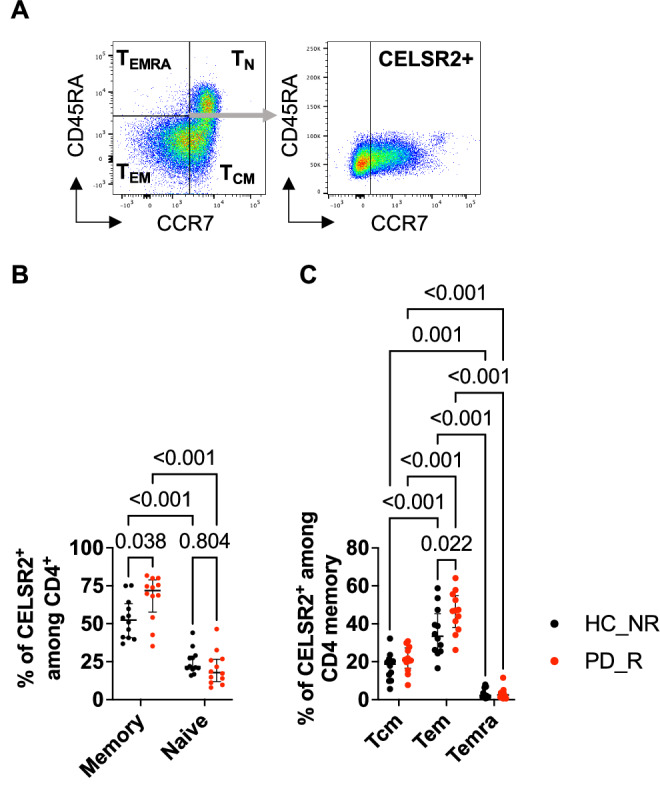
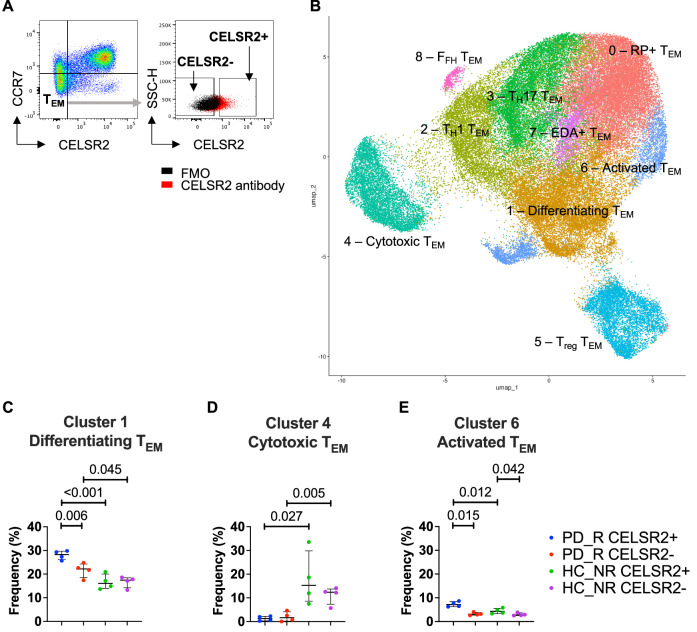
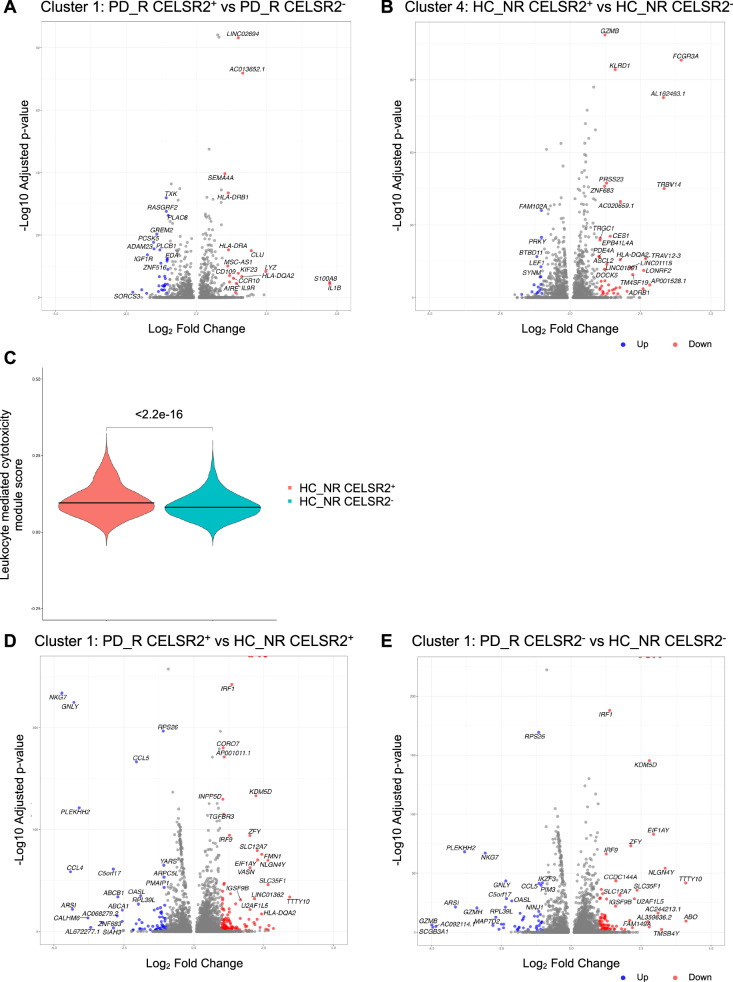
Parkinson's disease (PD) is a complex neurodegenerative disease with a largely unknown etiology. Although the loss of dopaminergic neurons in the substantia nigra pars compacta is the pathological hallmark of PD, neuroinflammation also plays a fundamental role in PD pathology. We have previously reported that PD patients have increased frequencies of T cells reactive to peptides from α-synuclein (α-syn). However, not all PD participants respond to α-syn. Furthermore, we have previously found that CD4 T cells from PD participants responding to α-syn (PD_R) are transcriptionally distinct from PD participants not responding to α-syn (PD_NR). To gain further insight into the pathology of PD_R participants, we investigated surface protein expression of 11 proteins whose genes had previously been found to be differentially expressed when comparing PD_R and healthy control participants not responding to α-syn (HC_NR). We found that Cadherin EGF LAG seven-pass G-type receptor 2 (CELSR2) was expressed on a significantly higher proportion of CD4 effector memory T cells (TEM) in PD_R compared to HC_NR. Single-cell RNA sequencing analysis of cells expressing or not expressing CELSR2 revealed that PD_R participants have elevated frequencies of activated TEM subsets and an almost complete loss of cytotoxic TEM cells. Flow cytometry analyses confirmed that Granulysin+ CD4 cytotoxic TEM cells are reduced in PD_R. Taken together, these results provide further insight into the perturbation of T cell subsets in PD_R, and highlights the need for further investigation into the role of Granulysin+ CD4 cytotoxic TEM in PD pathology.


Conflict of interest statement

Competing interests: The authors declare no competing interests.

Figures

Fig. 1
Fig. 1. CELSR2+ cells are enriched in CD4 TEM in PD_R participants.
A Representative gating strategy of how CELSR2 + CD4 T cells were identified in four different memory subpopulations in HC_NR (n = 12) and PD_R (n = 12) participants. The frequency of CELSR2+ cells were identified for each of the four subpopulations. The complete gating strategy is displayed in Supplemental Fig. 1. B Frequency of memory (combined central memory (TCM): CD45RACCR7+; effector memory (TEM): CD45RACCR7; and effector memory T cells re-expressing CD45RA (TEMRA): CD45RA+CCR7) vs. naïve T cells (TN: CD45RA+CCR7+) among CELSR2+ cells. Results are represented as median with interquartile range. Mann–Whitney U-test. C Frequency of T cell memory subpopulations (TCM, TEM, and TEMRA) among memory CELSR2+ CD4 T cells. Results are represented as median with interquartile range. Two-way ANOVA and Tukey’s multiple comparisons test.
Fig. 2
Fig. 2. scRNAseq of CD4 TEM highlights distribution differences specific to CELSR2 expression and/or PD_R.
A Representative gating strategy for how CELSR2+ and CELSR2 TEM cells were identified and sorted from HC_NR (n = 4) and PD_R (n = 4) participants for subsequent scRNAseq analysis. B UMAP of CD4 TEM CELSR2 and CESLR2+ T cells. Cluster frequencies of Cluster 1—Differentiating TEM (C), Cluster 4—Cytotoxic TEM (D), and Cluster 6—Activated TEM (E) were analyzed and compared between HC_NR and PD_R in CD4 TEM expressing CELSR2 or not. Results are represented as median with interquartile range. Frequencies were compared using a paired t-test within PD_R or HC_NR samples, and an unpaired t-test to compare frequency between PD_R and HC_NR subgroups.
Fig. 3
Fig. 3. Overall expression of CELSR2 does not significantly impact transcriptomics, yet correlates with an enhanced cytotoxic gene signature in Cluster 4—Cytotoxic TEM in HC_NR.
Volcano plots comparing differential gene expression (DEG) of PD_R CELSR2+ vs PD_R CELSR2 in Cluster 1—Differentiating TEM (A) and HC_NR CELSR2+ vs HC_NR CELSR2 in Cluster 4—Cytotoxic TEM (B). Red points are significantly upregulated in CELSR2+ samples and blue points are significantly higher in CELSR2 samples (adjusted p value <0.05 and Log2 fold change >1). C Visualization of leukocyt-mediated cytotoxicity module score in CELSR2+ and CELSR2 cells from HC_NR participants. Data were represented as median, and p value obtained using an unpaired t-test. The score was created using genes both detected in this study and included in the leukocyte-mediated cytotoxicity biological process (GO:0001909). Volcano plots comparing differential gene expression (DEG) of PD_R CELSR2+ vs HC_NR CELSR2+ cells (D) and PD_R CELSR2 vs HC_NR CELSR2 cells in Cluster 1—Differentiating TEM (E). Red points are significantly upregulated in PD_R+ cells and blue points are significantly higher in HC_NR (adjusted p value <0.05 and Log2 fold change >1).
Fig. 4
Fig. 4. Cytotoxic T cells from PD_R are differentially enriched in TEM than HC_NR.
A Representative gating strategy for the identification of CD4 T cells expressing both Granzyme B (GzmB) and perforin, or Granulysin, and the further memory cell phenotyping of the cytotoxic cell subsets, in HC_NR (n = 11) and PD_R (n = 8) participants. Complete gating strategy is displayed in Supplemental Fig. 5. The frequencies of cytotoxic CD4 T cells identified by the double expression of GzmB and perforin (B) or Granulysin (C) were analyzed. Frequencies of TEM (CD45RACCR7) within GzmB+Perforin+ (D) and Granulysin+ (E) were analyzed. Results are represented as median with interquartile range. Mann–Whitney U-test.

References

    1. PAHO/WHO. Burden of neurological conditions. https://www.paho.org/en/enlace/burden-neurological-conditions (2022).
    1. Fahn, S. & Sulzer, D. Neurodegeneration and neuroprotection in Parkinson disease. NeuroRx1, 139–154 (2004). - PMC - PubMed
    1. Soto, C. Unfolding the role of protein misfolding in neurodegenerative diseases. Nat. Rev. Neurosci.4, 49–60 (2003). - PubMed
    1. Jankovic, J. Parkinson’s disease: clinical features and diagnosis. J. Neurol. Neurosurg. Psychiatry79, 368–376 (2008). - PubMed
    1. Tansey, M. G. et al. Inflammation and immune dysfunction in Parkinson disease. Nat. Rev. Immunol.22, 657–673 (2022). - PMC - PubMed

LinkOut - more resources