. 2025 May 14;16(1):4493.
doi: 10.1038/s41467-025-59751-w.

Molecular mechanism of thyroxine transport by monocarboxylate transporters

Affiliations

Molecular mechanism of thyroxine transport by monocarboxylate transporters

Matteo Tassinari et al. Nat Commun. .

Abstract

Thyroid hormones (the common name for prohormone thyroxine and the bioactive form triiodothyronine) control major developmental and metabolic processes. Release of thyroid hormones from the thyroid gland into the bloodstream and their transport into target cells is facilitated by plasma membrane transporters, including monocarboxylate transporter (MCT)8 and the highly homologous MCT10. However, the molecular mechanism underlying thyroid hormone transport is unknown. The relevance of such transporters is illustrated in patients with MCT8 deficiency, a severe neurodevelopmental and metabolic disorder. Using cryogenic-sample electron microscopy (cryo-EM), we determined the ligand-free and thyroxine-bound human MCT8 structures in the outward-facing state and the thyroxine-bound human MCT10 in the inward-facing state. Our structural analysis revealed a network of conserved gate residues involved in conformational changes upon thyroxine binding, triggering ligand release in the opposite compartment. We then determined the structure of a folded but inactive patient-derived MCT8 mutant, indicating a subtle conformational change which explains its reduced transport activity. Finally, we report a structure of MCT8 bound to its inhibitor silychristin, locked in the outward-facing state, revealing the molecular basis of its action and specificity. Taken together, this study advances mechanistic understanding of normal and disordered thyroid hormone transport.


Conflict of interest statement

Competing interests: The authors declare no competing interests.

Figures

Fig. 1
Fig. 1. T4 transport and its inhibition by silychristin in MCT8 and MCT10.
a Representative confocal images of immunofluorescence experiments: intracellular T4 and FLAG (MCT8 or MCT10) were detected in HeLa cells overexpressing FLAG-MCT8 and FLAG-MCT10 exposed to 10 µM T4, in absence or in presence of 10 µM silychristin. b Quantification of T4 uptake by HeLa cells overexpressing FLAG-MCT8 or FLAG-MCT10. Data are presented as mean values ± SD (number of biological replicates n = 4 for endogenous protein levels (Endo), n = 4 for MCT10, n = 3 for MCT8). The normalization was performed on overexpressed MCT8 + T4 HeLa cells. P values are based on ordinary one-way ANOVA (****p < 0.0001, ***p = 0.0005, ns > 0.05). In the legend, T4 represents T4 + MCT8 and T4 + MCT10 compared to the control (endogenous MCT8/10), while silyc (silychristin) represents T4 + silychristin + MCT8/MCT10 compared to the control (Endo). Endo vs MCT8 + T4 p < 0.0001, Endo vs MCT8 + T4 + silyc. p = 0.2375, Endo vs MCT10 + T4 p = 0.0005, Endo vs MCT10 + T4 + sylic. p = 0.0615, MCT8 + T4 vs MCT8 + T4 + sylic. p < 0.0001, MCT10 + T4 vs MCT10 + T4 + sylic. p = 0.1841. c, d Ligand binding curves and relative affinities of T4 (purple), T3 (aquamarine), silychristin (green), and TRIAC (orange) for purified MCT8 and MCT10, measured in vitro by label-free microscale thermophoresis (MST). Data are presented as mean ± SD (number of biological replicates, n = 3 in c for T4, T3, TRIAC and d; n = 5 in c for silychristin). Source data are provided as a Source Data File.
Fig. 2
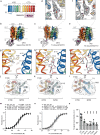
Fig. 2. Cryo-EM structures of MCT8 and MCT10.
a Schematic representation of MCT transmembrane α-helices 1–6 (N-terminal domain, NTD) and 7–12 (C-terminal domain, CTD). The construct was engineered with an ALFA tag at the C-terminus to form a complex with its cognate nanobody NbALFA. Cryo-EM map of b ligand-free MCT8 in the outward-facing state (OFS), c T4-bound MCT8 in the outward-facing state (OFS), d T4-bound MCT10 in the inward-facing state (IFS). d, f Closed-up view on T4 binding site with the corresponding cryo-EM density for MCT8 and MCT10, respectively. gi Zoomed views on the central gate region (corresponding to the white square in b, c, e), highlighting residues coordinating T4. jl Cross sections of the surface of transporters (dotted line in b, c, e) indicating progressive closure of the gate, moving solvent accessibility of the substrate from the OUT to the IN compartment. To derive the position of residues in the long isoform of MCT8, 74 amino acids should be added (Supplementary Fig. 10). m T4 binding curves relative to MCT8 and its mutants measured by MST n T4 binding curves relative to MCT10 and its mutants measured by MST. Data are presented as mean ± SD (number of biological replicates, n = 4 in m with D424N, F336A, and in n with D396A; n = 3 for all the other samples). o Quantification of T4 uptake by HeLa cells overexpressing FLAG-MCT8 and its mutants (Supplementary Fig. 8). Data are presented as mean values ± SD (number of biological replicates, n = 7 with WT, n = 5 with N119A, and n = 3 for all the other samples). The dotted line indicates negligible endogenous MCT8 levels. Normalization was performed on overexpressed MCT8 + T4. P values are based on ordinary one-way ANOVA (**p = 0.0091, ***p = 0.0007, ****p < 0.0001). For the MCT8 mutants F115A p = 0.0091, R371A p < 0.0001, N119A p < 0.0001, F336A p = 0.0007, D424N p < 0.0001. Source data are provided as a Source Data File.
Fig. 3
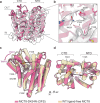
Fig. 3. Structure of the patient-derived variant MCT8 D424N.
a cryo-EM map of MCT8 D424N (D498N in the long isoform) corresponding to an outward-facing state (OFS). b cryo-EM map (σ = 6.5) close-up showing local density for D424N, Y335, Y339 and F336, and surrounding residues. c, d Overlap between ligand-free WT MCT8 and MCT8 D424N (D498N), showing larger flexibility and lateral shift in TMH7, which is more loosely held to TMH10 by a weaker Y339-N424 (Y413-N498) interaction. The distance between the two lobes, as measured from the distance Cα-Cα of H341-Y125, increases from 18.1 Å (WT) to 23.2 Å (D424N mutant). To derive the position of residues in the long isoform of MCT8, 74 amino acids should be added (Supplementary Fig. 10).
Fig. 4
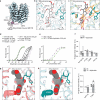
Fig. 4. Structure of MCT8 bound to its inhibitor silychristin.
a cryo-EM map of silychristin-bound MCT8 in the outward-facing state (OFS). b Close-up view on the ligand binding site with the corresponding cryo-EM density in white, showing interaction with T4 binding residues and T4 transport residues, F336, N119, F115, R371. c Overlap between T4-bound (pale yellow/gold) and silychristin-bound (pale cyan/teal) MCT8 in the OFS, showing that silychristin (gray) locks the protein in the OFS, preventing movement of F336 and N119 necessary for T4 transport. d Silychristin binding curves of WT MCT8 (green), mutants (black), and WT preincubated with T4 (violet), obtained by MST. The curves show that the inhibitor binding is reduced when mutating F336 and R371 and Y339, or when the gate is already occupied by T4, but not when modifying N119. Data are presented as mean ± SD; n = 4 with silychristin, n = 3 for all the other samples. e MCT8-T4 binding profile (MST) of the sample was preincubated with 50 µM silychristin, showing reduced ability to bind the natural substrate in the presence of the inhibitor (green) compared to the control (violet). Data are presented as mean ± SD; n = 3. f Quantification of T4 uptake by HeLa cells overexpressing FLAG-MCT8 and its mutants (Supplementary Fig. 8). Data are presented as mean values ± SD (number of biological replicates, n = 6 for WT, and n = 3 for all the other samples). Data are normalized on MCT8 WT + T4. The dotted line indicates negligible T4 uptake by untreated HeLa. P values based on ordinary one-way ANOVA (****p < 0.0001 for MCT8 WT + T4 vs MCT8 WT + T4 +  silychristin, and for all the mutants + T4 vs mutants + T4 + silychristin p > 0.9999 (ns)). g Simulated MCT10 OFS structure in complex with silychristin, showing a steric clash between Y184 and the inhibitor. h MCT8-silychristin structure showing lack of steric clash between F213 (Y184 in MCT10) and the inhibitor. i Quantification of T4 uptake by HeLa cells overexpressing FLAG-MCT10 and its mutant Y184F (Supplementary Fig. 8). Data are presented as mean values ± SD (number of biological replicates, n = 4 with MCT10 WT, and n = 3 for MCT10 Y184F). The dotted line indicates negligible T4 uptake by untreated HeLa. Data are normalized on MCT8 WT + T4 as shown in Fig. 1b. P values based on ordinary one-way ANOVA (MCT10 WT + T4 vs MCT10 WT + T4 + silychristin p = 0.1778, MCT10 Y184F + T4 vs MCT10 Y184F + T4 + silychristin p = 0.0028 (**)). To derive the position of residues in the long isoform of MCT8, 74 amino acids should be added (Supplementary Fig. 10). Source data are provided as a Source Data File.
Fig. 5
Fig. 5. Proposed model of the mechanism of MCT8-mediated thyroxine (T4) transport and of its inhibition.
Schematic illustration of MCT8 conformations during the thyroid hormone transport cycle. The states marked with * represent experimentally obtained conformations in this study, while ** were inferred by homology modeling and supported by our assays. The T4-bound IFS cartoon was derived from the structure of T4-bound MCT10, determined in this work. MCT8 D424N binds but does not transport T4, as shown by in vitro binding and in cellulo T4 uptake assays. To derive the position of residues in the long isoform of MCT8, 74 amino acids should be added (Supplementary Fig. 10).

References

    1. Friesema, E. C. H. et al. Identification of monocarboxylate transporter 8 as a specific thyroid hormone transporter. J. Biol. Chem.278, 40128–40135 (2003). - PubMed
    1. Friesema, E. C. H. et al. Effective cellular uptake and efflux of thyroid hormone by human monocarboxylate transporter 10. Mol. Endocrinol.22, 1357–1369 (2008). - PMC - PubMed
    1. Brent, G. A. Mechanisms of thyroid hormone action. J. Clin. Investig.122, 3035–3043 (2012). - PMC - PubMed
    1. Groeneweg, S., van Geest, F. S., Peeters, R. P., Heuer, H. & Visser, W. E. Thyroid hormone transporters. Endocr. Rev.41, bnz008 (2020). - PubMed
    1. Bernal, J., Guadaño-Ferraz, A. & Morte, B. Thyroid hormone transporters–functions and clinical implications. Nat. Rev. Endocrinol.11, 406–417 (2015). - PubMed

MeSH terms

Supplementary concepts

LinkOut - more resources