. 2025 May 14;15(1):16691.
doi: 10.1038/s41598-025-01298-3.

Deep magma sources beneath Central Kamchatka inferred from teleseismic tomography

Affiliations

Deep magma sources beneath Central Kamchatka inferred from teleseismic tomography

Ivan Koulakov et al. Sci Rep. .

Abstract

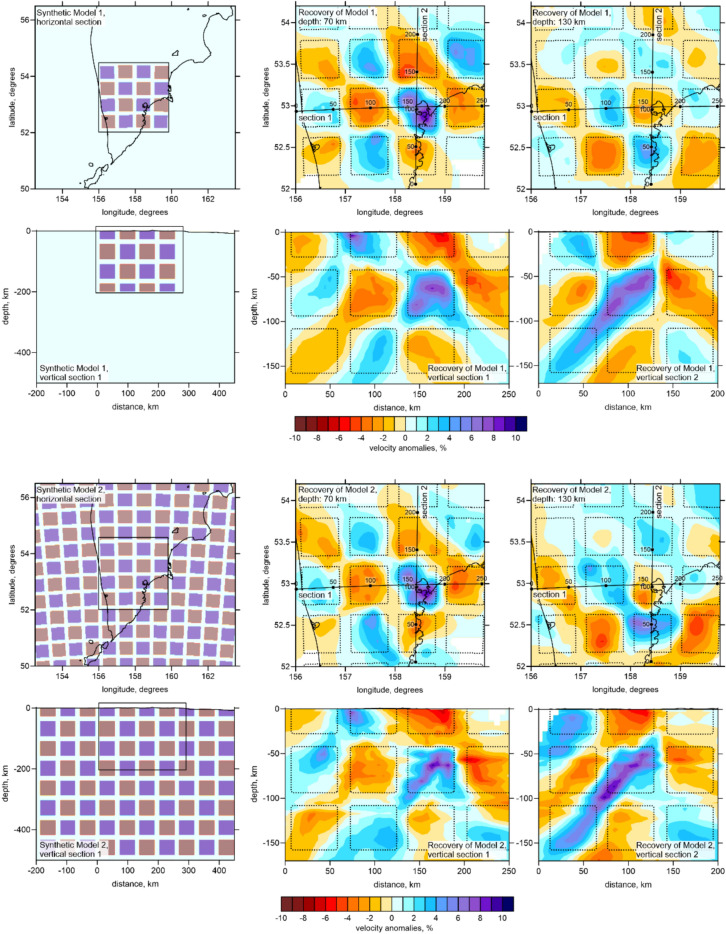
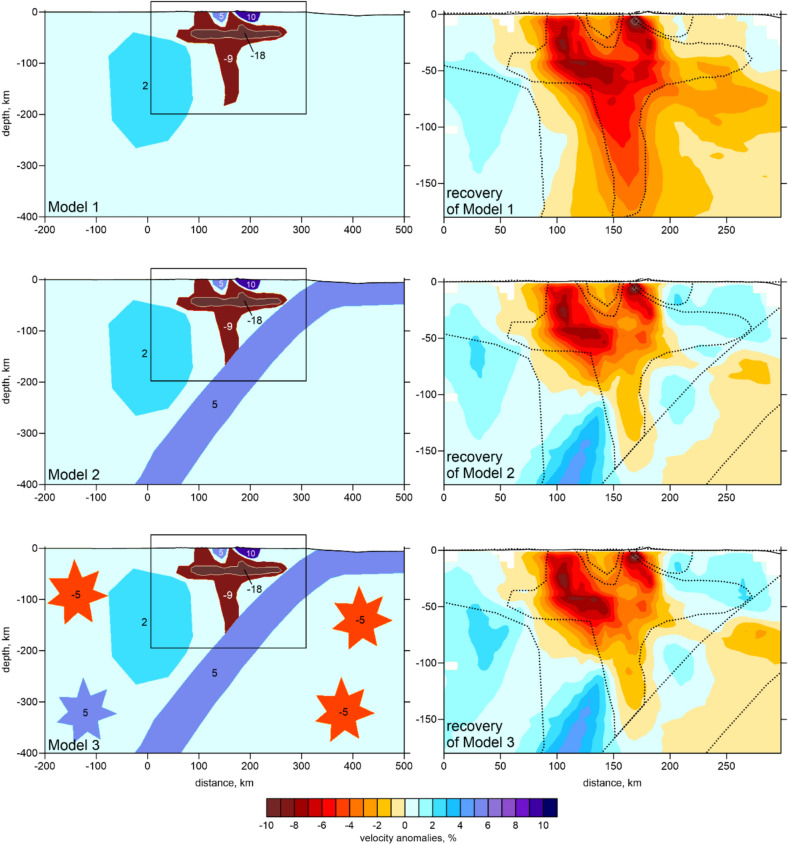
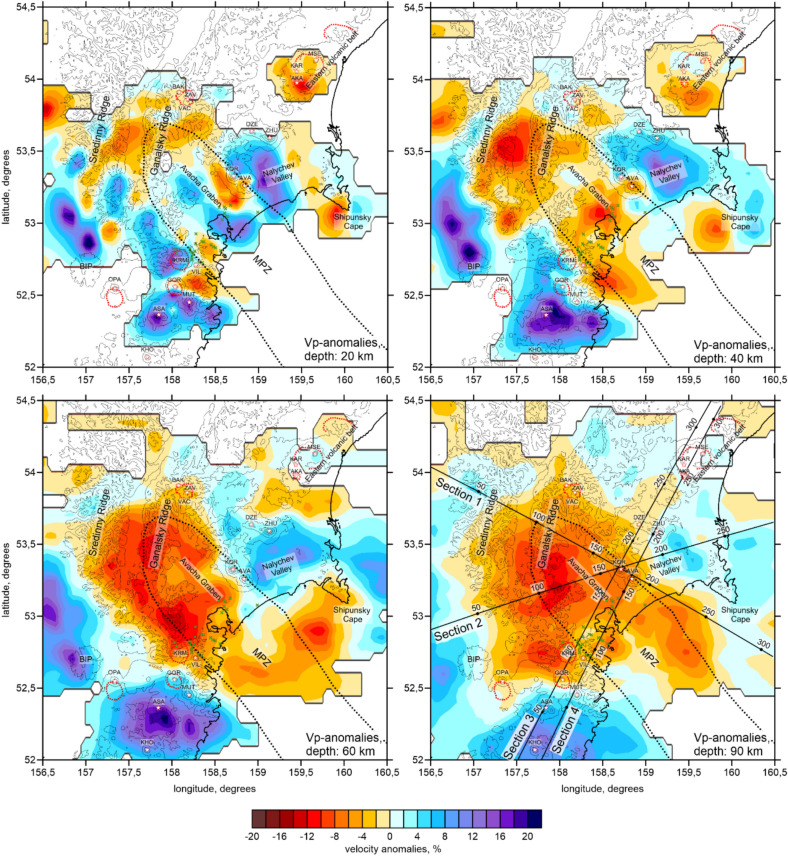
Central Kamchatka is a typical Andean-type subduction complex including a linear volcanic arc, back-arc volcanic complexes and zones of tectonic shortening and extension. With the use of teleseismic tomography, we investigate the role of mantle processes in the observed volcanic and tectonic activity in this region. We use the seismic data of permanent stations and a temporary network deployed in central Kamchatka in 2019-2020. Arrival times of the P waves from events at distances from 15 to 110 degrees are used as input for tomographic inversion to derive a 3D model of the P-wave velocity anomalies down to the depth of 150 km. In the resulting model, beneath the central part of the study area, we observe a prominent low-velocity anomaly in the mantle overlain by a high-velocity crustal block. A chain of the Avacha Group volcanoes is located above the northeastern border of this anomaly, and Mutnovsky, Gorely and Viluchinsky volcanoes are associated with its southwestern border. We propose that the hot mantle material, which arrived from the slab window, surrounds the bottom of the rigid crustal block and ascend along its borders causing the formation of large stratovolcanoes.


Conflict of interest statement

Declarations. Competing interests: The authors declare no competing interests.

Figures

Fig. 1
Fig. 1
Study area. (A) Topography and main geological structures in central Kamchatka. The red dotted line highlights major calderas. The red dashed lines indicate volcano lineaments. The red crosses indicate monogenic cones and extrusive domes within the MPZ. The main cities highlighted with blue characters: PKC—Petropavlovsk-Kamchatsky, El—Elizovo, Vl—Viluchinsk. Abbreviations for volcanoes: ZHE—Zheltovsky; KSU—Ksudach; KHO—Khodutka, ASA—Asacha; OPA—Opala; BIP—Bolshaya Ipelka; MUT—Mutnovsky; Gor—Gorely; VIL—Vil-yuchinsky, KAR—Karymshina Caldera, TOL—Tolmachev Dol; KOR—Koryaksky; AVA—Avachinsky; DZE—Dzenzur; Zhu—Zhupanovsky; VAC—Verkhneavachinskaya Caldera; BAK—Bakening; AKA—Akademii Nauk; KAR—Karymsky; MSE—Maly Semyachik. (B) Location of the study area (blue rectangle) in the regional map. The blue lines indicate the shape of the slab. The red dots depict the Holocene volcanoes. The rate of the Pacific Plate movement is indicated by arrows. The figure was generated using the software Surfer (version 13, http://www.goldensofware.com/products/surfer).
Fig. 2
Fig. 2
Ray paths in map view and vertical projections. The triangles in the map indicate seismic stations. Red and green filling of the triangles indicate temporary and permanent stations, respectively; the green contour means that this station is used for the teleseismic data analysis. The figure was generated using the software Surfer (version 13, http://www.goldensofware.com/products/surfer).
Fig. 3
Fig. 3
The distribution of teleseismic events (red dots) used for tomography. The blue dots in the center indicate seismic stations. The figure was generated using the software Surfer (version 13, http://www.goldensofware.com/products/surfer).
Fig. 4
Fig. 4
A screenshot of the SEISAN software60 with an example of picking an event with the magnitude of 5.5 located at a distance of ~ 70°. The left panel shows the initial seismogram without filtering, in which the arrival wave is almost not visible. The right panel shows the result of the bandpass filtering in the frequency range of 1–5 Hz, which was found most appropriate in this case. The blue indications highlight theoretical phases, and the red ones indicate the manual picking results.
Fig. 5
Fig. 5
Results of two checkerboard tests showing the effect of anomalies located outside the resolved area. The upper two lines present the test for the Model 1, in which the synthetic anomalies are defined in the investigated area only, and the lower two lines show the test for the Model 2 with an unlimited checkerboard model. The left column presents the synthetic models on a larger scale in horizontal and vertical sections. Rectangles indicate the limits of the study area. The 2nd and 3rd columns present the recovery results in two horizontal and two vertical sections. In the resulting images, the shapes of the initial synthetic patterns are highlighted with the dotted lines. The locations of the sections are shown in the maps. The figure was generated using the software Surfer (version 13, http://www.goldensofware.com/products/surfer).
Fig. 6
Fig. 6
Synthetic tests for three free-shaped models defined in the vertical section 1 (same as in Fig. 8). The left column presents the initial synthetic model in the same section, but on a larger scale, and the right column presents the recovery results for the corresponding models. The numbers indicate the values of the synthetic anomalies in percent. The dotted lines in the resulting images highlight the shapes of the synthetic anomalies. The rectangles in the left column highlight the limits of the study area. The figure was generated using the software Surfer (version 13, http://www.goldensofware.com/products/surfer).
Fig. 7
Fig. 7
Resulting anomalies of the P-wave velocity in horizontal sections. The thin contour lines indicate the topography with the interval of 500 m. The black dotted line highlights the Malko-Petropavlovsk fracture zone (MPZ). The red dotted line highlights major calderas. The red crosses indicate monogenic cones within the Avacha Graben. PKC—Petropav-lovsk-Kamchatsky City. Abbreviations for volcanoes: KHO—Khodutka, ASA—Asacha; OPA—Opala; BIP—Bolshaya Ipelka; MUT—Mutnovsky; Gor—Gorely; VIL—Vilyuchinsky, KAR—Karymshina Caldera; KOR—Koryaksky; AVA—Avachinsky; DZE—Dzenzur; Zhu—Zhupanovsky; VAC—Verkhneavachinskaya Caldera; ZAV—Zavaritskogo; BAK—Bakening; AKA—Akademii Nauk; KAR—Karymsky; MSE—Maly Semyachik. The figure was generated using the software Surfer (version 13, http://www.goldensofware.com/products/surfer).
Fig. 8
Fig. 8
Resulting anomalies of the P-wave velocity in four vertical sections. Exaggerated relief is presented above each section. The locations of the sections are shown in Fig. 7 in the map at 90 km depth. Abbreviations for the mountain ranges: Sred—Sredinny; Gan—Ganalsky. Abbreviations for volcanoes: AVA—Avachinsky; KOR—Koryaksky; ASA—Asacha; GOR—Gorely; MUT—Mutnovsky; ZHU—Zhupanovsky; DZE—Dzhenzur; KAR—Karymsky. The figure was generated using the software Surfer (version 13, http://www.goldensofware.com/products/surfer).
Fig. 9
Fig. 9
Schematic interpretation of the resulting anomalies of P-wave velocity in section “Data and algorithms”. The red triangles depict the distributed monogenic cones. The area with the dotted line contour masks the low-resolution parts of the model. The red arrows indicate possible flows of hot material from the slab window. Abbreviations: KOR—Koryaksky Volcano; ASA—Asacha Volcano; GOR—Gorely Volcano; DZE—Dzhenzur Volcano; MPZ—Malko-Petropavlovsk Fracture Zone. “Smokes” above GOR and KOR indicate that they are active volcanoes. The figure was generated using the software Surfer (version 13, http://www.goldensofware.com/products/surfer).

References

    1. DeMets, C., Gordon, R. G., Argus, D. F. & Stein, S. Current plate motions. Geophys. J. Int.101(2), 425–478 (1990).
    1. Holocene Kamchatka volcanoes. http://www.kscnet.ru/ivs/volcanoes/holocene/main/main.htm (2024).
    1. Melekestsev, I. V., Litasova, S. N. & Sulerzhitskii, L. D. The age and scale of catastrophic eruptions of the directed explosion type in the Avacha Volcano (Kamchatka) in the Late Pleistocene. Volcanol. Seismol.13(2), 135–146 (2009).
    1. Dobretsov, N. L., Koulakov, I. Y., Litasov, K. D. & Kukarina, E. V. An integrate model of subduction: contributions from ge-ology, experimental petrology, and seismic tomography. Russ. Geol. Geophys.56(1–2), 13–38 (2015).
    1. Steinberg, G. S. & Zubin, M. I. The depth of the magmatic focus under the Avachinsky volcano. Dokl. Akad. Nauk SSSR152(4), 968–971 (1963).

LinkOut - more resources