. 2025 Aug;644(8075):153-163.
doi: 10.1038/s41586-025-09010-1. Epub 2025 May 14.

Spatial transcriptomics reveals human cortical layer and area specification

Affiliations

Spatial transcriptomics reveals human cortical layer and area specification

Xuyu Qian et al. Nature. 2025 Aug.

Abstract

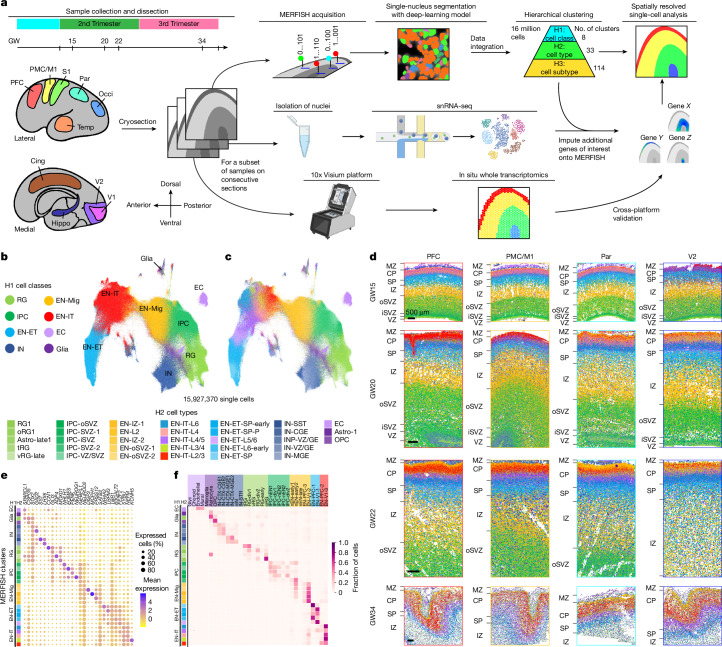
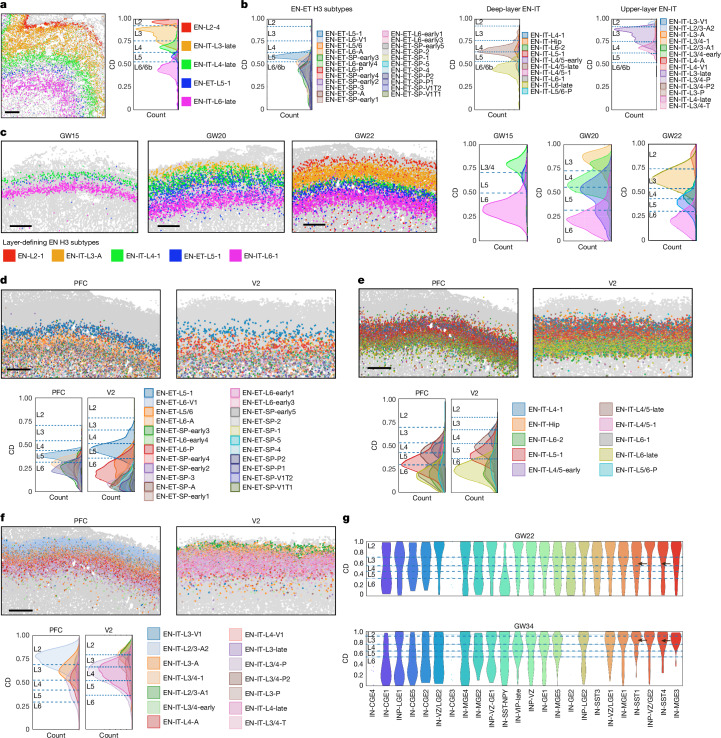
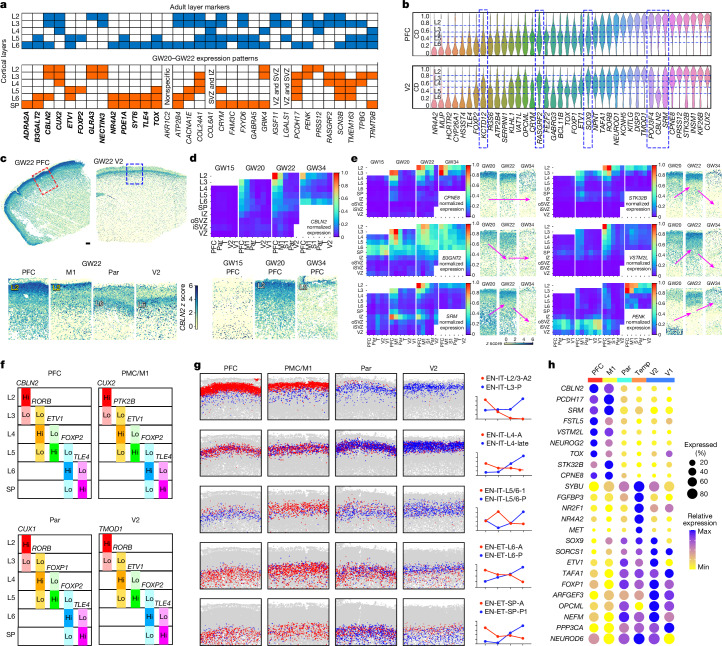
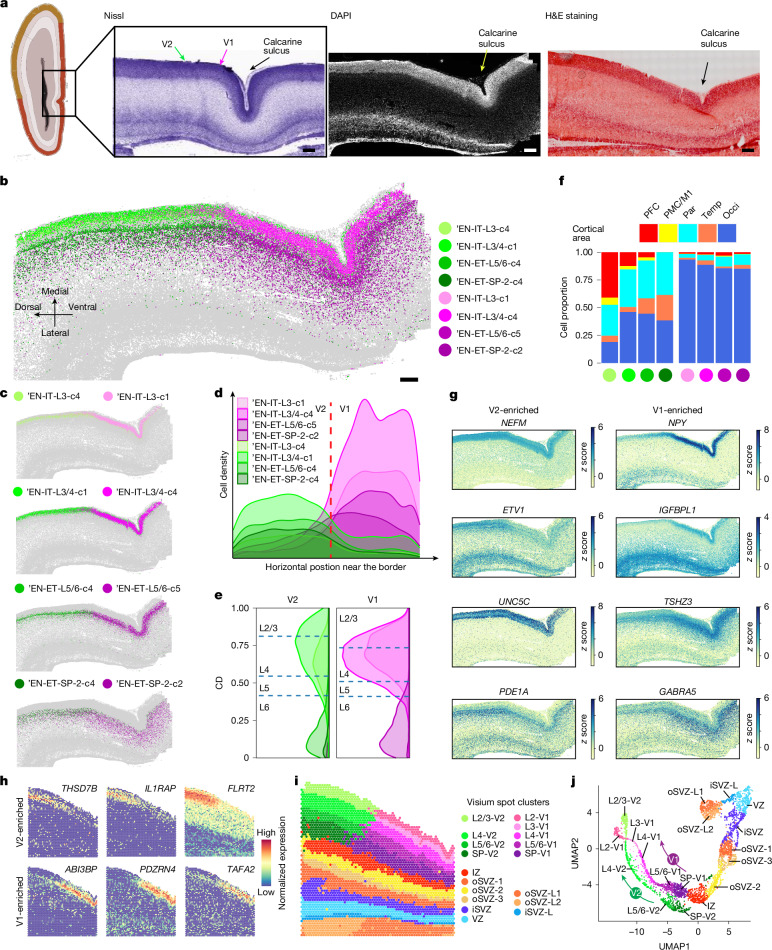
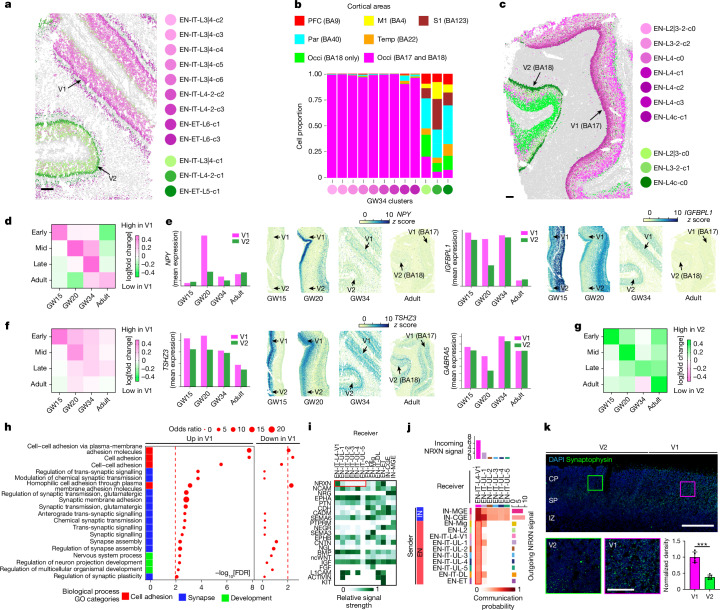
The human cerebral cortex is composed of six layers and dozens of areas that are molecularly and structurally distinct1-4. Although single-cell transcriptomic studies have advanced the molecular characterization of human cortical development, a substantial gap exists owing to the loss of spatial context during cell dissociation5-8. Here we used multiplexed error-robust fluorescence in situ hybridization (MERFISH)9, augmented with deep-learning-based nucleus segmentation, to examine the molecular, cellular and cytoarchitectural development of the human fetal cortex with spatially resolved single-cell resolution. Our extensive spatial atlas, encompassing more than 18 million single cells, spans eight cortical areas across seven developmental time points. We uncovered the early establishment of the six-layer structure, identifiable by the laminar distribution of excitatory neuron subtypes, 3 months before the emergence of cytoarchitectural layers. Notably, we discovered two distinct modes of cortical areal specification during mid-gestation: (1) a continuous, gradual transition observed across most cortical areas along the anterior-posterior axis and (2) a discrete, abrupt boundary specifically identified between the primary (V1) and secondary (V2) visual cortices as early as gestational week 20. This sharp binary transition in V1-V2 neuronal subtypes challenges the notion that mid-gestation cortical arealization involves only gradient-like transitions6,10. Furthermore, integrating single-nucleus RNA sequencing with MERFISH revealed an early upregulation of synaptogenesis in V1-specific layer 4 neurons. Collectively, our findings underscore the crucial role of spatial relationships in determining the molecular specification of cortical layers and areas. This study establishes a spatially resolved single-cell analysis paradigm and paves the way for the construction of a comprehensive developmental atlas of the human brain.


Conflict of interest statement

Competing interests: C.A.W. has stock ownership in Maze Therapeutics and Mosaica Therapeutics, and is a paid consultant for Third Rock Ventures and Flagship Pioneering. M.L. receives research funding from Biogen, unrelated to the current article. M.L. is a co-founder of OmicPath AI. The remaining authors declare no competing interests.

Figures

Fig. 1
Fig. 1. A spatially resolved single-cell atlas of human fetal cortical development.
a, Schematic of sampling and workflow. b,c, UMAP of single cells analysed by MERFISH, coloured by H1 cell classes (b) and H2 cell types (c). d, Spatial maps of H2 cell types from major cortical areas across GW15–GW34. Scale bars, 500 µm. e, Dot plot showing the expression of top marker genes for H2 cell types. f, Cell-type correspondence heatmap shows the fraction of cells from MERFISH H2 clusters that associate to clusters from a published mid-gestation scRNA-seq dataset. Cing, cingulate cortex; Hippo, hippocampus; Occi, occipital cortex; OPC, oligodendrocyte precursor cells; oRG, outer radial glia; S1, primary somatosensory cortex; tRC, truncated radial glia; vRG, ventricular radial glia. A full glossary of acronyms and abbreviations used throughout the main text and figures is provided in Supplementary Table 1. The schematic in a was created using BioRender (https://www.biorender.com).
Fig. 2
Fig. 2. Progressive formation and specification of cortical layers.
a, Left, spatial map showing that layers 2–6 (L2–L6) are defined by the organization of selected EN H3 subtypes in the PFC at GW34. Right, ridgeline plot showing the CD distribution of layer-defining EN subtypes. The height of the ridgeline represents the cell density. Dashed lines represent the border between layers, calculated on the basis of the CD distribution of layer-defining EN subtypes. b, Ridgeline plots reveal further spatial complexity among EN-ETs, deep-layer (layers 5 and 6) EN-ITs and upper-layer (layers 2–4) EN-ITs in the PFC at GW34. c, Spatial maps and ridgeline plots show the progressive formation of cortical layers from GW15 to GW22. The six-layer structure can be visualized and quantitatively defined by the distribution of layer-defining EN subtypes at GW22 despite the lack of cytoarchitectural differences between layers. df, Spatial maps (top) and ridgeline plots (bottom) showing the distribution of EN-ETs (d), deep-layer EN-ITs (e) and upper-layer EN-ITs (f) in the PFC and the V2 at GW22. Although many clusters exhibit area-dependent abundance, their laminar localization is highly consistent between the PFC and the V2. g, Violin plots showing the laminar distribution of H3 IN subtypes in the CP of the PFC at GW22 and GW34. IN-SST clusters indicated by the arrows exhibit specific localization in layers 2 and 3 at GW34. Scale bars, 500 µm (a,c,d,f).
Fig. 3
Fig. 3. Areally dynamic gene expression and continuous neuron specification along the AP axis.
a, Table comparing the laminar expression patterns of classical cortical layer markers between the adult human PFC (data from ref. ) and mid-gestation PFC (this study). Genes that show a conserved laminar expression pattern are highlighted in bold. b, Violin plots show the laminar expression patterns of layer-dependent genes in the CP of the PFC and the V2 at GW22. The width of the violins represent the cumulative normalized expression in the cells located at a CD. Genes that are enriched in different layers between the PFC and the V2 are highlighted by the dashed outline boxes. c,d, z score spatial maps (c) and summary expression heatmap (d) showing the spatiotemporal expression pattern of CBLN2. The summary heatmap shows different cortical layers and laminar structures from top to bottom as rows, and cortical areas and gestational ages as columns, organized from anterior to posterior and from young to old. The average is taken for replicate samples from the same area and gestational week. T, temporal cortex. Scale bar, 500 µm. e, Summary expression heatmaps and z score spatial maps of genes identified with layers 2 and 3 enrichments in the PFC. Arrows indicate the direction of upregulation or downregulation over time. f, Schematic summary of the combinations of five marker genes that enable the approximation of cortical layers of different cortical areas at GW22. g, Spatial graphs and normalized curve plots showing the localization and abundance of pairs of anterior-enriched and posterior-enriched EN subtypes at GW22 across major cortical areas. h, Dot plot showing the expression of top areally enriched genes at GW20 and GW22 in all post-migratory ENs (EN-IT and EN-ET cell classes).
Fig. 4
Fig. 4. Sharp molecular border between the V1 and V2 reveals discrete arealization as early as GW20.
a, The V1 and V2 do not exhibit morphological differences at GW20–GW21. Schematics and Nissl staining are taken from the Allen Reference Atlas for GW21 human fetal brain. DAPI staining image of a GW20 occipital cortex was co-captured with MERFISH (repeated independently for four times). Haematoxylin and eosin (H&E) staining image of a GW20 occipital cortex (consecutive section) was co-captured with Visium (not repeated). Scale bars, 500 µm. b,c, Spatial maps for selected EN subtypes in the occipital cortex show a distinct border between the V1 and V2 marked by a sharp transition of EN subtypes at GW20. Scale bar, 500 µm. d, Ridgeline plots of the horizontal cell density profile for V1-enriched and V2-enriched EN subtypes in the CP near the border. e, Ridgeline plots of the laminar distribution for V1-enriched and V2-enriched EN subtypes. Dashed lines represent the borders between cortical layers. f, Histograms for areal distribution show V2-enriched subtypes (green) distributed broadly in other cortical areas, whereas V1-enriched subtypes (purple) are exclusive to the occipital cortex. g. z score spatial maps of representative V1-enriched and V2-enriched genes. h, Spatial graphs showing additional genes identified by Visium exhibiting a clear transition at the border. i, Spatial graph from Visium analyses show a clear V1–V2 border across all cortical layers. Capture area, 6.5 × 6.5 mm. j, UMAP of Visium spots shows that the trajectory remains coherent from the VZ to the IZ, but bifurcates after the SP to form two trajectories representing the V1 and the V2.
Fig. 5
Fig. 5. Temporally dynamic gene expression underlies post-migratory neuron specification in the V1.
a, MERFISH spatial map shows that the V1 and the V2 contain distinct neuronal subtypes at GW34. b, Histograms for areal distribution show that V1-enriched subtypes (purple) are exclusively found in the V1 (BA17). c, The V1 and V2 also contain distinct neuronal subtypes in adulthood. d, Summary heatmap shows that V1-enriched gene sets for EN-ITs are distinct at each time point. Each row corresponds to the set of V1–V2 DEGs identified at different time points: early, GW15; mid, GW20; late, GW34. The cumulative mean expression levels of the gene sets were compared between the V1 and the V2, and the log[fold change] values of V1–V2 are plotted as heatmap colours. The following experiments were analysed: UMB1117-O1, FB080-O1c, UMB5900-BA17 and UMB5958-BA17. See Supplementary Table 11 for the full list of DEGs. e, NPY and IGFBPL1 show the most prominent V1 enrichment specifically at GW20. f,g, Summary heatmaps, similar to d, show that V1-enriched gene sets for EN-ETs are more stable over time than EN-ITs (f), and V2-enriched gene sets for EN-ITs are more stable over time than those enriched in the V1 (g). h, GO analysis reveals synapse-associated and cell-adhesion-associated biological processes are upregulated in V1-specific layer 4 neurons. i, Heatmap for incoming signalling pathways shows NRXN signalling is specifically enriched in V1-specific layer 4 neurons (EN-IT-L4-V1 cluster; highlighted by the red outline) compared with other upper-layer (UL) EN-IT clusters. j, Network heatmap shows that EN-IT-L4-V1 is unique among upper-layer EN-ITs to receive NRXN signalling from both IN and EN sources. Bar graphs on the top and right show the sum of interaction strength as incoming and outgoing signals, respectively. k, Immunostaining for synaptophysin validates upregulation of synaptogenesis in layer 4 of the V1 at GW20. Quantification shows mean ± s.d., n = 5 images from 3 samples. ***P = 0.00037, Student’s two-sided t-test. Scale bars, 500 µm (a,c,k (top)) or 100 µm (k, bottom).
Extended Data Fig. 1
Extended Data Fig. 1. Single-nucleus segmentation and reproducibility of MERFISH.
a, Example test image (left), test image filtered with difference of Gaussians filter (mid), and filtered test image overlaid with ground-truth manual segmentation (magenta) and segmentation from the fine-tuned CellPose 2.0 model trained using filtered images (green)(right). b, Consistency of the segmentation algorithm comparing with human manual labeling as the ground truth. The consistency is quantified using the average precision (AP) metric, at varying intersection-over-union (IoU) thresholds. The AP is defined as the number of true positives divided by the total number of true positives, false negatives, and false positives. The fine-tuned model trained with filtered images outperformed the fine-tuned model trained on the raw images and the built-in “CellPose cyto” model. c, Example segmentations of fields of view from two experiments (repeated 44 times). d, UMAP projection of unsupervised clustering of cells processed with and without the 10-pixel dilation shows unbiased representation across all clusters. To test if the dilation affected the accuracy of cell type identification, one experiment (FB080-O1c) was separately processed with the 10-pixel dilation disabled, and the resulting cells were co-clustered with the dilated cells. e, Dilated cells show modest increase in transcript counts over non-dilated cells across all clusters (total n = 1,001,363 cells distributed across 30 clusters). f, g, Box plots show that the distribution of volumes of individual cells after CellPose segmentation were consistent across experiments (f) and across cell types (g) (total n = 15,927,370 cells distributed across experiments and cell types). Box plots show media value as center; lower and upper bounds of box correspond to the first and third quartiles; whiskers extend up to 1.5 times the interquartile range from the lower and upper bounds of the box. h, Box plot showing the distribution of proportion of expressed genes among the 300 panel genes in cells from different H2 cell types (total n = 15,927,370 cells distributed across experiments and cell types). Our MERFISH panel design placed an emphasis on excitatory neurons, leading to more genes detected in EN cell types than others. i, j, k, Scatterplots and summary histogram (mean ± standard deviation) show the average count per cell of individual genes is consistent between two replicate experiments from the same sample (n = 7 pairs of technical replicates) (i), and between two independent donors with matching gestational age and cortical area (n = 6 pairs of biological replicates) (j). The blue solid line indicates equality. The grey dashed lines indicate the average counts per cell of the blank barcodes, which provides an estimate of the false-positive rate.
Extended Data Fig. 2
Extended Data Fig. 2. Robust integration of single cell data from various donors, ages, and areas.
a, UMAP plots showing cells from different individuals (left), gestational ages (mid), and cortical lobes (right) integrated evenly into a combined dataset. b, Pie charts showing the proportion contributions of cells from different individuals (left), gestational ages (mid) and cortical lobes (right). c, Histogram showing the compositions of H2 cell types across MERFISH experiments. d, MERFISH spatial maps colored by H2 cell types. The experiment names are shown above each graph, which includes the sample ID, and a suffix indicating the cortical lobe. F, frontal; P, parietal; O, occipital; T, temporal; BA, Brodmann’s Area (only identifiable at GW34). Scale bars, 500 µm.
Extended Data Fig. 3
Extended Data Fig. 3. Gene expression profiles of MERFISH clusters and correspondence with scRNAseq datasets.
a, Top markers genes for MERFISH cell types identified in Fig. 1e show similar expression patterns in the corresponding scRNAseq clusters identified in Fig. 1f. b, Cell type correspondence heatmap shows the fraction of cells from MERFISH H2 clusters that associate to clusters from another published mid-gestation scRNA-seq dataset. The highest correspondence fraction for each MERFISH H2 cell type (largest value of each row) is shown in the histogram (right). c, Dot plot showing the expression of top marker genes for H3 subtypes. d, e, Cell type correspondence heatmaps showing the fraction of cells from MERFISH H3 clusters associated to clusters from published fetal scRNA-seq dataset from Nowakowski et al. 2017 (d) and from Bhaduri et al. 2021 (e). The highest correspondence fraction for each MERFISH H3 subtype (largest value of each column) is shown in the histogram (top).
Extended Data Fig. 4
Extended Data Fig. 4. A framework for quantitative analysis of cells’ laminar localization.
a, Schematics illustrating the annotated fan-shaped cortical area and the calculation of relative height (RH). b, Spatial maps and violin plots showing the laminar distribution of H2 cell types from the apical to basal surface quantified by the RH across major cortical areas in the second trimester. The width of the violin for each cell type is normalized to the maximum value. Image scales are the same for different areas from the same GW. Scale bars, 500 µm.
Extended Data Fig. 5
Extended Data Fig. 5. High concentration of INs in the dorsal VZ at mid-gestation.
a, Spatial map shows inhibitory neurons (IN) are highly concentrated in the ventricular zone (VZ) of the prefrontal cortex (PFC) at GW20. b, INs are not enriched in the VZ of the occipital cortex at GW20, and are mostly absent in the VZ of all cortical areas at GW15. c, Histograms quantifying the cell class proportions within the VZ areas across experiments show INs outnumber RG and IPCs in all cortical areas except occipital cortex at GW20, but are largely absent at GW15. Due to the size restriction of MERFISH imaging area, the VZ was not systematically analyzed for GW22 and GW34 samples. d, e, Relative height (RH) violin plots and histograms for the distribution of H3 IN subtypes show the VZ localization is subtype dependent. f, Z-score spatial plots show IN markers are highly expressed in the VZ, but MGE progenitor marker NKX2.1 and CGE progenitor marker BEST3 were expressed sparsely. g, h, Spatial graph and UMAP of 10x Visium analysis of the PFC at GW20, performed on consecutive tissue section analyzed by MERFISH. Clusters for Visium spots were annotated based on tissue structure and gene expression. “M” in the cluster annotation means medial, as opposed to lateral. Capture area: 6.5 mm×6.5 mm. i, Spatial heatmap for detected transcript count in each spot. Because each spot has a diameter of 55 µm and contains variable number of cells, the variation in transcript count is largely due to difference in cell density in different structures. j, Scaled expression spatial heatmaps showing additional marker genes for various IN subtypes are highly expressed in the VZ, including olfactory bulb-like IN markers CALB2, PBX3, and TSHZ1. Scale bars, 500 µm.
Extended Data Fig. 6
Extended Data Fig. 6. Cortical layer morphology and cortical depth analysis of neuronal subtypes.
a, Microscopy images of nuclei staining (DAPI) for the CP of PFC and V2 at GW20, 22 and 34, demonstrating that cytoarchitectural difference between cortical layers is not visible until GW34. These images were co-captured during MERFISH imaging. Scale bars, 500 µm. b, Schematics illustrating the calculation of cortical depth (CD) within the CP. c, Violin plots showing the CD distribution of H3 EN subtypes across major cortical areas at GW15 to 34. d, Cell type correspondence heatmap shows the fraction of cells from H3 EN subtypes associated to neuronal cell types from published adult human cortex scRNA-seq dataset from Hodge et al..
Extended Data Fig. 7
Extended Data Fig. 7. Additional characterizations of cortical layers and EN laminar distribution.
a, Histogram showing the relative proportion of each cortical layer at GW15 to 34 in the PFC (n = 10 independent experiments), parietal cortex (Par) (n = 8 independent experiments), and occipital cortex (Occi) (n = 5 independent experiments). Average is taken for replicate experiments; histograms represent mean ± standard deviation when applicable. b, c, Histograms for cell and neuron density across major cortical areas at GW20 (b, n = 17 independent experiments) and GW22 (c, n = 6 independent experiments). Replicate data points are shown when applicable; histograms represent mean ± standard deviation. d-g, Spatial maps of layer-defining EN subtypes, and ridgeline plots showing the laminar distribution of H3 EN subtypes in the V2 at GW15 (d), 20 (e), 22 (f) and 34 (g). Scale bars, 500 µm.
Extended Data Fig. 8
Extended Data Fig. 8. Laminar expression patterns of genes are dynamic across ages and areas.
a, Dot plots showing the expression of genes exhibiting cortical layer-dependent distribution from Fig. 3b across H3 EN subtypes. b, Z-score spatial maps (right) from MERFISH experiments on the parietal cortex at GW22, and matching confocal microscopy images (left) of immunostaining for SATB2, CTIP2 (gene name BCL11B), and TBR1. The immunostaining was performed on a tissue section adjacent to the one analyzed by MERFISH, and the same area is shown, demonstrating high spatial correspondence between mRNA detection by MERFISH and protein detection by immunohistology (not repeated). Scale bar, 500 µm. c, Summary expression heatmap and z-score spatial maps for CYP26A1. d, Summary expression heatmaps showing the spatial temporal expression patterns of area-specific cortical layer markers listed in Fig. 3j. e, Pseudo-colored images of detected transcript for area-specific cortical layer marker combinations identified by MERFISH.
Extended Data Fig. 9
Extended Data Fig. 9. Anteriorly and posteriorly enriched neuronal subtypes showcase continuous cortical arealization in the mid-gestation.
a, Top, enrichment heatmap showing the normalized fraction of cells from each H3 EN subtype that came from a given age and cortical area. Each row represents an independent MERFISH experiment, and each column represents an EN subtype under EN-IT, EN-ET, and EN-Mig. For each column the number of cells from each experiment was normalized to the total number of the cluster, and then normalized to the maximum value of the column within the same gestational week to show relative enrichment (Methods). Bottom row 1, histogram showing the contribution of major cortical areas towards each H3 EN subtype. Bottom row 2, histogram showing the number of cells and contribution from each gestational age for H3 EN subtypes. Three columns that have values exceeding 300k cells are indicated with an asterisk. b, Heatmap for areal enrichment of RG, IPC, and IN H3 subtypes, similar to a. Parts of the CGE were included in the temporal lobe samples for GW15 and 20, leading to strong enrichment of several IN-CGE subtypes. c, UMAP plot of EN subtype composition for individual experiments shows a continuous anterior-posterior spectrum for GW20-22. d, Arrays of spatial maps of GW20 MERFISH experiments, showing the pairs of EN clusters in Fig. 3g exhibit similar gradient-like enrichment patterns in the A-P axis.
Extended Data Fig. 10
Extended Data Fig. 10. Identification of genes driving neuronal areal specification along the A-P axis.
a, b, Dot plots and histograms of fold change for top differentially expressed genes (DEGs) between pairs of anterior- and posterior-enriched EN subtypes for each cortical layer at GW22. Genes that appear repeatedly are highlighted in red (for anterior-enriched) or in blue (for posterior-enriched). b summarizes several prominent anteriorly enriched genes seen across different pairs. c, Summary expression heatmaps of genes that are anteriorly or posteriorly enriched consistently across all layer categories in Fig. 3h. d, Dot plots for EN-Mig, RG, and IPC at GW20 showing the expression of areally enriched genes identified in EN-IT and EN-ETs in Fig. 3h. EN-Mig, but not RG and IPC, exhibited similar areal enrichment patterns as EN-IT and EN-ET. e, Dot plot showing the expression of top areally-enriched genes at GW20 identified separately among EN-Mig, RG, and IPC.
Extended Data Fig. 11
Extended Data Fig. 11. Diversification of EN subtypes over time shows continued post-mitotic fate specification.
a, b, Sankey diagrams showing the correspondence between EN-ET (a) and EN-IT (b) subtypes from different gestational time points. Clustering was performed separately for each gestational age and the number of subclusters was determined by single cell significant hierarchical clustering (scSHC). To differentiate these clusters from those identified through integrated analysis, an apostrophe (’) precedes the names of scSHC clusters. Nodes represent EN subtypes from this alternative clustering strategy. Thickness of edges represents the fraction of cells showing correspondence, and edges with <0.1 fraction were hidden. Nodes and edges are colored based on the most enriched layer identity of the EN subtype. Two inferred lineages shown in c and d are highlighted with yellow background. c, Sankey diagrams similar to a and b, with layer-based groups shown separately from each other. d, Spatial graphs for an inferred lineage (highlighted in a) of Layer 6/SP EN-ETs across GW15 to GW34 show a conserved stream from GW15 to 22 before dramatic diversification at GW34. Scale bars, 500 µm. e, Spatial graphs showing a GW22 cluster EN-ITs spamming both Layers 4 and 5 specifying into seven GW34 clusters with refined layer specificity in either Layer 4 or 5 (highlighted in b). Dashed line shows the border between Layers 4 and 5. Scale bars, 500 µm.
Extended Data Fig. 12
Extended Data Fig. 12. Dynamic gene expression underlies diversification of EN subtypes.
a, Dot plots showing the top genes that are down- or up-regulated with gestational age among EN subtypes from each layer-based group. The genes that are downregulated over time in some categories but upregulated in others are highlighted in red. b, Dot plots similar to a, but showing the expression of these genes in individual EN subtypes. c, Curve plots showing the change of scaled expression over time in different EN groups and cortical lobes for selected genes. Top, across all cortical areas; bottom, showing each cortical lobe separately: data from PFC, PMC and M1 are averaged for frontal cortex; V1 and V2 are averaged for occipital cortex. d, Heatmap showing the genes with high expression variance among EN subtypes within the same group and gestational age. e, f, Dot plots showing the expression of high variance genes among EN subtypes in EN-ET-SP/L6b group at GW34 (g) and EN-ET-L5/6 group at GW22 (h). g, Summary expression heatmaps for high variance genes among EN subtypes display distinct laminar and areal enrichment.
Extended Data Fig. 13
Extended Data Fig. 13. V1-specific subtypes are exclusive, in contrast to more continuous arealization patterns elsewhere.
a, The delineation of sharp V1-V2 border by neuronal subtypes at GW20 is consistent across technical and biological replicates. Scale bars, 500 µm. b, Arrays of spatial maps of GW20 MERFISH experiments, showing V2-enriched clusters (in green) are broadly distributed in other cortical areas, whereas V1-enriched clusters (in purple) are found exclusively in the V1. Right, magnified views of the indicated regions.
Extended Data Fig. 14
Extended Data Fig. 14. Sharp V1-V2 border is seen in additional samples from GW20-21, but not GW18.
a, b, Spatial maps for selected EN subtypes show distinct border between V1 and V2 marked by sharp transition of EN subtypes at GW20 (a) and GW21 (b). Scale bars 500 µm. Right, ridgeline plots showing the horizontal cell density profile for V1- and V2- enriched EN subtypes in the CP near the border at GW21. c, Spatial graphs for GW18 occipital cortex showing all H3 subtypes and EN-ET, EN-IT, EN-Mig subtypes, respectively. No V1- or V2-specific clusters are identified at GW18, despite variation in cluster proportions within the putative V1 and V2 areas shown in d. d, Quantitative comparison of neuronal subtype composition in the annotated regions of V1 and V2 (magenta and green boxes in c), shown separately among EN-ET, ET-IT and EN-Mig. e, Z-score spatial plots showing that the genes that mark a sharp V1-V2 border at GW20 and 21, including NPY, PDZRN4, and ABI3BP were all expressed at very low levels at GW18. The MERFISH experiments were conducted using an expanded 960 gene panel (Supplementary Table 8), and thus not integrated with other experiments analyzed with the initial 300 gene panel. Clustering and annotation were conducted individually for each new sample (Supplementary Table 9). Scale bars, 500 µm.
Extended Data Fig. 15
Extended Data Fig. 15. Expression patterns of V1-V2 border markers in human, mouse, and macaque.
a, Z-score spatial maps of V1- and V2- enriched genes in GW21. To the left of the dashed lines shows the genes in Fig. 5g, while to the right of the dashed lines are genes only included in the expanded 960 gene panel. b, Venn diagrams for the overlap between V2-enriched (left) and V1- (right) DEGs across the four pairs of subtypes in Fig. 4c. Only strong DEGs with Log fold change >0.5 and adjusted p-value < 0.0001 were considered. See Supplementary Table 10. c, NPY expression in mouse and ferret cortex at various developmental stages does not resemble the pattern observed in human fetal cortex. Left, in situ hybridization images are taken from Allen Brain Atlas (https://developingmouse.brain-map.org/). Right, immunostaining images for P2 and P9 ferret cortex (repeated independently for 3 times) show similar areal and laminar expression pattern with mouse: In P9 ferret, NPY is expressed in the upper part of Layer 5, overlapping with Layer 5 marker CTIP2, but not Layer 4 marker RORB. This pattern differs from the V1-specific expression in Layers 3 and 4 observed in human GW20. Magnified view is shown to highlight the laminar pattern. The region of putative visual cortex (containing both V1 and V2) is labeled. d, NPY shows a clear V1-V2 border in mid-gestation fetal macaque (repeated independently for 2 times), as shown in E76 by single-molecule in situ hybridization (RNAscope) (top) and in E93 by immunostaining (bottom). e, Re-analysis of a published fetal macaque scRNAseq dataset identified 58 unsupervised clusters for EN, as shown by UMAP. Notably, clusters 35 and 37, highlighted in box, are exclusively found in V1 at E76 and E93. f, V1-specific marker genes identified in human mid-gestation show exclusive expression in clusters 35 and 37, but not in any other clusters. g, Histograms showing areal distribution of macaque EN clusters. Clusters are ranked from left to right based on the proportion contribution from V1. Not all clusters are shown due to space restrictions. Sample area annotations were taken directly from original dataset based on microdissection. Scale bars, 500 µm. The schematic in d,e was created using BioRender (https://www.biorender.com).
Extended Data Fig. 16
Extended Data Fig. 16. Supplementary analysis for the V1-V2 border at GW20.
a, Visium spatial graphs for V1- and V2-enriched genes show high consistency with MERFISH measurements in Fig. 4g. b, Heatmap showing the expression of top enriched marker genes for each Visium cluster. Columns represent individual Visium detection spots. c, Heatmap showing the expression of top DEGs between V1 and V2 Visium spot clusters identified separately for each cortical layer. d, Left, spatial graph for the medial occipital cortex at GW20, colored by all H3 subtypes from integrated clustering, show the V1-V2 border is distinctly visible in the CP. Scale bar, 500 µm. Right, spatial graphs for EN-Mig, IPC, and RG subtypes show that a border between V1 and V2 is not seen in the IZ, SVZ, or VZ.
Extended Data Fig. 17
Extended Data Fig. 17. Additional characterization on V1-V2 gene expression dynamics.
a, b, Spatial maps for EN subtypes showing V1- and V2-specific localization at GW34 (a) and adult (b), and ridgeline plots (right) showing the laminar distribution of V1- and V2- enriched EN subtypes within the cortical plate/grey matter. c, Examples of genes exhibiting dynamic V1-enrichment patterns among EN-ITs. d-f, Z-score spatial maps showing the expression pattern of genes exhibiting strong V1- enrichment at GW15 (d), GW34 (e), and adult (f). Scale bars, 500 µm.
Extended Data Fig. 18
Extended Data Fig. 18. Integrated snRNAseq and MERFISH analyses at the V1-V2 border.
a, ENVI Imputation results for V1-V2 border markers (row 1) show consistent expression patterns with direct measurements using Visium (row 2) and expand MERFISH gene panel (row 3), validating the accuracy of imputation. Row 4, box plots showing the distribution of uncertainty for imputation results of V1-V2 border genes (n = 467082 cells analyzed), estimated using Transcript Imputation with Spatial Single-cell Uncertainty Estimation (TISSUE) pipeline. Uncertainty values are represented as the logged width of the 95% confidence interval for imputed expression (in reads per cell), smaller values indicate higher confidence of prediction accuracy. Box plots show media value as center; lower and upper bounds of box correspond to the first and third quartiles; whiskers extend up to 1.5 times the interquartile range from the lower and upper bounds of the box. b, Constellation plots of cell types in different cortical areas show V1 and V2 share a developmental lineage that is distinct with PFC. Matching nodes between V1 and V2 have connection fraction > 0.2 except for EN-IT-L3 and EN-IT-L4. See Supplementary Table 12. c UMAP for 91,898 cells analyzed by snRNAseq, colored by unsupervised clustering. Adjacent tissue sections used for MERFISH experiments were dissociated for snRNAseq. FB121_F1 is GW20 PFC sample, FB080_O1 and FB080_O2 are both GW20 occipital cortex sample, containing both V1 and V2. FB080_O2 is closer to the occipital pole, and therefore contains a higher proportion of V1 than FB080_O1. d, Heatmaps showing cell type correspondence of snRNAseq clusters with MERFISH scSHC EN subtypes (left), and with Visium spot clusters (right). EN-IT-L4-V1 cluster from snRNAseq corresponds strongly to V1-specific Layer 3&4 EN-ITs (arrows), whereas EN-IT-UL-2 corresponds to V2-enriched Layer 3&4 EN-ITs. e, Histogram for the cell number contribution from each sample towards each cluster, highlighting the V1-exclusive presence of EN-IT-L4-V1. f, Z-score plots for the expression of V1- and V2- enriched genes demonstrate high consistency between snRNAseq, MERFISH, and Visium analysis. g, Gene ontology (GO) analysis reveals genes associated with synapse-related membrane components are upregulated in EN-IT-L4-V1, comparing to EN-IT-UL-2. h, Dot plot for specific signaling interactions between neuronal clusters highlight EN-IT-L4-V1 is unique among upper layer (UL) EN-ITs in receiving strong NRXN1-NLGN1 signaling from EN sources. Only significant interactions with p-value < 0.05 (one-sided permutation test) are shown. i, Immunostaining for synaptophysin shows no significant V1-V2 difference in puncta density in Layer 4. Quantification shows mean ± standard deviation, n = 5 images from 1 sample (UMB1759-O1). N.S., not significant, p-value = 0.192, student’s two-sided t-test. j, Left, in situ hybridization images from Allen Developmental Mouse Brain Atlas (https://developingmouse.brain-map.org/) showing the expression of CDH13, TRPC6 and CHRM2 in the mouse V1 at different developmental time points. Right, Visium spatial heatmaps and MERFISH z-score spatial graphs for the expression of CDH13, TRPC6 and CHRM2 at the human V1-V2 border at GW20. TRPC6 and CHRM2 expressions on MERFISH data are imputed based on snRNAseq data.

References

    1. Rubenstein, J. L. Annual research review: development of the cerebral cortex: implications for neurodevelopmental disorders. J. Child Psychol. Psychiatry52, 339–355 (2011). - PMC - PubMed
    1. Bystron, I., Blakemore, C. & Rakic, P. Development of the human cerebral cortex: Boulder Committee revisited. Nat. Rev. Neurosci.9, 110–122 (2008). - PubMed
    1. Amunts, K. & Zilles, K. Architectonic mapping of the human brain beyond Brodmann. Neuron88, 1086–1107 (2015). - PubMed
    1. Rakic, P., Ayoub, A. E., Breunig, J. J. & Dominguez, M. H. Decision by division: making cortical maps. Trends Neurosci.32, 291–301 (2009). - PMC - PubMed
    1. Geschwind, D. H. & Rakic, P. Cortical evolution: judge the brain by its cover. Neuron80, 633–647 (2013). - PMC - PubMed

LinkOut - more resources