. 2025 Jul;643(8073):1087-1096.
doi: 10.1038/s41586-025-09012-z. Epub 2025 May 14.

Interferon-γ orchestrates leptomeningeal anti-tumour response

Affiliations

Interferon-γ orchestrates leptomeningeal anti-tumour response

Jan Remsik et al. Nature. 2025 Jul.

Abstract

Metastasis to the cerebrospinal-fluid-filled leptomeninges, or leptomeningeal metastasis, represents a fatal complication of solid tumours1. Multimodal analyses of clinical specimens reveal substantial inflammatory infiltrate in leptomeningeal metastases with enrichment of IFNγ and resulting downstream signalling. Here, to investigate and overcome this futile anti-tumour response within the leptomeninges, we developed syngeneic lung cancer, breast cancer and melanoma leptomeningeal-metastasis mouse models. We show that transgenic host mice lacking IFNγ or its receptor fail to control the growth of leptomeningeal metastases growth. Leptomeningeal overexpression of Ifng through a targeted adeno-associated-virus-based system controls cancer cell growth independent of adaptive immunity. Using a suite of transgenic hosts, we demonstrate that leptomeningeal T cells generate IFNγ to actively recruit and activate peripheral myeloid cells, generating a diverse spectrum of dendritic cell subsets. Independent of antigen presentation, migratory CCR7+ dendritic cells orchestrate the influx, proliferation and cytotoxic action of natural killer cells to control cancer cell growth in the leptomeninges. This study identifies unique, leptomeninges-specific IFNγ signalling and suggests an immune-therapeutic approach against tumours within this space.


Conflict of interest statement

Competing interests: J.R. and A.B. are listed as inventors on provisional patent applications based on this study, filed by MSKCC. A.B. holds an unpaid position on the scientific advisory board for Evren Scientific and is listed as an inventor on the following patents: 62/258,044, 10/413,522 and 63/052,139. D.P. is on the scientific advisory board of Insitro. The other authors declare no competing interests.

Figures

Fig. 1
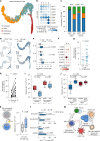
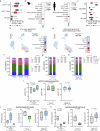
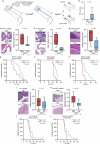
Fig. 1. Inflammation-induced pleocytosis in patients with LM.
a, Representative images of Giemsa-stained cytospins from patients with cancer without (top) and with (bottom) LM; major cell populations are indicated. Ly, lymphocytes; MM, monocytes and macrophages; cc, cancer cells. n = 5 per group. Scale bars, 20 μm. b, Uniform manifold approximation and projection (UMAP) projection of human CSF immune cell types and cancer cells, isolated from patients with cancer without (n = 3 patients and n = 1,196 cells) and with (n = 5 patients and n = 16,022 cells) LM. LM+ samples were retrieved from Gene Expression Omnibus (GEO) GSE150660 and coloured by cell type. An experimental overview, cell type annotations and quality-control plots are provided in Supplementary Fig. 1 and the Methods. c, Embedding density plots from patients without or with LM, projecting the relative cell type abundance per condition onto the UMAP. d, Relative CSF IFNγ levels in patients with cancer with or without LM from a wide array of solid tumours, as determined by proximity extension assay. NPX, normalized protein expression. See also Extended Data Fig. 1. e, Post-LM diagnosis survival in relation to CSF IFNγ levels at diagnosis. Statistical analysis was performed using the log-rank test. Source Data
Fig. 2
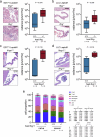
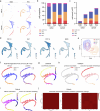
Fig. 2. Host IFNγ signalling suppresses leptomeningeal cancer growth.
a, Representative images of haematoxylin-stained cytospins from vehicle-injected (top) and E0771 LeptoM-injected (bottom) mice. n = 3 per group. Scale bars, 50 μm. See also Extended Data Fig. 2. b, UMAP analysis of leptomeningeal cellular material from vehicle- and LLC LeptoM-injected mice 2 weeks after inoculation, after single-cell proteogenomic profiling using 10x CITE-seq. n = 7,528 (vehicle injected) and n = 19,534 (LLC LeptoM-injected) cells, n = 6 mice per group. See also Supplementary Figs.  2 and 3. c, Embedding density plots from LM and LM+ mice, projecting the relative cell type abundance per condition onto the UMAP. d, Cytometry bead array quantification of CSF IFNγ from naive or LeptoM-bearing mice. e, Representative leptomeningeal tissue sections were stained with haematoxylin and eosin (H&E). Scale bars, 100 μm. The box plot shows the brain surface area covered with pigmented B16 LeptoM cells delivered intracisternally into C57BL/6 Ifng-proficient and Ifng-deficient mice, 2 weeks after injection. f, In vivo radiance of LLC LeptoM cells delivered intracisternally into mice with WT T cells and mice with ΔIfng T cells, quantified 2 weeks after injection. g, In vivo radiance of LLC LeptoM cells delivered intracisternally into mice with WT NK cells and mice with ΔIfng NK cells, quantified 2 weeks after injection. h, Representative leptomeningeal tissues were stained with H&E. The box plot shows the brain surface area covered with pigmented B16 LeptoM cells delivered intracisternally into C57BL/6 Ifngr1−/− and Ifngr1+/+ mice, 2 weeks after injection. The basilar meninges of these animals is shown. Scale bars, 100 μm (left) and 5 mm (right). i, Survival of mice after control LeptoM cells (sglacz, n = 10) and two Ifngr2-deficient B16 LeptoM clones (sg1, n = 10 and sg2, n = 9) were delivered intracisternally into C57BL/6 mice. Median overall survival: mOS sglacz (18 days), sg1 (15 days), sg2 (18 days). j, Schematic showing that the leptomeningeal T cells are the dominant generator of IFNγ-mediated cancer cell elimination. Source Data
Fig. 3
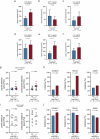
Fig. 3. IFNγ controls the growth of metastatic cancer in the leptomeninges independent of the adaptive immune system and monocytes and macrophages.
a, Schematics of the simplified experimental strategy to generate leptomeningeal eGFP or Ifng overexpression (Methods and Extended Data Fig. 9). b, Representative leptomeningeal tissue sections were stained with H&E. Scale bars, 100 μm. The box plot illustrates the in vivo radiance of lung-cancer-derived LLC LeptoM cells delivered intracisternally into C57BL/6-Tyrc-2 mice overexpressing eGFP or Ifng in the leptomeninges, quantified 2 weeks after injection. c, Survival of LLC LeptoM-bearing C57BL/6-Tyrc-2 mice overexpressing eGFP or Ifng in the leptomeninges. Statistical analysis was performed using the log-rank test. d, In vivo radiance of LLC LeptoM cells delivered intracisternally into NSG mice overexpressing eGFP or Ifng in the leptomeninges, quantified 2 weeks after injection. NSG, non-obese, diabetic, severe combined immunodeficient, Il2rgnull mice. e, In vivo radiance of LLC LeptoM cells delivered intracisternally into RAG1-deficient animals overexpressing eGFP or Ifng in the leptomeninges, quantified 2 weeks after injection. f, Representative immunofluorescence image of brain tissue from cancer-naive mice overexpressing eGFP or Ifng in the leptomeninges, stained for IBA1+ myeloid cells. Scale bars, 50 μm. Quantification of IBA1+ cells in the ventricular choroid plexuses is shown. g, In vivo radiance of LLC LeptoM cells delivered intracisternally into mice with WT myeloid cells and mice with ΔIfngr1 myeloid cells and quantified 2 weeks after injection. Myeloid LysM-driven cre is expressed predominantly in monocytes, macrophages and neutrophils. Source Data
Fig. 4
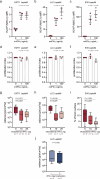
Fig. 4. Leptomeningeal IFNγ supports cDC maturation.
a, In vivo radiance of LLC LeptoM cells delivered intracisternally into Zbtb46-DTR (recipient C57BL/6-Tyrc-2) bone marrow chimeras, treated with DTx and measured 2 weeks after cancer cell injection (Methods and Extended Data Fig. 11). b, In vivo radiance of LLC LeptoM cells delivered intracisternally into Clec9acre and Clec9acreRosa26lsl-DTR mice treated with DTx, 2 weeks after injection. c, In vivo radiance of LLC LeptoM cells delivered intracisternally into Zbtb46-DTR (recipient C57BL/6-Tyrc-2) bone marrow chimeras overexpressing eGFP or Ifng into the leptomeninges, treated with DTx, 2 weeks after injection. d, t-Distributed stochastic neighbour embedding (t-SNE) of mouse leptomeningeal DC types from vehicle- (veh.) and LLC LeptoM-injected mice 2 weeks after inoculation, analysed using 10x CITE-seq (Methods and Extended Data Fig. 12). n = 7,566 cells pooled from 4 conditions, n = 6 animals per group. e, Surface protein and Ccr7 gene expression in DCs from the experiment in d. f, Gene expression trends associated with cDC2, CCR7+ identity and IFNγ signalling along the diffusion pseudotime axis, as determined using Palantir. g, In vivo radiance of LLC LeptoM cells delivered intracisternally into mice with WT cDCs and mice with ΔIfngr1 cDCs, 2 weeks after injection. h, The proportion of mature leptomeningeal CCR7+ (CD11c+MHC-II+) DCs in LLC LeptoM-bearing Ifngr1-proficient and Ifngr1-deficient mice. i, T cell-derived IFNγ governs maturation of leptomeningeal cDC2 subset into mature, migratory CCR7+ DCs. j, UMAP of identity (left) and cell cycle phase prediction (right) in LLC LeptoM cancer cells expressing cytokeratin and CD63. n = 3,161 and n = 557 cells from mice overexpressing eGFP and Ifng in the leptomeninges, respectively; n = 6 mice per group. k, Quantification of the experiment in e (Methods and Extended Data Fig. 13i–k). l, Representative image of cleaved-caspase-3-stained (Cl. CASP3) E0771 LeptoM in mice overexpressing eGFP or Ifng in the leptomeninges. Scale bars, 50 μm; br., brain parenchyma. See also Extended Data Fig. 13l–n. Source Data
Fig. 5
Fig. 5. cDC cytokines support NK cell activity to control cancer cell growth.
a, t-SNE projection of leptomeningeal NK cells from vehicle- and LLC LeptoM-injected mice 2 weeks after inoculation, analysed using 10x CITE-seq. Total of n = 2,247 cells from 4 conditions, n = 6 mice per group (Methods). b, Cell-state-enriched NK surface protein expression from the experiment in a. N, naive; A, activated; P, proliferative; S, senescent-like. c, NK cell cycle prediction from the experiment in a (Methods). d, Selected CCR7+ DC ligand and NK cell receptor expression from the experiment in a, projected onto t-SNE plots (Methods). e, The relative abundance of CSF IL-12, IL-15 and IL-18 from patients without and with LM, as determined using targeted proteomics. Statistical analysis was performed using multiple t-tests. f, Human NK surface protein expression, as determined using single-cell transcriptomics. g, NK cell survival in the CSF of patients without and with LM. Two independent experiments (Methods). h, NK cell survival in human LM CSF with or without recombinant mouse IL-12 and IL-15. Four independent experiments. Statistical analysis was performed using paired t-tests (Methods). i, In vivo radiance of LLC LeptoM cells delivered intracisternally into C57BL/6-Tyrc-2 mice overexpressing eGFP or Ifng in the leptomeninges treated with isotype or asialo-GM1 antibodies, 2 weeks after injection. j, In vivo radiance of LLC LeptoM cells delivered intracisternally into C57BL/6 Ifngr1−/− and Ifngr1+/+ mice treated with isotype or asialo-GM1 antibodies, 2 weeks after injection. k, In vivo radiance of LLC LeptoM cells delivered intracisternally into mice with WT NK cells and mice with ΔIfngr1 NK cells, 2 weeks after injection. l, NK products in the CSF of patients without and with LM, as determined using bead arrays. Statistical analysis was performed using multiple t-tests. m, In the leptomeninges, T cells produce IFNγ, supporting maturation of conventional DC2 cells into migratory CCR7+ DCs. These DCs produce IL-12 and IL-15 to support the survival and proliferation of NK cells, which control the expansion of metastatic cells. Source Data
Extended Data Fig. 1
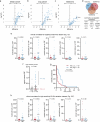
Extended Data Fig. 1. Targeted proteomics with proximity extension assay of inflammatory mediators in human CSF.
(a) Targeted proteomic analysis of 92 inflammatory mediators in CSF of breast cancer patients without and with LM by proximity extension assay (multiple t-tests). (b) Targeted proteomic analysis of 92 inflammatory mediators in CSF of lung cancer patients without and with LM by proximity extension assay (multiple t-tests). (c) Targeted proteomic analysis of 92 inflammatory mediators in CSF of melanoma patients without and with LM by proximity extension assay (multiple t-tests). (d) Overlap of inflammatory mediators significantly enriched in CSF of LM+ patients, plotted per primary cancer type (Venn diagram, top panel). Overview of 15 proteins enriched in CSF from LM+ patients and all three cancer types. (e) Scatter plots show numbers of CSF leukocytes, lymphocytes, myeloid cells, neutrophils, and cancer cells for patients with available clinical differential counts; low (n = 25) and high (n = 28) levels of CSF IFN-γ, related to Fig. 1e. (f) Levels of CSF IFN-γ in cancer patients with or without LM from wide array of solid tumours, as determined with ELISA (LM- n = 50, LM+ n = 107). Patients with undetectable (u.d.) IFN-γ levels and patients with high outliers were used for correlative analyses in panels g and h. (g) Kaplan-Meier plot showing post-LM diagnosis survival in relation to CSF IFN-γ levels, related to panel f; logrank test. (h) Scatter plots show numbers of CSF leukocytes, lymphocytes, myeloid cells, neutrophils, and cancer cells for patients with available clinical differential counts; u.d. (n = 28) and high (n = 16) levels of CSF IFN-γ, related to panel g. Source Data
Extended Data Fig. 2
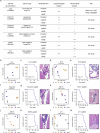
Extended Data Fig. 2. Immunocompetent mouse models of leptomeningeal metastasis.
(a) Overview of cancer cells lines used and generated in this study. (b) Principal component analysis (PCA) of in vitro transcriptome of Parental (grey, n = 3), LeptoM (purple, n = 3), and BrM1 (orange, n = 3) LLC cells. Retrieved from NCBI GEO GSE83132. (c) Kaplan-Meier plot showing survival of C57Bl/6-Tyrc-2 animals overexpressing Egfp in the leptomeninges after delivery of LLC LeptoM cells into cisterna magna (related to Fig. 3c). Representative brain tissue sections stained with H&E showing colonization of leptomeninges after intracardiac delivery of LLC LeptoM cells (scale bar = 100 μm). mOS - median overall survival. (d) Principal component analysis (PCA) of in vitro transcriptome of Parental (grey, n = 3) and newly established LeptoM (purple, n = 4), and BrM2 (orange, n = 3) B16 cells. (e) Kaplan-Meier plot showing survival of C57Bl/6 animals overexpressing Egfp in the leptomeninges after delivery of B16 LeptoM cells into cisterna magna (related to Extended Data Fig. 9f). Representative brain tissue sections stained with H&E showing colonization of leptomeninges after intracardiac delivery of B16 LeptoM cells (scale bar = 100 μm). mOS - median overall survival. (f) Principal component analysis (PCA) of in vitro transcriptome of Parental (grey, n = 3) and newly established LeptoM (purple, n = 3), and BrM2 (orange, n = 3) Yumm5.2 cells. (g) Kaplan-Meier plot showing survival of C57Bl/6 and C57Bl/6-Tyrc-2 animals overexpressing Egfp in the leptomeninges after delivery of Yumm5.2 LeptoM cells into cisterna magna (related to Extended Data Fig. 9l). Representative brain tissue sections stained with H&E showing colonization of leptomeninges after intracardiac delivery of Yumm5.2 LeptoM cells (scale bar = 100 μm). mOS - median overall survival. (h) Principal component analysis (PCA) of in vitro transcriptome of Parental (grey, n = 3) and newly established LeptoM (purple, n = 5), and BrM2 (orange, n = 3) E0771 cells. (i) Kaplan-Meier plot showing survival of C57Bl/6-Tyrc-2 animals overexpressing Egfp in the leptomeninges after delivery of E0771 LeptoM cells into cisterna magna (related to Extended Data Fig. 9d). Representative brain tissue sections stained with H&E showing colonization of leptomeninges after intracardiac delivery of E0771 LeptoM cells (scale bar = 100 μm). mOS - median overall survival. (j) Principal component analysis (PCA) of in vitro transcriptome of Parental (grey, n = 3) and newly established LeptoM (purple, n = 3), and BrM2 (orange, n = 3) EMT6 cells. (k) Kaplan-Meier plot showing survival of BALB/c animals overexpressing Egfp in the leptomeninges after delivery of EMT6 LeptoM cells into cisterna magna (related to Extended Data Fig. 9h). Representative brain tissue sections stained with H&E showing colonization of leptomeninges after intracardiac delivery of EMT6 LeptoM cells (scale bar = 100 μm). mOS - median overall survival. (l) Principal component analysis (PCA) of in vitro transcriptome of Parental (grey, n = 3) and newly established LeptoM (purple, n = 3), and BrM2 (orange, n = 3) 4T1 cells. (m) Kaplan-Meier plot showing survival of BALB/c animals overexpressing Egfp in the leptomeninges after delivery of 4T1 LeptoM cells into cisterna magna (related to Extended Data Fig. 9j). Representative brain tissue sections stained with H&E showing colonization of leptomeninges after intracardiac delivery of 4T1 LeptoM cells (scale bar = 100 μm). mOS - median overall survival. Source Data
Extended Data Fig. 3
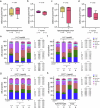
Extended Data Fig. 3. Interaction between leptomeningeal metastasis and systemic immunity.
(a) In vivo radiance of subcutaneous LLC LeptoM tumours two weeks after injection of leptomeningeal tumour from the same subline. Quantification shows extracranial radiance at four weeks. (b) In vivo radiance of leptomeningeal LLC LeptoM tumours in the presence of subcutaneous tumour from the same subline. Extracranial tumours were injected two weeks before intracisternal implantation, and quantification shows cranial radiance after two weeks. Related to panel N. (c) In vivo radiance of mammary E0771 LeptoM tumour two weeks after injection of leptomeningeal tumour from the same subline. Quantification shows extracranial radiance at four weeks. (d) In vivo radiance of leptomeningeal E0771 LeptoM tumours in the presence of mammary tumour from the same subline. Extracranial tumours were injected two weeks before intracisternal implantation, and quantification shows cranial radiance after two weeks. Related to panel P. (e) Proportion of major leptomeningeal immune cell types in control and LLC LeptoM-bearing mice. Cells were injected subcutaneously and/or intracisternally. Related to panel N. (f) Proportion of major leptomeningeal immune cell types in control and LLC LeptoM-bearing mice. Cells were injected into lungs and/or intracisternally. (g) Proportion of major leptomeningeal immune cell types in control and E0771 LeptoM-bearing mice. Cells injected into mammary fat pad and/or intracisternally. Related to panel P. (h) Proportion of major leptomeningeal and lung immune cell types in control and E0771 LeptoM-bearing mice. Cells were injected intracardially (multiple t-tests; column numbers for comparison are shown below the group sizes, B – B cells, T – T cells, MM – monocytes & macrophages, Neu – neutrophils, NK – NK cells, cDC – conventional dendritic cells, pDC – plasmacytoid dendritic cells). Source Data
Extended Data Fig. 4
Extended Data Fig. 4. IFN-γ production and response in leptomeninges.
(a) Proportion of T cells (CD3+CD4+CD8- vs. CD3+CD4-CD8+) and NK cells (CD3-Nk1.1+) expressing IFN-γ in cells isolated from vehicle- or B16, E0771, and LLC LeptoM-injected mice, determined with flow cytometry. (b) Expression of IFNG gene in mouse (left) and human (right) single-cell datasets. (c) Abundance of phosphorylated STAT1 (pSTAT1) in leptomeningeal dendritic cells (MHC II+ CD11c+), monocyte-macrophages (CD11b+Ly6C+ and CD11b+F4/80+), T cells (CD3+), and NK cells (Nk1.1+), as a proxy for IFN-γ pathway activation in vehicle- and LLC LeptoM-injected mice, determined with flow cytometry. (d) Gene scores of IFN-γ-associated gene set, identified in this study and projected onto human CSF single-cell sequencing data from Fig. 1b. See Methods for details. (e) Gene scores of Hallmark Interferon Gamma Response gene set, projected onto human CSF single-cell sequencing data from Fig. 1b. (f) Proportion of major leptomeningeal immune cell types in the leptomeninges of LLC LeptoM-bearing mice depleted for NK cells and T cells two weeks after injection and continuous depletion (multiple t-tests). (g) Proportion of major leptomeningeal immune cell types in the leptomeninges of LLC LeptoM-bearing T cellwt and T cellΔIfng mice (multiple t-tests). (h) Proportion of major leptomeningeal immune cell types in the leptomeninges of LLC LeptoM-bearing NK cellwt and NK cellΔIfng mice (multiple t-tests). (i) Abundance of phosphorylated STAT1 (pSTAT1) in leptomeningeal dendritic cells (MHC II+ CD11c+) in LLC LeptoM-bearing mice depleted for NK cells and T cells, in T cellwt and T cellΔIfng mice, and in NK cellwt and NK cellΔIfng mice two weeks after injection. (j) Dendritic cell counts in leptomeninges from LLC LeptoM-bearing mice depleted for NK cells and T cells, in T cellwt and T cellΔIfng mice, and in NK cellwt and NK cellΔIfng mice two weeks after injection. (k) NK cell counts in leptomeninges from LLC LeptoM-bearing mice depleted for NK cells and T cells, in T cellwt and T cellΔIfng mice, and in NK cellwt and NK cellΔIfng mice two weeks after injection. (B – B cells, T – T cells, MM – monocytes & macrophages, Neu – neutrophils, NK – NK cells, DC – dendritic cells). Source Data
Extended Data Fig. 5
Extended Data Fig. 5. Leptomeningeal tumour growth in Ifng- and Ifngr1-deficient animals.
(a) Representative leptomeningeal tissue sections stained with H&E (scale bar = 100 μm). Box plot illustrates in vivo radiance of E0771 LeptoM cells delivered intracisternally into C57BL/6 Ifng-proficient and -deficient animals, quantified two weeks after injection. (b) Representative leptomeningeal tissue sections stained with H&E (scale bar = 100 μm). Box plot illustrates in vivo radiance of LLC LeptoM cells delivered intracisternally into C57BL/6 Ifng-proficient and -deficient animals, quantified two weeks after injection. (c) Representative leptomeningeal tissue sections stained with H&E (scale bar = 100 μm). Box plot illustrates in vivo radiance of E0771 LeptoM cells delivered intracisternally into C57BL/6 Ifngr1-proficient and -deficient animals, quantified two weeks after injection. (d) Representative leptomeningeal tissue sections stained with H&E (scale bar = 100 μm). Box plot illustrates in vivo radiance of LLC LeptoM cells delivered intracisternally into C57BL/6 Ifngr1-proficient and -deficient animals, quantified two weeks after injection. (e) Proportion of major leptomeningeal immune cell types in naïve and LLC LeptoM-bearing C57BL/6 Ifngr1-proficient and -deficient animals two weeks after vehicle or intracisternal cancer cell injection, determined with flow cytometry (multiple t-tests; B – B cells, T – T cells, MM – monocytes & macrophages, Neu – neutrophils, NK – NK cells, cDC – conventional dendritic cells, pDC – plasmacytoid dendritic cells). Source Data
Extended Data Fig. 6
Extended Data Fig. 6. Extracranial tumour growth in Ifng- and Ifngr1-deficient animals.
(a) Volumes of intradermal B16 LeptoM flank tumours in C57BL/6 Ifng-proficient and -deficient animals, quantified two weeks after injection. (b) Volumes of mammary fat pad E0771 LeptoM tumours in C57BL/6 Ifng-proficient and -deficient animals, quantified four weeks after injection. (c) Volumes of subcutaneous LLC LeptoM flank tumours in C57BL/6 Ifng-proficient and -deficient animals, quantified three weeks after injection. (d) Volumes of intradermal B16 LeptoM flank tumours in C57BL/6 Ifngr1-proficient and -deficient animals, quantified two weeks after injection. (e) Volumes of mammary fat pad E0771 LeptoM tumours in C57BL/6 Ifngr1-proficient and -deficient animals, quantified four weeks after injection. (f) Volumes of subcutaneous LLC LeptoM flank tumours in C57BL/6 Ifngr1-proficient and -deficient animals, quantified three weeks after injection. (g) Cranial and extracranial in vivo radiance of non-metastatic E0771 Parental cells injected intracardially into C57BL/6 Ifngr1-proficient and -deficient animals two weeks after injection. Notably, one Ifngr1-deficient animal developed histologically confirmed periventricular lesion with cancer cells spread to the contralateral ventricle. (h) Incidence of overt radiographic metastases in cranial (brain), thoracic (lung), and pelvic (femoral bone) regions of C57BL/6 Ifngr1-proficient and -deficient animals from Extended Data Fig. 6g. (i) Cranial and extracranial in vivo radiance of brain-metastatic E0771 BrM2 cells injected intracardially into C57BL/6 Ifngr1-proficient and -deficient animals two weeks after injection. (j) Incidence of overt radiographic metastases in cranial (brain), thoracic (lung), and pelvic (femoral bone) regions of C57BL/6 Ifngr1-proficient and -deficient animals from Extended Data Fig. 6i. Source Data
Extended Data Fig. 7
Extended Data Fig. 7. Cancer-intrinsic IFN-γ signalling is dispensable for tumour growth in leptomeninges.
(a) In vitro induction of MHC class I in control (sgLacZ) and two Ifngr2-deficient E0771 LeptoM clones with recombinant IFN-γ. Data pooled from three independent experiments. (b) In vitro induction of MHC class I in control (sgLacZ) and two Ifngr2-deficient LLC LeptoM clones with recombinant IFN-γ. Data pooled from three independent experiments. (c) In vitro induction of MHC class I in control (sgLacZ) and two Ifngr2-deficient B16 LeptoM clones with recombinant IFN-γ. Data pooled from three independent experiments. (d) In vitro proliferation of control (sgLacZ) and two Ifngr2-deficient E0771 LeptoM clones exposed to recombinant IFN-γ. Data pooled from three independent experiments. (e) In vitro proliferation of control (sgLacZ) and two Ifngr2-deficient LLC LeptoM clones exposed to recombinant IFN-γ. Data pooled from three independent experiments. (f) In vitro proliferation of control (sgLacZ) and two Ifngr2-deficient B16 LeptoM clones exposed to recombinant IFN-γ. Data pooled from three independent experiments. (g) In vivo radiance of control (sgLacZ) and two Ifngr2-deficient E0771 LeptoM clones delivered intracisternally into C57Bl/6-Tyrc-2 animals, quantified three weeks after injection in one in vivo experiment. (h) In vivo radiance of control (sgLacZ) and two Ifngr2-deficient LLC LeptoM clones delivered intracisternally into C57Bl/6-Tyrc-2 animals, quantified two weeks after injection in one in vivo experiment. Source Data
Extended Data Fig. 8
Extended Data Fig. 8. Leptomeningeal IFN-γ-mediated tumour growth suppression is driven by the microenvironment.
(a) In vitro induction of MHC class I in E0771 LeptoM cells with recombinant IFN-γ. Data pooled from three independent experiments. (b) In vitro induction of MHC class I in LLC LeptoM cells with recombinant IFN-γ. Data pooled from three independent experiments. (c) In vitro induction of MHC class I in B16 LeptoM cells with recombinant IFN-γ. Data pooled from three independent experiments. (d) In vitro proliferation of E0771 LeptoM cells exposed to recombinant IFN-γ. Data pooled from three independent experiments. (e) In vitro proliferation of LLC LeptoM cells exposed to recombinant IFN-γ. Data pooled from three independent experiments. (f) In vitro proliferation of B16 LeptoM cells exposed to recombinant IFN-γ. Data pooled from three independent experiments. (g) In vivo tumour growth of E0771 LeptoM cells in C57Bl/6-Tyrc-2 animals injected weekly with vehicle or two doses of recombinant IFN-γ, as a function of radiance. (h) In vivo tumour growth of LLC LeptoM cells in C57Bl/6-Tyrc-2 animals injected weekly with vehicle or two doses of recombinant IFN-γ, as a function of radiance. (i) In vivo tumour growth of B16 LeptoM cells in C57Bl/6 animals injected weekly with vehicle or two doses of recombinant IFN-γ, as a function of radiance. (j) In vivo tumour growth of LLC LeptoM cells in C57Bl/6-Tyrc-2 animals injected weekly with heat-inactivated vehicle (PBS) or heat-inactivated recombinant IFN-γ, as a function of radiance in one in vivo experiment. Source Data
Extended Data Fig. 9
Extended Data Fig. 9. Leptomeninges-specific overexpression of IFN-γ extends survival of LeptoM cells-bearing animals.
(a) Schematic showing experimental strategy of leptomeningeal Egfp or Ifng overexpression, used for functional experiments in this study. (b) Levels of IFN-γ in the CSF collected from naïve C57Bl/6 and BALB/c animals overexpressing Egfp or Ifng in the leptomeninges, detected by cytometric bead array. (c) Representative leptomeningeal tissue sections stained with H&E (scale bar = 100 μm). Box plot illustrates in vivo radiance of E0771 LeptoM cells delivered intracisternally into C57Bl/6-Tyrc-2 animals overexpressing Egfp or Ifng in the leptomeninges, quantified two weeks after injection. (d) Kaplan-Meier plot showing survival of E0771 LeptoM-bearing C57Bl/6-Tyrc-2 animals overexpressing Egfp or Ifng in the leptomeninges (logrank test). (e) Representative leptomeningeal tissue sections stained with H&E (scale bar = 100 μm). Box plot illustrates brain surface area covered with pigmented B16 LeptoM cells delivered intracisternally into C57BL/6 animals overexpressing Egfp or Ifng in the leptomeninges, quantified two weeks after injection. (f) Kaplan-Meier plot showing survival of B16 LeptoM-bearing C57Bl/6 animals overexpressing Egfp or Ifng in the leptomeninges (logrank test). (g) Representative leptomeningeal tissue sections stained with H&E (scale bar = 100 μm). Box plot illustrates in vivo radiance of EMT6 LeptoM cells delivered intracisternally into BALB/c animals overexpressing Egfp or Ifng in the leptomeninges, quantified two weeks after injection. (h) Kaplan-Meier plot showing survival of EMT6 LeptoM-bearing BALB/c animals overexpressing Egfp or Ifng in the leptomeninges (logrank test). (i) Representative leptomeningeal tissue sections stained with H&E (scale bar = 100 μm). Box plot illustrates in vivo radiance of 4T1 LeptoM cells delivered intracisternally into BALB/c animals overexpressing Egfp or Ifng in the leptomeninges, quantified one week after injection. (j) Kaplan-Meier plot showing survival of 4T1 LeptoM-bearing BALB/c animals overexpressing Egfp or Ifng in the leptomeninges (logrank test). (k) Representative leptomeningeal tissue sections stained with H&E (scale bar = 100 μm). Box plot illustrates in vivo radiance of Yumm5.2 LeptoM cells delivered intracisternally into C57Bl6-Tyrc-2 animals overexpressing Egfp or Ifng in the leptomeninges, quantified three weeks after injection. (l) Kaplan-Meier plot showing survival of Yumm5.2 LeptoM-bearing C57Bl/6 and C57Bl/6-Tyrc-2 animals overexpressing Egfp or Ifng in the leptomeninges (logrank test). Source Data
Extended Data Fig. 10
Extended Data Fig. 10. Leptomeningeal IFN-γ does not affect morphology of brain parenchyma but reduces oligodendrocyte numbers in corpus callosum.
(a) Representative images of brain tissue sections from naïve C57Bl/6 animals overexpressing Egfp or Ifng stained with Luxol Fast Blue (n = 4 per group, 3 months after AAV introduction, scale bar = 500 μm). (b) Representative images of brain tissue sections from naïve C57Bl/6 animals overexpressing Egfp or Ifng stained for astrocyte activation marker GFAP (n = 4 per group, 3 months after AAV introduction, scale bar = 100 μm) and quantification of GFAP+ periventricular layer thickness. (c) Representative images of brain tissue sections from naïve C57Bl/6 animals overexpressing Egfp or Ifng stained for microglia marker Iba1 (n = 4 per group, 3 months after AAV introduction, scale bar = 100 μm) and quantification of Iba1+ microglia in cortical layers 3 and 4. (d) Representative images of brain tissue sections from naïve C57Bl/6 animals overexpressing Egfp or Ifng stained for neural progenitor marker DCX (n = 4 per group, 3 months after AAV introduction, scale bar = 100 μm) and quantification of DCX fluorescence in the hippocampus. (e) Representative images of brain tissue sections from naïve C57Bl/6 animals overexpressing Egfp or Ifng stained for myelinization marker MBP (n = 4 per group, 3 months after AAV introduction, scale bar = 200 μm) and quantification of overage MBP+ tract area per hemisphere. (f) Representative images of brain tissue sections from naïve C57Bl/6 animals overexpressing Egfp or Ifng stained for marker of mature neurons NeuN (n = 4 per group, 3 months after AAV introduction, scale bar = 200 μm) and quantification of NeuN+ mature neurons per FOV in cortical layers 1–4 (left) and 5-6 (right). See outline in panel F. (g) Quantification of leptomeningeal leukocytes. (h) Flow cytometric analysis of major leptomeningeal immune cell types (multiple t-tests; B – B cells, T – T cells, MM – monocytes & macrophages, Neu – neutrophils, NK – NK cells, cDC – conventional dendritic cells, pDC – plasmacytoid dendritic cells). (i) Representative images of corpus callosum sections from naïve C57Bl/6 animals overexpressing Egfp or Ifng stained for marker of oligodendrocytes Olig2 (n = 4 per group, 3 months after AAV introduction, scale bar = 100 μm), and quantification of Olig2+ oligodendrocytes per FOV in corpus callosum. (j) Representative images of brain tissue sections from naïve C57Bl/6 animals overexpressing Egfp or Ifng stained for markers of oligodendrocytes Olig2 and CNPase (n = 4 per group, 3 months after AAV introduction, scale bar = 100 μm) and quantification of Olig2+ oligodendrocytes per FOV in cortical and subcortical regions, and CNPase+ oligodendrocytes per FOV in cortical and subcortical regions (corresponding regions are marked in the representative images). Source Data
Extended Data Fig. 11
Extended Data Fig. 11. Leptomeningeal IFN-γ does not require adaptive immune system and signals through conventional dendritic cells to suppress metastatic outgrowth.
(a) In vivo radiance of E0771 LeptoM cells delivered intracisternally into NSG animals overexpressing Egfp or Ifng in the leptomeninges, quantified two weeks after injection. (NSG - non-obese, diabetic, severe combined immunodeficient, Il2rgnull). (b) Kaplan-Meier plot showing survival of LLC LeptoM-bearing NSG animals overexpressing Egfp or Ifng in the leptomeninges (logrank test). (c) Kaplan-Meier plot showing survival of E0771 LeptoM-bearing NSG animals overexpressing Egfp or Ifng in the leptomeninges (logrank test). (d) In vivo radiance of E0771 LeptoM cells delivered intracisternally into Rag1-deficient animals overexpressing Egfp or Ifng in the leptomeninges, quantified two weeks after injection. (NSG - non-obese, diabetic, severe combined immunodeficient, Il2rgnull). (e) Kaplan-Meier plot showing survival of LLC LeptoM-bearing Rag1-deficient animals overexpressing Egfp or Ifng in the leptomeninges (logrank test). (f) Kaplan-Meier plot showing survival of E0771 LeptoM-bearing Rag1-deficient animals overexpressing Egfp or Ifng in the leptomeninges (logrank test). (g) Representative images of dendritic cell marker CD11c in leptomeningeal cancer plaques in wild-type (WT) and Zbtb46-DTR bone marrow chimeras, treated with diphtheria toxin (DTx). Mice were injected with LLC LeptoM cells (scale bar = 20 μm). (h) Representative images of dendritic cell marker CD11c in spleen of wild-type (WT) and Zbtb46-DTR bone marrow chimeras, treated with diphtheria toxin (DTx). Mice were injected with LLC LeptoM cells (scale bar = 20 μm). (i) Quantification of systemic cDC depletion in images from panel B. (j) In vivo radiance of LLC LeptoM cells delivered subcutaneously into Zbtb46-DTR bone marrow chimeras. Recipient mice were on C57Bl6-Tyrc-2 background, bioluminescence was measured two weeks after cancer cell injection after continuous administration of vehicle (saline) or diphtheria toxin. (k) In vivo radiance of E0771 LeptoM cells delivered intracisternally into Clec9acre and Clec9acreRosa26lsl-DTR mice after administration of diphtheria toxin two weeks after injection. (l) In vivo radiance of LLC LeptoM cells delivered subcutaneously into Clec9acre and Clec9acreRosa26lsl-DTR mice after administration of diphtheria toxin two weeks after injection. (m) Proportion of major leptomeningeal immune cell types in naïve and LLC LeptoM-bearing Clec9acre and Clec9acreRosa26lsl-DTR animals two weeks after intracisternal cancer cell injection and continuous administration of diphtheria toxin, determined with flow cytometry (multiple t-tests; B – B cells, T – T cells, MM – monocytes & macrophages, Neu – neutrophils, NK – NK cells, cDC – conventional dendritic cells, pDC – plasmacytoid dendritic cells). Source Data
Extended Data Fig. 12
Extended Data Fig. 12. Trajectory analysis of leptomeningeal dendritic cells.
(a) tSNE maps showing abundance of captured dendritic cell types in naïve and metastasis-bearing, Egfp- or Ifng-overexpressing mice (total of n = 7,566 cells pooled from 4 conditions and n = 6 animals per group). (b) Proportion of dendritic cell subtypes per condition. (c) Counts of dendritic cell subtypes per condition. (d) tSNE projection of dendritic cell surface markers detected with CITE-seq. CD11c - pan-DC marker; Xcr1 - cDC1 marker; CD11b - cDC2 marker; B220 - pDC marker. (e) Bivariate plot showing distribution of cell surface Xcr1 and CD11b in leptomeningeal dendritic cell subsets, as detected with CITE-seq. (f) tSNE projection of 2,575 mouse leptomeningeal DCs subsetted for trajectory analysis. Cells are from Egfp-overexpressing, naïve and cancer-bearing mice, and the plots are coloured based on cell type and condition. See Methods for further details. (g) tSNE projection of CytoTRACE pseudotime, as determined with CellRank, suggesting that CCR7+ DCs are the terminal state within the subsetted cell population. (h) Terminal DC macrostates and computed macrostate membership for each cell, as predicted with CellRank and projected onto a tSNE. While cDC1 cells are restricted to cDC1 membership, cells from cDC2 cluster are gradually acquiring CCR7 + DC membership. (i) Palantir-computed diffusion pseudotime and CCR7 + DC maturation (branch) probability. Gene trends along this pseudotime axis are plotted in Fig. 4d. (j) Plots show Pearson correlation of pseudotime orderings in Palantir analysis for different parameters (waypoint samplings, number of principal components, and number of K-nearest neighbours) and all cells. DC trajectory analysis, performed as described in Methods, is not sensitive to fluctuations in these parameters. Source Data
Extended Data Fig. 13
Extended Data Fig. 13. Lineage tracing of leptomeningeal CCR7+ dendritic cells and characterization metastatic cancer cells in Egfp- and Ifng-overexpressing mice.
(a) Proportion of leptomeningeal, CD11c+ MHC II+ double-positive cDC in LLC LeptoM-bearing Ifngr1-proficient and deficient mice. (b) Proportion leptomeningeal, IL12-producing CCR7+ DCs in LLC LeptoM-bearing Ifngr1-proficient and deficient mice. (c) Proportion of mCherry+ CCR7+ DCs across various conditions. mCherry reports the expression of Xcr1 and shows that only a minority of CCR7+ DCs expressed mCherry and originated in cDC1 subtype. (d) Classification of leptomeningeal, CD11c+ MHC II+ double-positive cDC into immature (CCR7-) and mature (CCR7+) subtypes across various conditions. (e) Proportion of Xcr1+ CCR7+ DCs across various conditions, confirming lineage tracing from Extended Data Fig. 12. (f) Schematic shows experimental design of strategy used to determine the cranial or extracranial origin of leptomeningeal immune cells. CD45.2 mice were irradiated with their cranium shielded and infused with CD45.1 bone marrow that colonized the depleted bones. CD45.2+ immune cells would after recovery predominantly originate in the shielded cranial bone marrow, while CD45.1+ immune cells would arrive from peripheral sites. (g) Quantification of bone marrow reconstitution. Cells in femoral bone marrow (BM) and circulation are mainly CD45.1 + , while cells isolated from cranial BM are CD45.2. (h) Determination of cDC subtype origin. Unlike neutrophils that are mostly sourced from proximal cranial BM, cDC are colonizing leptomeninges in naïve and LLC LeptoM-bearing animals from peripheral BM. (i) Quantification of cancer cells captured in the mouse single-cell atlas (n = 3,718 keratin+ CD63+ cells isolated from n = 6 mice per group); related to Fig. 4j. (j) GSEApy analysis of top 15 Reactome 2022 pathways enriched in cancer cells isolated from Ifng-overexpressing animals and subsetted as described in Fig. 4j (DEG cut-off P < 0.01). (k) GSEApy analysis of top 15 Reactome 2022 pathways enriched in cancer cells isolated from Egfp-overexpressing animals and subsetted as described in Fig. 4j (DEG cut-off P < 0.01). (l) Quantification of cleaved Caspase 3-positive cells in cancer plaques and clusters, in the leptomeninges of Egfp- or Ifng-overexpressing animals injected with LLC LeptoM cells. (m) Quantification of cleaved Caspase 3-positive cells in cancer plaques and clusters, in the leptomeninges of Egfp- or Ifng-overexpressing animals injected with E0771 LeptoM cells. (n) Quantification of cleaved Caspase 3-positive cells in cancer plaques and clusters, in the leptomeninges of Egfp- or Ifng-overexpressing animals injected with B16 LeptoM cells. Source Data
Extended Data Fig. 14
Extended Data Fig. 14. NK cells are the downstream cytotoxic effectors of leptomeningeal IFN-γ.
(a) Kaplan-Meier plot showing survival of LLC LeptoM-bearing C57Bl/6-Tyrc-2 animals overexpressing Egfp or Ifng in the leptomeninges, depleted with control polyclonal antibody (left graph) or antibody targeting asialo-GM1 (logrank test). (b) Kaplan-Meier plot showing survival of E0771 LeptoM-bearing C57Bl/6-Tyrc-2 animals overexpressing Egfp or Ifng in the leptomeninges, depleted with control polyclonal antibody (left graph) or antibody targeting asialo-GM1 (logrank test). (c) Kaplan-Meier plot showing survival of B16 LeptoM-bearing C57Bl/6 animals overexpressing Egfp or Ifng in the leptomeninges, depleted with control polyclonal antibody (left graph) or antibody targeting asialo-GM1 in one experiment (logrank test). (d) Efficiency of systemic asialo-GM1-targeting depletion of NK cells in naïve C57Bl/6 animals, quantified in leptomeninges with flow cytometry. (e) Efficiency of systemic asialo-GM1-targeting depletion of NK cells in naïve C57Bl/6 animals, quantified in spleen with flow cytometry. (f) Proportion of EdU+ NK cells in LLC LeptoM-bearing NK cellwt and NK cellΔIfngr1 animals two weeks after intracisternal cancer cell injection, determined with flow cytometry. (g) Proportion of EdU+ NK cells in LLC LeptoM-bearing C57BL/6 Ifngr1-proficient and -deficient animals two weeks after intracisternal cancer cell injection, determined with flow cytometry. Source Data

References

    1. Wilcox, J. A. et al. Leptomeningeal metastases from solid tumors: a SNO and ASCO consensus review on clinical management and future directions. Neuro Oncol.10.1093/neuonc/noae103 (2024). - PMC - PubMed
    1. Klemm, F. et al. Interrogation of the microenvironmental landscape in brain tumors reveals disease-specific alterations of immune cells. Cell181, 1643–1660 (2020). - PMC - PubMed
    1. Boire, A. et al. Complement component 3 adapts the cerebrospinal fluid for leptomeningeal metastasis. Cell168, 1101–1113 (2017). - PMC - PubMed
    1. Smalley, I. et al. Proteomic analysis of CSF from patients with leptomeningeal melanoma metastases identifies signatures associated with disease progression and therapeutic resistance. Clin. Cancer Res.26, 2163–2175 (2020). - PMC - PubMed
    1. Yoo, B. C. et al. Cerebrospinal fluid metabolomic profiles can discriminate patients with leptomeningeal carcinomatosis from patients at high risk for leptomeningeal metastasis. Oncotarget8, 101203–101214 (2017). - PMC - PubMed

MeSH terms

LinkOut - more resources